Recipe Business Model Canvas

Business Model Canvas: Tactical blueprint to scale growth, revenue, and customer reach
Unlock the strategic blueprint behind Recipe’s growth with our Business Model Canvas — a concise, actionable breakdown of value propositions, customer segments, channels, and revenue streams. Ideal for founders, investors, and consultants, the full downloadable canvas (Word & Excel) reveals risks, opportunities, and tactical levers to scale—get it and accelerate your strategy.
Partnerships

Strategic food suppliers
Partnerships with national and regional producers secure consistent quality and pricing for proteins, produce and beverages, with 60–70% of volume often covered by preferred-supplier agreements in 2024. Long-term contracts and hedging cut input volatility by roughly 20–30% industry-wide (2024). Co-innovation enables 20–25% annual menu refreshes and limited-time offers, while supplier compliance programs support food safety and traceability standards.
Franchisees and master franchisees
Franchisees and master franchisees expand footprint and bring local market expertise while investing initial capital—2024 industry averages show royalty rates of 4–8% and initial franchise fees often in the $20k–$50k range. Ongoing support covers training, marketing, operations and tech enablement; performance frameworks use royalties, KPIs and quality audits; collective purchasing yields volume-driven cost savings across the system.

Real estate developers and landlords
Site-selection partners secure high-traffic positions in malls, power centres and urban streets, where 2024 footfall in top centres recaptured roughly 85–95% of 2019 levels, boosting baseline sales. Negotiated leases with tenant-improvement allowances typically range from 50–150 USD/sq ft in 2024 markets, materially improving unit economics. Co-tenancy strategies with complementary retailers can lift adjacent-store traffic by double digits, while data-driven trade-area analysis informs infill and relocations to target catchments with the highest sales-per-sq-ft potential.

Delivery platforms and logistics
Aggregators extend off-premise reach across brands and dayparts but charge commissions typically between 15–30% (2024 industry norm), so fee structures, promotions and data-sharing are tightly negotiated to protect margins; hybrid or in-house fleets can lower per-order delivery costs by ~10–25% versus pure-aggregator models (2024 operator reports), while packaging partners ensure temperature retention and presentation on multi-mile runs.
- Commission range: 15–30% (2024)
- Hybrid/in-house savings: ~10–25% per order
- Data-sharing controls to protect margins
- Packaging partners preserve quality on longer deliveries
Marketing, tech, and payment providers
Agencies, martech vendors and POS/payment firms enable omnichannel campaigns and seamless transactions, with the CRM software market surpassing 80 billion USD in 2024, driving deeper personalization. Loyalty and CRM platforms centralize guest data for targeted offers, while cybersecurity and compliance partners protect customer and franchise data against rising breaches. Analytics providers deliver demand forecasting and menu optimization to reduce waste and lift AUVs.
- Agencies: omnichannel campaign execution
- Martech/CRM: centralized guest profiles
- POS/payments: smooth transactions
- Security: data protection & compliance
- Analytics: forecasting & menu optimization
Suppliers 60–70% share; hedging cuts volatility 20–30%
Preferred suppliers cover 60–70% volume (2024), long-term contracts and hedging cut input volatility 20–30%, franchises drive expansion with 4–8% royalties and $20k–$50k fees, aggregators charge 15–30% commission while hybrid fleets save ~10–25% per order; CRM market topped 80B USD in 2024 supporting loyalty and analytics.
| Partner | Key metric (2024) |
|---|---|
| Producers | 60–70% volume; 20–30% volatility reduction |
| Franchisees | Royalties 4–8%; fees $20k–$50k |
| Aggregators | Commissions 15–30%; hybrid saves 10–25% |
| Martech/CRM | CRM market 80B USD |
What is included in the product
 Detailed Word Document
A tailored Recipe Business Model Canvas presenting nine BMC blocks with detailed customer segments, value propositions, channels, revenue streams and operational plans. Designed for entrepreneurs and analysts, it includes competitive advantage analysis, SWOT-linked insights and a polished format for presentations, investor pitches and validation using real company data.

 Customizable Excel Spreadsheet
Streamlines recipe-driven business planning into a single editable canvas to eliminate scattered notes and save hours of formatting. Great for quickly aligning teams, testing menu or process changes, and creating shareable, board-ready summaries.
Activities

Brand and menu development
Continuous R&D keeps menus relevant across casual, quick service and premium formats as operators compete in a foodservice market exceeding $1 trillion in 2024. Culinary testing, guest trials and cost engineering aim to balance taste and margin, with targeted food-cost improvements often yielding 1–2 percentage-point gains. Seasonal LTOs and bundled value offers drive traffic and mix, while nutritional transparency and allergen management sustain guest trust.
Restaurant operations excellence
Daily execution covers food prep, service, cleanliness and speed, with QSR targets commonly 3–5 minute service windows. Standard operating procedures and training standardize quality across sites. Labor scheduling and inventory control manage costs; 2024 industry benchmarks show food cost 28–35% of sales and labor 30–35%. Mystery shops and audits reinforce compliance, safety and guest experience.

Franchise support and expansion
Recruiting qualified operators accelerates growth and aligns capital, enabling 40% faster openings versus corporate-only expansion; standardized onboarding, site selection, and opening playbooks cut ramp-up risk by ~30% in 2024 pilots. Ongoing coaching, field support, and quarterly performance reviews lift unit productivity ~7% and EBITDA margins, while renewal and refranchising programs sustain portfolio health with renewal rates above 85%.

Supply chain and procurement
Centralized buying captures scale pricing (2024 median COGS savings ~9%) and improves supplier reliability through preferred contracts; advanced forecasting and distribution planning cut stockouts by ~30% and food waste by ~25% in 2024 pilots. Rigorous QA programs ensure ~98% supplier compliance with specs, while contingency sourcing reduced supplier-related disruptions by ~40% in 2024 case studies.
- Scale pricing: ~9% COGS reduction (2024)
- Forecasting: ~30% fewer stockouts, ~25% less waste (2024)
- QA: ~98% supplier compliance
- Contingency sourcing: ~40% fewer disruptions (2024)
Digital, marketing, and loyalty
Owned apps and websites enable ordering, offers, and table bookings, with apps driving about 40% of digital orders in 2024. CRM and loyalty programs personalize incentives, with loyalty members spending ~18% more and visiting ~20% more. Media planning spans TV, social, search, and partnerships (approx. 30/50/20 split), while analytics steer pricing, promotions, and menu mix.
- apps: 40% digital orders
- loyalty: +18% spend, +20% visits
- media split: 30/50/20
- analytics: pricing & menu optimization
Menu R&D + costing: ~9% COGS cut; apps 40% digital
Continuous menu R&D and cost engineering keep offerings relevant in a >$1T 2024 foodservice market, delivering targeted 1–2pp food-cost gains. Daily ops focus on 3–5min QSR service, food cost 28–35% and labor 30–35% of sales. Scale procurement, apps and loyalty drive efficiency: ~9% COGS savings, apps 40% digital orders, loyalty +18% spend/+20% visits.
| Metric | 2024 |
|---|---|
| Market size | >$1T |
| Food cost | 28–35% |
| Labor | 30–35% |
| COGS savings | ~9% |
| Apps | 40% digital orders |
| Loyalty lift | +18% spend/+20% visits |
Full Version Awaits
Business Model Canvas
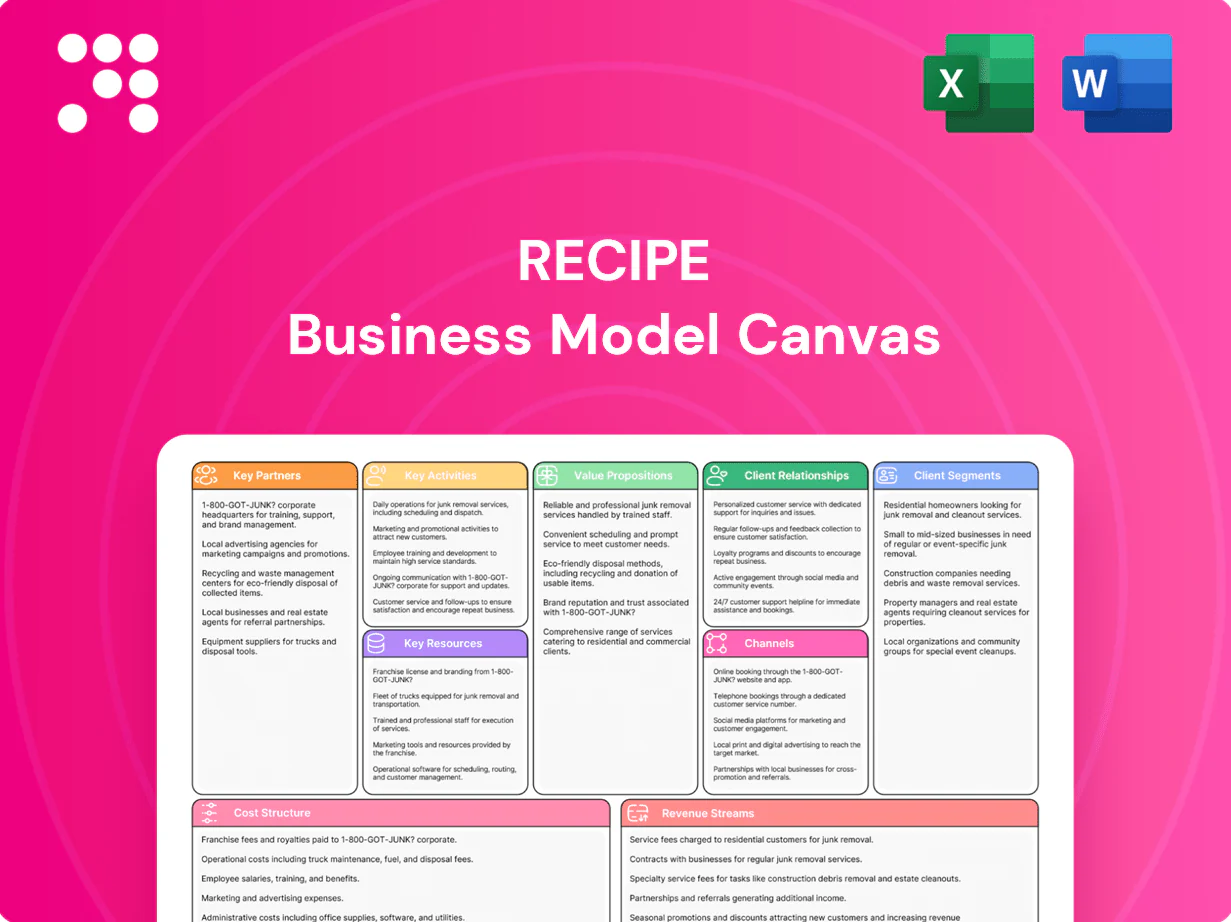
The Recipe Business Model Canvas previewed here is the actual deliverable, not a mockup or sample. When you purchase, you’ll receive this exact document—fully formatted, editable, and ready to use—in Word and Excel formats. No placeholders, no surprises: what you see is what you’ll download and apply immediately.

Business Model Canvas: Tactical blueprint to scale growth, revenue, and customer reach
Unlock the strategic blueprint behind Recipe’s growth with our Business Model Canvas — a concise, actionable breakdown of value propositions, customer segments, channels, and revenue streams. Ideal for founders, investors, and consultants, the full downloadable canvas (Word & Excel) reveals risks, opportunities, and tactical levers to scale—get it and accelerate your strategy.
Partnerships
Strategic food suppliers
Partnerships with national and regional producers secure consistent quality and pricing for proteins, produce and beverages, with 60–70% of volume often covered by preferred-supplier agreements in 2024. Long-term contracts and hedging cut input volatility by roughly 20–30% industry-wide (2024). Co-innovation enables 20–25% annual menu refreshes and limited-time offers, while supplier compliance programs support food safety and traceability standards.
Franchisees and master franchisees
Franchisees and master franchisees expand footprint and bring local market expertise while investing initial capital—2024 industry averages show royalty rates of 4–8% and initial franchise fees often in the $20k–$50k range. Ongoing support covers training, marketing, operations and tech enablement; performance frameworks use royalties, KPIs and quality audits; collective purchasing yields volume-driven cost savings across the system.
Real estate developers and landlords
Site-selection partners secure high-traffic positions in malls, power centres and urban streets, where 2024 footfall in top centres recaptured roughly 85–95% of 2019 levels, boosting baseline sales. Negotiated leases with tenant-improvement allowances typically range from 50–150 USD/sq ft in 2024 markets, materially improving unit economics. Co-tenancy strategies with complementary retailers can lift adjacent-store traffic by double digits, while data-driven trade-area analysis informs infill and relocations to target catchments with the highest sales-per-sq-ft potential.
Delivery platforms and logistics
Aggregators extend off-premise reach across brands and dayparts but charge commissions typically between 15–30% (2024 industry norm), so fee structures, promotions and data-sharing are tightly negotiated to protect margins; hybrid or in-house fleets can lower per-order delivery costs by ~10–25% versus pure-aggregator models (2024 operator reports), while packaging partners ensure temperature retention and presentation on multi-mile runs.
- Commission range: 15–30% (2024)
- Hybrid/in-house savings: ~10–25% per order
- Data-sharing controls to protect margins
- Packaging partners preserve quality on longer deliveries
Marketing, tech, and payment providers
Agencies, martech vendors and POS/payment firms enable omnichannel campaigns and seamless transactions, with the CRM software market surpassing 80 billion USD in 2024, driving deeper personalization. Loyalty and CRM platforms centralize guest data for targeted offers, while cybersecurity and compliance partners protect customer and franchise data against rising breaches. Analytics providers deliver demand forecasting and menu optimization to reduce waste and lift AUVs.
- Agencies: omnichannel campaign execution
- Martech/CRM: centralized guest profiles
- POS/payments: smooth transactions
- Security: data protection & compliance
- Analytics: forecasting & menu optimization
Suppliers 60–70% share; hedging cuts volatility 20–30%
Preferred suppliers cover 60–70% volume (2024), long-term contracts and hedging cut input volatility 20–30%, franchises drive expansion with 4–8% royalties and $20k–$50k fees, aggregators charge 15–30% commission while hybrid fleets save ~10–25% per order; CRM market topped 80B USD in 2024 supporting loyalty and analytics.
| Partner | Key metric (2024) |
|---|---|
| Producers | 60–70% volume; 20–30% volatility reduction |
| Franchisees | Royalties 4–8%; fees $20k–$50k |
| Aggregators | Commissions 15–30%; hybrid saves 10–25% |
| Martech/CRM | CRM market 80B USD |
What is included in the product
Detailed Word Document
A tailored Recipe Business Model Canvas presenting nine BMC blocks with detailed customer segments, value propositions, channels, revenue streams and operational plans. Designed for entrepreneurs and analysts, it includes competitive advantage analysis, SWOT-linked insights and a polished format for presentations, investor pitches and validation using real company data.
Customizable Excel Spreadsheet
Streamlines recipe-driven business planning into a single editable canvas to eliminate scattered notes and save hours of formatting. Great for quickly aligning teams, testing menu or process changes, and creating shareable, board-ready summaries.
Activities
Brand and menu development
Continuous R&D keeps menus relevant across casual, quick service and premium formats as operators compete in a foodservice market exceeding $1 trillion in 2024. Culinary testing, guest trials and cost engineering aim to balance taste and margin, with targeted food-cost improvements often yielding 1–2 percentage-point gains. Seasonal LTOs and bundled value offers drive traffic and mix, while nutritional transparency and allergen management sustain guest trust.
Restaurant operations excellence
Daily execution covers food prep, service, cleanliness and speed, with QSR targets commonly 3–5 minute service windows. Standard operating procedures and training standardize quality across sites. Labor scheduling and inventory control manage costs; 2024 industry benchmarks show food cost 28–35% of sales and labor 30–35%. Mystery shops and audits reinforce compliance, safety and guest experience.
Franchise support and expansion
Recruiting qualified operators accelerates growth and aligns capital, enabling 40% faster openings versus corporate-only expansion; standardized onboarding, site selection, and opening playbooks cut ramp-up risk by ~30% in 2024 pilots. Ongoing coaching, field support, and quarterly performance reviews lift unit productivity ~7% and EBITDA margins, while renewal and refranchising programs sustain portfolio health with renewal rates above 85%.
Supply chain and procurement
Centralized buying captures scale pricing (2024 median COGS savings ~9%) and improves supplier reliability through preferred contracts; advanced forecasting and distribution planning cut stockouts by ~30% and food waste by ~25% in 2024 pilots. Rigorous QA programs ensure ~98% supplier compliance with specs, while contingency sourcing reduced supplier-related disruptions by ~40% in 2024 case studies.
- Scale pricing: ~9% COGS reduction (2024)
- Forecasting: ~30% fewer stockouts, ~25% less waste (2024)
- QA: ~98% supplier compliance
- Contingency sourcing: ~40% fewer disruptions (2024)
Digital, marketing, and loyalty
Owned apps and websites enable ordering, offers, and table bookings, with apps driving about 40% of digital orders in 2024. CRM and loyalty programs personalize incentives, with loyalty members spending ~18% more and visiting ~20% more. Media planning spans TV, social, search, and partnerships (approx. 30/50/20 split), while analytics steer pricing, promotions, and menu mix.
- apps: 40% digital orders
- loyalty: +18% spend, +20% visits
- media split: 30/50/20
- analytics: pricing & menu optimization
Menu R&D + costing: ~9% COGS cut; apps 40% digital
Continuous menu R&D and cost engineering keep offerings relevant in a >$1T 2024 foodservice market, delivering targeted 1–2pp food-cost gains. Daily ops focus on 3–5min QSR service, food cost 28–35% and labor 30–35% of sales. Scale procurement, apps and loyalty drive efficiency: ~9% COGS savings, apps 40% digital orders, loyalty +18% spend/+20% visits.
| Metric | 2024 |
|---|---|
| Market size | >$1T |
| Food cost | 28–35% |
| Labor | 30–35% |
| COGS savings | ~9% |
| Apps | 40% digital orders |
| Loyalty lift | +18% spend/+20% visits |
Full Version Awaits
Business Model Canvas
The Recipe Business Model Canvas previewed here is the actual deliverable, not a mockup or sample. When you purchase, you’ll receive this exact document—fully formatted, editable, and ready to use—in Word and Excel formats. No placeholders, no surprises: what you see is what you’ll download and apply immediately.
Original: $10.00
-65%$10.00
$3.50Description
Business Model Canvas: Tactical blueprint to scale growth, revenue, and customer reach
Unlock the strategic blueprint behind Recipe’s growth with our Business Model Canvas — a concise, actionable breakdown of value propositions, customer segments, channels, and revenue streams. Ideal for founders, investors, and consultants, the full downloadable canvas (Word & Excel) reveals risks, opportunities, and tactical levers to scale—get it and accelerate your strategy.
Partnerships
Strategic food suppliers
Partnerships with national and regional producers secure consistent quality and pricing for proteins, produce and beverages, with 60–70% of volume often covered by preferred-supplier agreements in 2024. Long-term contracts and hedging cut input volatility by roughly 20–30% industry-wide (2024). Co-innovation enables 20–25% annual menu refreshes and limited-time offers, while supplier compliance programs support food safety and traceability standards.
Franchisees and master franchisees
Franchisees and master franchisees expand footprint and bring local market expertise while investing initial capital—2024 industry averages show royalty rates of 4–8% and initial franchise fees often in the $20k–$50k range. Ongoing support covers training, marketing, operations and tech enablement; performance frameworks use royalties, KPIs and quality audits; collective purchasing yields volume-driven cost savings across the system.
Real estate developers and landlords
Site-selection partners secure high-traffic positions in malls, power centres and urban streets, where 2024 footfall in top centres recaptured roughly 85–95% of 2019 levels, boosting baseline sales. Negotiated leases with tenant-improvement allowances typically range from 50–150 USD/sq ft in 2024 markets, materially improving unit economics. Co-tenancy strategies with complementary retailers can lift adjacent-store traffic by double digits, while data-driven trade-area analysis informs infill and relocations to target catchments with the highest sales-per-sq-ft potential.
Delivery platforms and logistics
Aggregators extend off-premise reach across brands and dayparts but charge commissions typically between 15–30% (2024 industry norm), so fee structures, promotions and data-sharing are tightly negotiated to protect margins; hybrid or in-house fleets can lower per-order delivery costs by ~10–25% versus pure-aggregator models (2024 operator reports), while packaging partners ensure temperature retention and presentation on multi-mile runs.
- Commission range: 15–30% (2024)
- Hybrid/in-house savings: ~10–25% per order
- Data-sharing controls to protect margins
- Packaging partners preserve quality on longer deliveries
Marketing, tech, and payment providers
Agencies, martech vendors and POS/payment firms enable omnichannel campaigns and seamless transactions, with the CRM software market surpassing 80 billion USD in 2024, driving deeper personalization. Loyalty and CRM platforms centralize guest data for targeted offers, while cybersecurity and compliance partners protect customer and franchise data against rising breaches. Analytics providers deliver demand forecasting and menu optimization to reduce waste and lift AUVs.
- Agencies: omnichannel campaign execution
- Martech/CRM: centralized guest profiles
- POS/payments: smooth transactions
- Security: data protection & compliance
- Analytics: forecasting & menu optimization
Suppliers 60–70% share; hedging cuts volatility 20–30%
Preferred suppliers cover 60–70% volume (2024), long-term contracts and hedging cut input volatility 20–30%, franchises drive expansion with 4–8% royalties and $20k–$50k fees, aggregators charge 15–30% commission while hybrid fleets save ~10–25% per order; CRM market topped 80B USD in 2024 supporting loyalty and analytics.
| Partner | Key metric (2024) |
|---|---|
| Producers | 60–70% volume; 20–30% volatility reduction |
| Franchisees | Royalties 4–8%; fees $20k–$50k |
| Aggregators | Commissions 15–30%; hybrid saves 10–25% |
| Martech/CRM | CRM market 80B USD |
What is included in the product
Detailed Word Document
A tailored Recipe Business Model Canvas presenting nine BMC blocks with detailed customer segments, value propositions, channels, revenue streams and operational plans. Designed for entrepreneurs and analysts, it includes competitive advantage analysis, SWOT-linked insights and a polished format for presentations, investor pitches and validation using real company data.
Customizable Excel Spreadsheet
Streamlines recipe-driven business planning into a single editable canvas to eliminate scattered notes and save hours of formatting. Great for quickly aligning teams, testing menu or process changes, and creating shareable, board-ready summaries.
Activities
Brand and menu development
Continuous R&D keeps menus relevant across casual, quick service and premium formats as operators compete in a foodservice market exceeding $1 trillion in 2024. Culinary testing, guest trials and cost engineering aim to balance taste and margin, with targeted food-cost improvements often yielding 1–2 percentage-point gains. Seasonal LTOs and bundled value offers drive traffic and mix, while nutritional transparency and allergen management sustain guest trust.
Restaurant operations excellence
Daily execution covers food prep, service, cleanliness and speed, with QSR targets commonly 3–5 minute service windows. Standard operating procedures and training standardize quality across sites. Labor scheduling and inventory control manage costs; 2024 industry benchmarks show food cost 28–35% of sales and labor 30–35%. Mystery shops and audits reinforce compliance, safety and guest experience.
Franchise support and expansion
Recruiting qualified operators accelerates growth and aligns capital, enabling 40% faster openings versus corporate-only expansion; standardized onboarding, site selection, and opening playbooks cut ramp-up risk by ~30% in 2024 pilots. Ongoing coaching, field support, and quarterly performance reviews lift unit productivity ~7% and EBITDA margins, while renewal and refranchising programs sustain portfolio health with renewal rates above 85%.
Supply chain and procurement
Centralized buying captures scale pricing (2024 median COGS savings ~9%) and improves supplier reliability through preferred contracts; advanced forecasting and distribution planning cut stockouts by ~30% and food waste by ~25% in 2024 pilots. Rigorous QA programs ensure ~98% supplier compliance with specs, while contingency sourcing reduced supplier-related disruptions by ~40% in 2024 case studies.
- Scale pricing: ~9% COGS reduction (2024)
- Forecasting: ~30% fewer stockouts, ~25% less waste (2024)
- QA: ~98% supplier compliance
- Contingency sourcing: ~40% fewer disruptions (2024)
Digital, marketing, and loyalty
Owned apps and websites enable ordering, offers, and table bookings, with apps driving about 40% of digital orders in 2024. CRM and loyalty programs personalize incentives, with loyalty members spending ~18% more and visiting ~20% more. Media planning spans TV, social, search, and partnerships (approx. 30/50/20 split), while analytics steer pricing, promotions, and menu mix.
- apps: 40% digital orders
- loyalty: +18% spend, +20% visits
- media split: 30/50/20
- analytics: pricing & menu optimization
Menu R&D + costing: ~9% COGS cut; apps 40% digital
Continuous menu R&D and cost engineering keep offerings relevant in a >$1T 2024 foodservice market, delivering targeted 1–2pp food-cost gains. Daily ops focus on 3–5min QSR service, food cost 28–35% and labor 30–35% of sales. Scale procurement, apps and loyalty drive efficiency: ~9% COGS savings, apps 40% digital orders, loyalty +18% spend/+20% visits.
| Metric | 2024 |
|---|---|
| Market size | >$1T |
| Food cost | 28–35% |
| Labor | 30–35% |
| COGS savings | ~9% |
| Apps | 40% digital orders |
| Loyalty lift | +18% spend/+20% visits |
Full Version Awaits
Business Model Canvas
The Recipe Business Model Canvas previewed here is the actual deliverable, not a mockup or sample. When you purchase, you’ll receive this exact document—fully formatted, editable, and ready to use—in Word and Excel formats. No placeholders, no surprises: what you see is what you’ll download and apply immediately.











