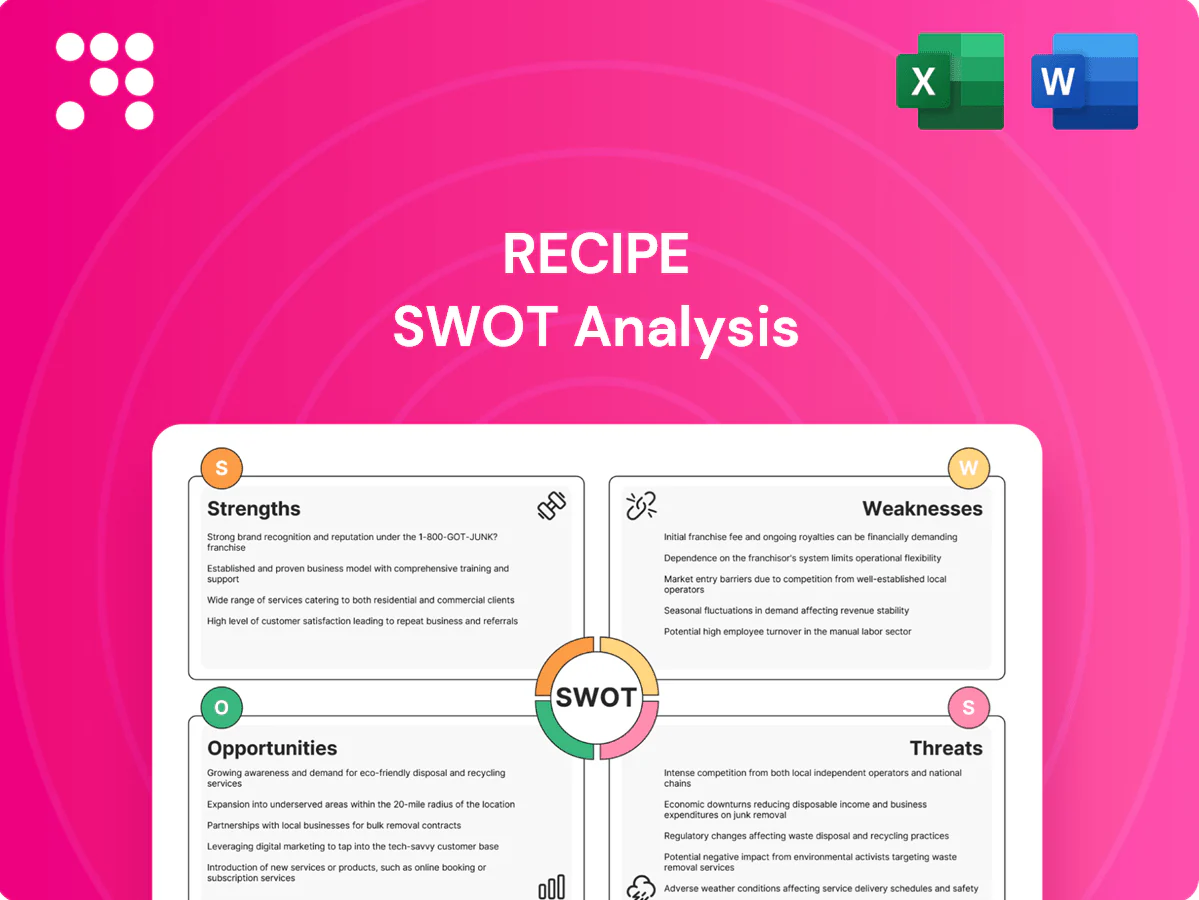
Recipe SWOT Analysis

Go Beyond the Preview—Access the Full Strategic Report
Uncover the strategic ingredients behind Recipe’s market edge with our concise SWOT preview—then get the full SWOT analysis for granular insights, financial context, and tactical recommendations. The complete report includes editable Word and Excel deliverables to support planning, pitching, or investment decisions. Purchase now to move from insight to action.
Strengths

Market-leading scale
Recipe Unlimited is Canada’s largest full-service restaurant operator, running 20+ brands and roughly 1,200 locations nationwide, which delivers purchasing leverage, strong brand visibility and coast-to-coast reach. Scale improves unit economics and marketing efficiency while providing broader customer and sales data for insights. Network effects strengthen supply, logistics and training capabilities. Diversified revenue across company-owned and franchised units enhances resilience.
Multi-brand portfolio
Operating across casual, QSR and fine-dining lets Recipe capture occasions from everyday visits to premium nights out; diversified portfolios (leading multi-brand operators run roughly 40,000–60,000 units globally) hedge demand shifts and stabilize revenue. Cross-selling and shared best practices speed menu-innovation transfer and cut R&D per concept, while 3–5 year pruning/refresh cycles keep concepts relevant.

Franchise-driven cash flows
Franchise-driven cash flows cut capital intensity by shifting store capex to franchisees while generating stable royalties—typical royalty rates run about 4–8% of system sales; McDonald’s, with ~93% franchised restaurants in 2024, illustrates this model. The capital-light mix often delivers materially higher ROIC versus company-owned rollouts and faster scalability, reinforced by franchisee support, training and performance-management systems and lower volatility from a geographically diversified franchisee base.

Operational infrastructure
Centralized procurement, culinary R&D, and training yield standardized processes and KPIs that cut COGS 8–12% and speed rollouts ~30% (2024 industry benchmarks); integrated tech platforms and supply-chain partnerships shorten lead times ~20% and improve distribution efficiency.
- Centralized buying: 8–12% COGS reduction
- Faster rollouts: ~30% quicker via SOPs/KPIs
- Supply chain: ~20% shorter lead times
- Analytics: 5–8% labor cost savings, +12% menu contribution
Brand equity and loyalty
Entrenched Canadian household recognition across flagship brands such as Swiss Chalet, Harvey's and Milestones drives repeat visits through established loyalty programs and robust digital channels (online ordering, apps, CRM). Strong off-premise awareness is reinforced by delivery and takeout formats, while consistent food safety and quality standards sustain guest trust and low variability in experience.
- Flagship national brands
- Digital ordering + loyalty
- High off-premise visibility
- Trusted food safety & consistency
Scale QSR platform: 20+ brands, 8-12% COGS cut
Recipe Unlimited operates 20+ brands and ~1,200 locations, delivering national scale, purchasing leverage and strong household recognition. Centralized procurement, R&D and training cut COGS 8–12%, speed rollouts ~30% and shorten lead times ~20%. A franchise-heavy model generates stable royalties (typical 4–8% of system sales) and capital-light growth, while analytics drive 5–8% labor savings and +12% menu contribution.
| Metric | Value |
|---|---|
| Brands | 20+ |
| Locations | ~1,200 |
| COGS reduction | 8–12% |
| Faster rollouts | ~30% |
| Lead time reduction | ~20% |
| Royalty rate | 4–8% |
| Analytics impact | 5–8% labor savings; +12% menu contribution |
What is included in the product
 Detailed Word Document
Provides a concise SWOT assessment of Recipe’s internal capabilities and external market forces, identifying core strengths, weaknesses, growth opportunities, and potential threats to guide strategic decision-making.

 Customizable Excel Spreadsheet
Delivers a recipe-focused SWOT matrix that pinpoints ingredient, cost, and process pain points for rapid remediation and menu optimization.
Weaknesses

Exposure to dine-in cycles
Dependence on discretionary dine-in spend makes Recipe vulnerable to macro slowdowns; Statistics Canada reports food services sales reached about CAD 110 billion in 2023, underscoring cyclical demand. Full-service formats face shifts to at-home consumption and delivery, pressuring same-store traffic. Higher fixed costs—labor and real estate often comprising ~60–65% of operating expenses—reduce flexibility. Seasonality and regional concentration in Canada amplify downside risk.
Complexity of portfolio
Managing many brands and formats strains integration and focus, as seen with large multi-brand operators (Yum! Brands runs three major chains), raising risk of internal competition and diluted marketing where spend must be split across campaigns. Cannibalization can erode same-store sales while layered governance and franchise coordination slow decisions, often adding weeks to rollouts. Uneven brand performance can mask underperformers within a diverse portfolio, complicating resource allocation and accountability.

Labor intensity
Rising wages and staffing shortages squeeze margins: restaurant labor costs rose sharply post‑pandemic, with average industry turnover at about 66% in 2023 (National Restaurant Association) and full‑service labor intensity driving higher training/onboarding spend. High turnover disrupts operations and service consistency during tight markets, and full‑service margins of roughly 3–6% (2024) lag QSR peers at ~10–15%, compressing profitability.

Commodity and rent pressures
Food-input volatility—proteins, produce and oils—can swing COGS by roughly 3–7 percentage points, eroding margins; recent market moves (2023–24) showed elevated protein and oil price volatility. Lease escalations in prime retail rose about 6–10% in 2024, pushing occupancy costs higher. Recipe has limited pricing power in value-sensitive segments and faces a multi-month lag between cost inflation and menu price adjustments.
- COGS volatility: proteins/produce/oils ≈ 3–7 ppt
- Lease escalation: prime locations ≈ 6–10% (2024)
- Limited pricing power in value segments
- Pricing lag: several months, compresses margins
Digital fragmentation
- Disparate stacks, legacy systems
- Loyalty/data unification friction
- Omnichannel UX gaps
- Aggregator fees 20–30%
- High capex/opex, breach cost ~$4.45M
Canada dine-in ops squeezed by high fixed costs, 20–30% delivery fees and 3–6% margins
Heavy exposure to discretionary dine‑in (Canada food services ~CAD110B in 2023) and regional seasonality amplifies cyclicality; high fixed costs (labor + real estate ≈60–65% of OPEX) limit flexibility. Multi‑brand complexity drives cannibalization and slows rollouts; digital fragmentation and 20–30% delivery fees compress margins. Labor turnover (~66% in 2023) and full‑service margins ~3–6% (2024) tighten profits.
| Metric | Value/Year |
|---|---|
| Canada food services | ≈CAD110B (2023) |
| Labor + real estate OPEX | ≈60–65% |
| Turnover | ≈66% (2023) |
| Full‑service margin | ≈3–6% (2024) |
| Aggregator fees | 20–30% |
| COGS volatility | 3–7 ppt |
| Lease escalation | 6–10% (2024) |
| Avg breach cost | USD4.45M (2024) |
Preview Before You Purchase
Recipe SWOT Analysis
This is the actual Recipe SWOT Analysis document you’ll receive upon purchase—no surprises, just professional quality. The preview below is taken directly from the full SWOT report you'll get; purchase unlocks the entire editable, detailed version. You're viewing a live preview of the real file—buy to download the complete analysis immediately.

Go Beyond the Preview—Access the Full Strategic Report
Uncover the strategic ingredients behind Recipe’s market edge with our concise SWOT preview—then get the full SWOT analysis for granular insights, financial context, and tactical recommendations. The complete report includes editable Word and Excel deliverables to support planning, pitching, or investment decisions. Purchase now to move from insight to action.
Strengths
Market-leading scale
Recipe Unlimited is Canada’s largest full-service restaurant operator, running 20+ brands and roughly 1,200 locations nationwide, which delivers purchasing leverage, strong brand visibility and coast-to-coast reach. Scale improves unit economics and marketing efficiency while providing broader customer and sales data for insights. Network effects strengthen supply, logistics and training capabilities. Diversified revenue across company-owned and franchised units enhances resilience.
Multi-brand portfolio
Operating across casual, QSR and fine-dining lets Recipe capture occasions from everyday visits to premium nights out; diversified portfolios (leading multi-brand operators run roughly 40,000–60,000 units globally) hedge demand shifts and stabilize revenue. Cross-selling and shared best practices speed menu-innovation transfer and cut R&D per concept, while 3–5 year pruning/refresh cycles keep concepts relevant.
Franchise-driven cash flows
Franchise-driven cash flows cut capital intensity by shifting store capex to franchisees while generating stable royalties—typical royalty rates run about 4–8% of system sales; McDonald’s, with ~93% franchised restaurants in 2024, illustrates this model. The capital-light mix often delivers materially higher ROIC versus company-owned rollouts and faster scalability, reinforced by franchisee support, training and performance-management systems and lower volatility from a geographically diversified franchisee base.
Operational infrastructure
Centralized procurement, culinary R&D, and training yield standardized processes and KPIs that cut COGS 8–12% and speed rollouts ~30% (2024 industry benchmarks); integrated tech platforms and supply-chain partnerships shorten lead times ~20% and improve distribution efficiency.
- Centralized buying: 8–12% COGS reduction
- Faster rollouts: ~30% quicker via SOPs/KPIs
- Supply chain: ~20% shorter lead times
- Analytics: 5–8% labor cost savings, +12% menu contribution
Brand equity and loyalty
Entrenched Canadian household recognition across flagship brands such as Swiss Chalet, Harvey's and Milestones drives repeat visits through established loyalty programs and robust digital channels (online ordering, apps, CRM). Strong off-premise awareness is reinforced by delivery and takeout formats, while consistent food safety and quality standards sustain guest trust and low variability in experience.
- Flagship national brands
- Digital ordering + loyalty
- High off-premise visibility
- Trusted food safety & consistency
Scale QSR platform: 20+ brands, 8-12% COGS cut
Recipe Unlimited operates 20+ brands and ~1,200 locations, delivering national scale, purchasing leverage and strong household recognition. Centralized procurement, R&D and training cut COGS 8–12%, speed rollouts ~30% and shorten lead times ~20%. A franchise-heavy model generates stable royalties (typical 4–8% of system sales) and capital-light growth, while analytics drive 5–8% labor savings and +12% menu contribution.
| Metric | Value |
|---|---|
| Brands | 20+ |
| Locations | ~1,200 |
| COGS reduction | 8–12% |
| Faster rollouts | ~30% |
| Lead time reduction | ~20% |
| Royalty rate | 4–8% |
| Analytics impact | 5–8% labor savings; +12% menu contribution |
What is included in the product
Detailed Word Document
Provides a concise SWOT assessment of Recipe’s internal capabilities and external market forces, identifying core strengths, weaknesses, growth opportunities, and potential threats to guide strategic decision-making.
Customizable Excel Spreadsheet
Delivers a recipe-focused SWOT matrix that pinpoints ingredient, cost, and process pain points for rapid remediation and menu optimization.
Weaknesses
Exposure to dine-in cycles
Dependence on discretionary dine-in spend makes Recipe vulnerable to macro slowdowns; Statistics Canada reports food services sales reached about CAD 110 billion in 2023, underscoring cyclical demand. Full-service formats face shifts to at-home consumption and delivery, pressuring same-store traffic. Higher fixed costs—labor and real estate often comprising ~60–65% of operating expenses—reduce flexibility. Seasonality and regional concentration in Canada amplify downside risk.
Complexity of portfolio
Managing many brands and formats strains integration and focus, as seen with large multi-brand operators (Yum! Brands runs three major chains), raising risk of internal competition and diluted marketing where spend must be split across campaigns. Cannibalization can erode same-store sales while layered governance and franchise coordination slow decisions, often adding weeks to rollouts. Uneven brand performance can mask underperformers within a diverse portfolio, complicating resource allocation and accountability.
Labor intensity
Rising wages and staffing shortages squeeze margins: restaurant labor costs rose sharply post‑pandemic, with average industry turnover at about 66% in 2023 (National Restaurant Association) and full‑service labor intensity driving higher training/onboarding spend. High turnover disrupts operations and service consistency during tight markets, and full‑service margins of roughly 3–6% (2024) lag QSR peers at ~10–15%, compressing profitability.
Commodity and rent pressures
Food-input volatility—proteins, produce and oils—can swing COGS by roughly 3–7 percentage points, eroding margins; recent market moves (2023–24) showed elevated protein and oil price volatility. Lease escalations in prime retail rose about 6–10% in 2024, pushing occupancy costs higher. Recipe has limited pricing power in value-sensitive segments and faces a multi-month lag between cost inflation and menu price adjustments.
- COGS volatility: proteins/produce/oils ≈ 3–7 ppt
- Lease escalation: prime locations ≈ 6–10% (2024)
- Limited pricing power in value segments
- Pricing lag: several months, compresses margins
Digital fragmentation
- Disparate stacks, legacy systems
- Loyalty/data unification friction
- Omnichannel UX gaps
- Aggregator fees 20–30%
- High capex/opex, breach cost ~$4.45M
Canada dine-in ops squeezed by high fixed costs, 20–30% delivery fees and 3–6% margins
Heavy exposure to discretionary dine‑in (Canada food services ~CAD110B in 2023) and regional seasonality amplifies cyclicality; high fixed costs (labor + real estate ≈60–65% of OPEX) limit flexibility. Multi‑brand complexity drives cannibalization and slows rollouts; digital fragmentation and 20–30% delivery fees compress margins. Labor turnover (~66% in 2023) and full‑service margins ~3–6% (2024) tighten profits.
| Metric | Value/Year |
|---|---|
| Canada food services | ≈CAD110B (2023) |
| Labor + real estate OPEX | ≈60–65% |
| Turnover | ≈66% (2023) |
| Full‑service margin | ≈3–6% (2024) |
| Aggregator fees | 20–30% |
| COGS volatility | 3–7 ppt |
| Lease escalation | 6–10% (2024) |
| Avg breach cost | USD4.45M (2024) |
Preview Before You Purchase
Recipe SWOT Analysis
This is the actual Recipe SWOT Analysis document you’ll receive upon purchase—no surprises, just professional quality. The preview below is taken directly from the full SWOT report you'll get; purchase unlocks the entire editable, detailed version. You're viewing a live preview of the real file—buy to download the complete analysis immediately.
Description
Go Beyond the Preview—Access the Full Strategic Report
Uncover the strategic ingredients behind Recipe’s market edge with our concise SWOT preview—then get the full SWOT analysis for granular insights, financial context, and tactical recommendations. The complete report includes editable Word and Excel deliverables to support planning, pitching, or investment decisions. Purchase now to move from insight to action.
Strengths
Market-leading scale
Recipe Unlimited is Canada’s largest full-service restaurant operator, running 20+ brands and roughly 1,200 locations nationwide, which delivers purchasing leverage, strong brand visibility and coast-to-coast reach. Scale improves unit economics and marketing efficiency while providing broader customer and sales data for insights. Network effects strengthen supply, logistics and training capabilities. Diversified revenue across company-owned and franchised units enhances resilience.
Multi-brand portfolio
Operating across casual, QSR and fine-dining lets Recipe capture occasions from everyday visits to premium nights out; diversified portfolios (leading multi-brand operators run roughly 40,000–60,000 units globally) hedge demand shifts and stabilize revenue. Cross-selling and shared best practices speed menu-innovation transfer and cut R&D per concept, while 3–5 year pruning/refresh cycles keep concepts relevant.
Franchise-driven cash flows
Franchise-driven cash flows cut capital intensity by shifting store capex to franchisees while generating stable royalties—typical royalty rates run about 4–8% of system sales; McDonald’s, with ~93% franchised restaurants in 2024, illustrates this model. The capital-light mix often delivers materially higher ROIC versus company-owned rollouts and faster scalability, reinforced by franchisee support, training and performance-management systems and lower volatility from a geographically diversified franchisee base.
Operational infrastructure
Centralized procurement, culinary R&D, and training yield standardized processes and KPIs that cut COGS 8–12% and speed rollouts ~30% (2024 industry benchmarks); integrated tech platforms and supply-chain partnerships shorten lead times ~20% and improve distribution efficiency.
- Centralized buying: 8–12% COGS reduction
- Faster rollouts: ~30% quicker via SOPs/KPIs
- Supply chain: ~20% shorter lead times
- Analytics: 5–8% labor cost savings, +12% menu contribution
Brand equity and loyalty
Entrenched Canadian household recognition across flagship brands such as Swiss Chalet, Harvey's and Milestones drives repeat visits through established loyalty programs and robust digital channels (online ordering, apps, CRM). Strong off-premise awareness is reinforced by delivery and takeout formats, while consistent food safety and quality standards sustain guest trust and low variability in experience.
- Flagship national brands
- Digital ordering + loyalty
- High off-premise visibility
- Trusted food safety & consistency
Scale QSR platform: 20+ brands, 8-12% COGS cut
Recipe Unlimited operates 20+ brands and ~1,200 locations, delivering national scale, purchasing leverage and strong household recognition. Centralized procurement, R&D and training cut COGS 8–12%, speed rollouts ~30% and shorten lead times ~20%. A franchise-heavy model generates stable royalties (typical 4–8% of system sales) and capital-light growth, while analytics drive 5–8% labor savings and +12% menu contribution.
| Metric | Value |
|---|---|
| Brands | 20+ |
| Locations | ~1,200 |
| COGS reduction | 8–12% |
| Faster rollouts | ~30% |
| Lead time reduction | ~20% |
| Royalty rate | 4–8% |
| Analytics impact | 5–8% labor savings; +12% menu contribution |
What is included in the product
Detailed Word Document
Provides a concise SWOT assessment of Recipe’s internal capabilities and external market forces, identifying core strengths, weaknesses, growth opportunities, and potential threats to guide strategic decision-making.
Customizable Excel Spreadsheet
Delivers a recipe-focused SWOT matrix that pinpoints ingredient, cost, and process pain points for rapid remediation and menu optimization.
Weaknesses
Exposure to dine-in cycles
Dependence on discretionary dine-in spend makes Recipe vulnerable to macro slowdowns; Statistics Canada reports food services sales reached about CAD 110 billion in 2023, underscoring cyclical demand. Full-service formats face shifts to at-home consumption and delivery, pressuring same-store traffic. Higher fixed costs—labor and real estate often comprising ~60–65% of operating expenses—reduce flexibility. Seasonality and regional concentration in Canada amplify downside risk.
Complexity of portfolio
Managing many brands and formats strains integration and focus, as seen with large multi-brand operators (Yum! Brands runs three major chains), raising risk of internal competition and diluted marketing where spend must be split across campaigns. Cannibalization can erode same-store sales while layered governance and franchise coordination slow decisions, often adding weeks to rollouts. Uneven brand performance can mask underperformers within a diverse portfolio, complicating resource allocation and accountability.
Labor intensity
Rising wages and staffing shortages squeeze margins: restaurant labor costs rose sharply post‑pandemic, with average industry turnover at about 66% in 2023 (National Restaurant Association) and full‑service labor intensity driving higher training/onboarding spend. High turnover disrupts operations and service consistency during tight markets, and full‑service margins of roughly 3–6% (2024) lag QSR peers at ~10–15%, compressing profitability.
Commodity and rent pressures
Food-input volatility—proteins, produce and oils—can swing COGS by roughly 3–7 percentage points, eroding margins; recent market moves (2023–24) showed elevated protein and oil price volatility. Lease escalations in prime retail rose about 6–10% in 2024, pushing occupancy costs higher. Recipe has limited pricing power in value-sensitive segments and faces a multi-month lag between cost inflation and menu price adjustments.
- COGS volatility: proteins/produce/oils ≈ 3–7 ppt
- Lease escalation: prime locations ≈ 6–10% (2024)
- Limited pricing power in value segments
- Pricing lag: several months, compresses margins
Digital fragmentation
- Disparate stacks, legacy systems
- Loyalty/data unification friction
- Omnichannel UX gaps
- Aggregator fees 20–30%
- High capex/opex, breach cost ~$4.45M
Canada dine-in ops squeezed by high fixed costs, 20–30% delivery fees and 3–6% margins
Heavy exposure to discretionary dine‑in (Canada food services ~CAD110B in 2023) and regional seasonality amplifies cyclicality; high fixed costs (labor + real estate ≈60–65% of OPEX) limit flexibility. Multi‑brand complexity drives cannibalization and slows rollouts; digital fragmentation and 20–30% delivery fees compress margins. Labor turnover (~66% in 2023) and full‑service margins ~3–6% (2024) tighten profits.
| Metric | Value/Year |
|---|---|
| Canada food services | ≈CAD110B (2023) |
| Labor + real estate OPEX | ≈60–65% |
| Turnover | ≈66% (2023) |
| Full‑service margin | ≈3–6% (2024) |
| Aggregator fees | 20–30% |
| COGS volatility | 3–7 ppt |
| Lease escalation | 6–10% (2024) |
| Avg breach cost | USD4.45M (2024) |
Preview Before You Purchase
Recipe SWOT Analysis
This is the actual Recipe SWOT Analysis document you’ll receive upon purchase—no surprises, just professional quality. The preview below is taken directly from the full SWOT report you'll get; purchase unlocks the entire editable, detailed version. You're viewing a live preview of the real file—buy to download the complete analysis immediately.











