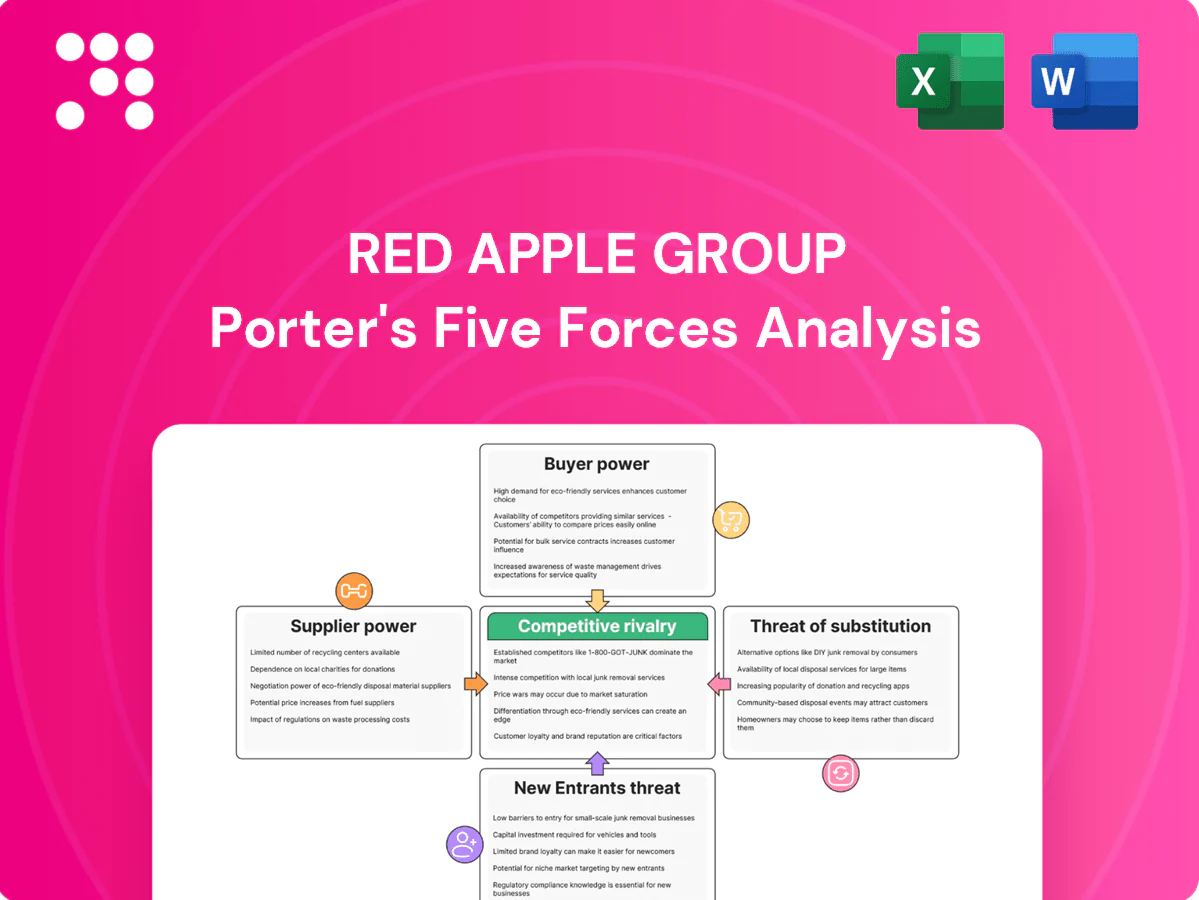
Red Apple Group Porter's Five Forces Analysis

Don't Miss the Bigger Picture
Red Apple Group faces concentrated buyer power, moderate supplier sway, and rising competitive intensity from national grocers and private-label rivals; regulatory and real-estate cycles shape entry barriers while e-commerce and substitutes add pressure. This snapshot highlights key tensions and strategic levers. Unlock the full Porter's Five Forces Analysis to explore force-by-force ratings, visuals, and actionable recommendations.
Suppliers Bargaining Power

Multi-sector input concentration
Red Apple sources food, fuel, construction and media, creating multi-sector supplier dependencies; Walmart alone accounted for about 24% of US grocery sales in 2024, giving large CPG and retail buyers significant slotting leverage. Major oil firms (Exxon, Shell, Chevron) had a combined market capitalization near $1.8 trillion in 2024, strengthening fuel wholesalers’ negotiating power. Construction contractors and materials vendors tighten terms in constrained markets, and diversification reduces but does not remove concentrated supplier nodes.
Energy feedstock volatility
Energy feedstock volatility drives supplier power: Brent crude averaged about $86/barrel in 2024 as OPEC+ and geopolitics swung markets, constraining refiners' margins. Refiners and marketers face limited cost-pass-through during demand shocks, compressing margins and forcing inventory drawdowns. Pipeline and terminal chokepoints create regional bottlenecks that boost supplier leverage, and hedging reduces but cannot eliminate basis risk.

Grocery brand leverage vs. private label
Top national brands occupy roughly 60% of shelf space in core categories and capture about 70% of promotional fund spend, increasing Red Apple Group’s dependence; private label penetration reached about 20% in 2024, enabling mix shifts and stronger negotiation leverage; co-packer capacity utilization near 85% can sustain supplier power despite retailer moves; centralized scale purchasing and category management reduce net exposure by concentrating ~60% of spend.

Real estate contractors and materials
Real estate contractors and materials exert moderate-to-high supplier power for Red Apple Group: 2024 market conditions show elevated material-price volatility and labor shortages that strengthen contractors' negotiating leverage, while long-lead items like HVAC and structural steel routinely cause schedule slips and cost uplifts.
- Long-lead risk: HVAC/steel delay projects
- Price volatility: 2024 steel/HVAC markets volatile
- Mitigation: preferred vendors, framework contracts cap swings
- Local supply base drives schedule certainty
Media content and tech platforms
Radio’s dependence on collective rights organizations (ASCAP/BMI) and tech vendors for automation and streaming concentrates supplier power: blanket licenses and statutory fee frameworks limit negotiation, while ad-tech gatekeepers (Google, Meta and major SSPs) control inventory and audience data, forcing revenue-share concessions and higher switching costs.
Supply squeeze: top retailer ~24% share, oil $86/bbl
Suppliers exert moderate-to-high power: Walmart held ~24% of US grocery sales in 2024 and top brands took ~60% shelf/70% promo spend, while private label reached ~20%, and co-packer utilization was ~85%. Brent crude averaged ~$86/barrel in 2024 and oil majors had ~ $1.8T combined market cap, tightening fuel supply terms. Construction materials and labor shortages raised contractor leverage and long-lead HVAC/steel risks.
| Metric | 2024 Value |
|---|---|
| Walmart share | ~24% |
| Top brands shelf/promo | ~60% / ~70% |
| Private label | ~20% |
| Co-packer utilization | ~85% |
| Brent avg | $86/bbl |
| Oil majors mkt cap | $1.8T |
What is included in the product
 Detailed Word Document
Tailored Porter's Five Forces analysis for Red Apple Group uncovering competitive rivalry, supplier and buyer power, threat of new entrants and substitutes, and identifying disruptive forces and market entry risks to inform strategic positioning and investor materials.

 Customizable Excel Spreadsheet
A one-sheet summary of Red Apple Group's Five Forces with customizable pressure levels and an instant spider chart—clean, no-macro layout ready for decks, swap in your data and duplicate tabs for scenario analysis.
Customers Bargaining Power

Price-sensitive grocery shoppers
Price-sensitive shoppers increasingly compare chains and discounters, intensifying price pressure on Red Apple. Loyalty programs and private labels, which reached about 18% share in US grocery sales in 2024, reduce churn but do not eliminate switchers. 2024 food-at-home inflation near 2.5% amplifies trade-down behavior. Basket-level promotions have become table stakes for retention and volume.
Fuel customers with real-time price visibility
Drivers see pump prices instantly via apps and signage, raising price elasticity and enabling shoppers to chase the best cents-per-gallon offer; site-level volumes can swing within hours on small deltas. Convenience store promotions and merchandising (US c-store channel sales ~$814 billion in 2023) partially anchor traffic and soften churn. Rising EV penetration (roughly 14% of new car sales in 2023) increases long-run demand risk for fuel.

Real estate tenants negotiating terms
Commercial tenants increasingly press Red Apple Group for higher TI—often $40–$150 per sq ft in NYC markets in 2024—softer rent escalators (commonly capped at 2–3% annually) and lease flexibility; vacancy swings (Manhattan office ~19% in 2024) shift leverage to tenants during downturns. Anchor retail tenants command outsized concessions and co-tenancy protections, and stronger tenant credit profiles secure larger allowances, shorter free-rent ramps, and more favorable escalation caps.

Advertisers and agencies in media
Agencies aggregate buy power—handling roughly two-thirds of major campaign budgets—so they demand favorable CPMs and makegoods; local advertisers multi-home across TV, streaming and social, raising leverage. Measurability expectations push publishers to bundle digital add-ons as digital ad spend topped ~60% of global spend in 2024, while rating swings can flip negotiating power quickly.
- Agency aggregation: high leverage
- Local multi-homing: increased bargaining
- Digital bundling: driven by measurability
- Ratings volatility: rapid power shifts
Large procurement counterparts
Institutional buyers and grocery co-ops boost customer leverage over Red Apple, with the top 4 US grocery chains capturing roughly 58% of grocery sales in 2024, intensifying price pressure. Large fleet fuel accounts typically secure 5–12% volume discounts, while national retail subtenants demand standardized leases and TI allowances. Buyer-side consolidation has compressed retail margins by up to 100–150 basis points in 2023–24.
- Top4Share: ~58% (2024)
- FleetDiscounts: 5–12%
- LeaseStd: national tenants insist on standardized leases
- MarginCompression: 100–150 bps (2023–24)
Top4 ~58%, PL ~18%, fleet 5–12% compress
Customers exert high leverage: top-4 grocers ~58% share in 2024 and private labels ~18% limit Red Apple’s pricing power. Food-at-home inflation ~2.5% in 2024 and price-sensitive shoppers push promotions and basket deals. Fleet accounts (5–12% discounts) and agency aggregation amplify negotiated concessions and compress margins ~100–150 bps (2023–24).
| Metric | Value |
|---|---|
| Top4 grocery share (2024) | ~58% |
| Private label (2024) | ~18% |
| Food-at-home inflation (2024) | ~2.5% |
| Fleet discounts | 5–12% |
| Margin compression (2023–24) | 100–150 bps |
Preview the Actual Deliverable
Red Apple Group Porter's Five Forces Analysis
This preview shows the exact Red Apple Group Porter's Five Forces Analysis you'll receive immediately after purchase—no placeholders or mockups. The full document is fully formatted, professionally written and ready to download and use the moment you buy. What you see here is precisely what you'll get.

Don't Miss the Bigger Picture
Red Apple Group faces concentrated buyer power, moderate supplier sway, and rising competitive intensity from national grocers and private-label rivals; regulatory and real-estate cycles shape entry barriers while e-commerce and substitutes add pressure. This snapshot highlights key tensions and strategic levers. Unlock the full Porter's Five Forces Analysis to explore force-by-force ratings, visuals, and actionable recommendations.
Suppliers Bargaining Power
Multi-sector input concentration
Red Apple sources food, fuel, construction and media, creating multi-sector supplier dependencies; Walmart alone accounted for about 24% of US grocery sales in 2024, giving large CPG and retail buyers significant slotting leverage. Major oil firms (Exxon, Shell, Chevron) had a combined market capitalization near $1.8 trillion in 2024, strengthening fuel wholesalers’ negotiating power. Construction contractors and materials vendors tighten terms in constrained markets, and diversification reduces but does not remove concentrated supplier nodes.
Energy feedstock volatility
Energy feedstock volatility drives supplier power: Brent crude averaged about $86/barrel in 2024 as OPEC+ and geopolitics swung markets, constraining refiners' margins. Refiners and marketers face limited cost-pass-through during demand shocks, compressing margins and forcing inventory drawdowns. Pipeline and terminal chokepoints create regional bottlenecks that boost supplier leverage, and hedging reduces but cannot eliminate basis risk.
Grocery brand leverage vs. private label
Top national brands occupy roughly 60% of shelf space in core categories and capture about 70% of promotional fund spend, increasing Red Apple Group’s dependence; private label penetration reached about 20% in 2024, enabling mix shifts and stronger negotiation leverage; co-packer capacity utilization near 85% can sustain supplier power despite retailer moves; centralized scale purchasing and category management reduce net exposure by concentrating ~60% of spend.
Real estate contractors and materials
Real estate contractors and materials exert moderate-to-high supplier power for Red Apple Group: 2024 market conditions show elevated material-price volatility and labor shortages that strengthen contractors' negotiating leverage, while long-lead items like HVAC and structural steel routinely cause schedule slips and cost uplifts.
- Long-lead risk: HVAC/steel delay projects
- Price volatility: 2024 steel/HVAC markets volatile
- Mitigation: preferred vendors, framework contracts cap swings
- Local supply base drives schedule certainty
Media content and tech platforms
Radio’s dependence on collective rights organizations (ASCAP/BMI) and tech vendors for automation and streaming concentrates supplier power: blanket licenses and statutory fee frameworks limit negotiation, while ad-tech gatekeepers (Google, Meta and major SSPs) control inventory and audience data, forcing revenue-share concessions and higher switching costs.
Supply squeeze: top retailer ~24% share, oil $86/bbl
Suppliers exert moderate-to-high power: Walmart held ~24% of US grocery sales in 2024 and top brands took ~60% shelf/70% promo spend, while private label reached ~20%, and co-packer utilization was ~85%. Brent crude averaged ~$86/barrel in 2024 and oil majors had ~ $1.8T combined market cap, tightening fuel supply terms. Construction materials and labor shortages raised contractor leverage and long-lead HVAC/steel risks.
| Metric | 2024 Value |
|---|---|
| Walmart share | ~24% |
| Top brands shelf/promo | ~60% / ~70% |
| Private label | ~20% |
| Co-packer utilization | ~85% |
| Brent avg | $86/bbl |
| Oil majors mkt cap | $1.8T |
What is included in the product
Detailed Word Document
Tailored Porter's Five Forces analysis for Red Apple Group uncovering competitive rivalry, supplier and buyer power, threat of new entrants and substitutes, and identifying disruptive forces and market entry risks to inform strategic positioning and investor materials.
Customizable Excel Spreadsheet
A one-sheet summary of Red Apple Group's Five Forces with customizable pressure levels and an instant spider chart—clean, no-macro layout ready for decks, swap in your data and duplicate tabs for scenario analysis.
Customers Bargaining Power
Price-sensitive grocery shoppers
Price-sensitive shoppers increasingly compare chains and discounters, intensifying price pressure on Red Apple. Loyalty programs and private labels, which reached about 18% share in US grocery sales in 2024, reduce churn but do not eliminate switchers. 2024 food-at-home inflation near 2.5% amplifies trade-down behavior. Basket-level promotions have become table stakes for retention and volume.
Fuel customers with real-time price visibility
Drivers see pump prices instantly via apps and signage, raising price elasticity and enabling shoppers to chase the best cents-per-gallon offer; site-level volumes can swing within hours on small deltas. Convenience store promotions and merchandising (US c-store channel sales ~$814 billion in 2023) partially anchor traffic and soften churn. Rising EV penetration (roughly 14% of new car sales in 2023) increases long-run demand risk for fuel.
Real estate tenants negotiating terms
Commercial tenants increasingly press Red Apple Group for higher TI—often $40–$150 per sq ft in NYC markets in 2024—softer rent escalators (commonly capped at 2–3% annually) and lease flexibility; vacancy swings (Manhattan office ~19% in 2024) shift leverage to tenants during downturns. Anchor retail tenants command outsized concessions and co-tenancy protections, and stronger tenant credit profiles secure larger allowances, shorter free-rent ramps, and more favorable escalation caps.
Advertisers and agencies in media
Agencies aggregate buy power—handling roughly two-thirds of major campaign budgets—so they demand favorable CPMs and makegoods; local advertisers multi-home across TV, streaming and social, raising leverage. Measurability expectations push publishers to bundle digital add-ons as digital ad spend topped ~60% of global spend in 2024, while rating swings can flip negotiating power quickly.
- Agency aggregation: high leverage
- Local multi-homing: increased bargaining
- Digital bundling: driven by measurability
- Ratings volatility: rapid power shifts
Large procurement counterparts
Institutional buyers and grocery co-ops boost customer leverage over Red Apple, with the top 4 US grocery chains capturing roughly 58% of grocery sales in 2024, intensifying price pressure. Large fleet fuel accounts typically secure 5–12% volume discounts, while national retail subtenants demand standardized leases and TI allowances. Buyer-side consolidation has compressed retail margins by up to 100–150 basis points in 2023–24.
- Top4Share: ~58% (2024)
- FleetDiscounts: 5–12%
- LeaseStd: national tenants insist on standardized leases
- MarginCompression: 100–150 bps (2023–24)
Top4 ~58%, PL ~18%, fleet 5–12% compress
Customers exert high leverage: top-4 grocers ~58% share in 2024 and private labels ~18% limit Red Apple’s pricing power. Food-at-home inflation ~2.5% in 2024 and price-sensitive shoppers push promotions and basket deals. Fleet accounts (5–12% discounts) and agency aggregation amplify negotiated concessions and compress margins ~100–150 bps (2023–24).
| Metric | Value |
|---|---|
| Top4 grocery share (2024) | ~58% |
| Private label (2024) | ~18% |
| Food-at-home inflation (2024) | ~2.5% |
| Fleet discounts | 5–12% |
| Margin compression (2023–24) | 100–150 bps |
Preview the Actual Deliverable
Red Apple Group Porter's Five Forces Analysis
This preview shows the exact Red Apple Group Porter's Five Forces Analysis you'll receive immediately after purchase—no placeholders or mockups. The full document is fully formatted, professionally written and ready to download and use the moment you buy. What you see here is precisely what you'll get.
Original: $10.00
-65%$10.00
$3.50Description
Don't Miss the Bigger Picture
Red Apple Group faces concentrated buyer power, moderate supplier sway, and rising competitive intensity from national grocers and private-label rivals; regulatory and real-estate cycles shape entry barriers while e-commerce and substitutes add pressure. This snapshot highlights key tensions and strategic levers. Unlock the full Porter's Five Forces Analysis to explore force-by-force ratings, visuals, and actionable recommendations.
Suppliers Bargaining Power
Multi-sector input concentration
Red Apple sources food, fuel, construction and media, creating multi-sector supplier dependencies; Walmart alone accounted for about 24% of US grocery sales in 2024, giving large CPG and retail buyers significant slotting leverage. Major oil firms (Exxon, Shell, Chevron) had a combined market capitalization near $1.8 trillion in 2024, strengthening fuel wholesalers’ negotiating power. Construction contractors and materials vendors tighten terms in constrained markets, and diversification reduces but does not remove concentrated supplier nodes.
Energy feedstock volatility
Energy feedstock volatility drives supplier power: Brent crude averaged about $86/barrel in 2024 as OPEC+ and geopolitics swung markets, constraining refiners' margins. Refiners and marketers face limited cost-pass-through during demand shocks, compressing margins and forcing inventory drawdowns. Pipeline and terminal chokepoints create regional bottlenecks that boost supplier leverage, and hedging reduces but cannot eliminate basis risk.
Grocery brand leverage vs. private label
Top national brands occupy roughly 60% of shelf space in core categories and capture about 70% of promotional fund spend, increasing Red Apple Group’s dependence; private label penetration reached about 20% in 2024, enabling mix shifts and stronger negotiation leverage; co-packer capacity utilization near 85% can sustain supplier power despite retailer moves; centralized scale purchasing and category management reduce net exposure by concentrating ~60% of spend.
Real estate contractors and materials
Real estate contractors and materials exert moderate-to-high supplier power for Red Apple Group: 2024 market conditions show elevated material-price volatility and labor shortages that strengthen contractors' negotiating leverage, while long-lead items like HVAC and structural steel routinely cause schedule slips and cost uplifts.
- Long-lead risk: HVAC/steel delay projects
- Price volatility: 2024 steel/HVAC markets volatile
- Mitigation: preferred vendors, framework contracts cap swings
- Local supply base drives schedule certainty
Media content and tech platforms
Radio’s dependence on collective rights organizations (ASCAP/BMI) and tech vendors for automation and streaming concentrates supplier power: blanket licenses and statutory fee frameworks limit negotiation, while ad-tech gatekeepers (Google, Meta and major SSPs) control inventory and audience data, forcing revenue-share concessions and higher switching costs.
Supply squeeze: top retailer ~24% share, oil $86/bbl
Suppliers exert moderate-to-high power: Walmart held ~24% of US grocery sales in 2024 and top brands took ~60% shelf/70% promo spend, while private label reached ~20%, and co-packer utilization was ~85%. Brent crude averaged ~$86/barrel in 2024 and oil majors had ~ $1.8T combined market cap, tightening fuel supply terms. Construction materials and labor shortages raised contractor leverage and long-lead HVAC/steel risks.
| Metric | 2024 Value |
|---|---|
| Walmart share | ~24% |
| Top brands shelf/promo | ~60% / ~70% |
| Private label | ~20% |
| Co-packer utilization | ~85% |
| Brent avg | $86/bbl |
| Oil majors mkt cap | $1.8T |
What is included in the product
Detailed Word Document
Tailored Porter's Five Forces analysis for Red Apple Group uncovering competitive rivalry, supplier and buyer power, threat of new entrants and substitutes, and identifying disruptive forces and market entry risks to inform strategic positioning and investor materials.
Customizable Excel Spreadsheet
A one-sheet summary of Red Apple Group's Five Forces with customizable pressure levels and an instant spider chart—clean, no-macro layout ready for decks, swap in your data and duplicate tabs for scenario analysis.
Customers Bargaining Power
Price-sensitive grocery shoppers
Price-sensitive shoppers increasingly compare chains and discounters, intensifying price pressure on Red Apple. Loyalty programs and private labels, which reached about 18% share in US grocery sales in 2024, reduce churn but do not eliminate switchers. 2024 food-at-home inflation near 2.5% amplifies trade-down behavior. Basket-level promotions have become table stakes for retention and volume.
Fuel customers with real-time price visibility
Drivers see pump prices instantly via apps and signage, raising price elasticity and enabling shoppers to chase the best cents-per-gallon offer; site-level volumes can swing within hours on small deltas. Convenience store promotions and merchandising (US c-store channel sales ~$814 billion in 2023) partially anchor traffic and soften churn. Rising EV penetration (roughly 14% of new car sales in 2023) increases long-run demand risk for fuel.
Real estate tenants negotiating terms
Commercial tenants increasingly press Red Apple Group for higher TI—often $40–$150 per sq ft in NYC markets in 2024—softer rent escalators (commonly capped at 2–3% annually) and lease flexibility; vacancy swings (Manhattan office ~19% in 2024) shift leverage to tenants during downturns. Anchor retail tenants command outsized concessions and co-tenancy protections, and stronger tenant credit profiles secure larger allowances, shorter free-rent ramps, and more favorable escalation caps.
Advertisers and agencies in media
Agencies aggregate buy power—handling roughly two-thirds of major campaign budgets—so they demand favorable CPMs and makegoods; local advertisers multi-home across TV, streaming and social, raising leverage. Measurability expectations push publishers to bundle digital add-ons as digital ad spend topped ~60% of global spend in 2024, while rating swings can flip negotiating power quickly.
- Agency aggregation: high leverage
- Local multi-homing: increased bargaining
- Digital bundling: driven by measurability
- Ratings volatility: rapid power shifts
Large procurement counterparts
Institutional buyers and grocery co-ops boost customer leverage over Red Apple, with the top 4 US grocery chains capturing roughly 58% of grocery sales in 2024, intensifying price pressure. Large fleet fuel accounts typically secure 5–12% volume discounts, while national retail subtenants demand standardized leases and TI allowances. Buyer-side consolidation has compressed retail margins by up to 100–150 basis points in 2023–24.
- Top4Share: ~58% (2024)
- FleetDiscounts: 5–12%
- LeaseStd: national tenants insist on standardized leases
- MarginCompression: 100–150 bps (2023–24)
Top4 ~58%, PL ~18%, fleet 5–12% compress
Customers exert high leverage: top-4 grocers ~58% share in 2024 and private labels ~18% limit Red Apple’s pricing power. Food-at-home inflation ~2.5% in 2024 and price-sensitive shoppers push promotions and basket deals. Fleet accounts (5–12% discounts) and agency aggregation amplify negotiated concessions and compress margins ~100–150 bps (2023–24).
| Metric | Value |
|---|---|
| Top4 grocery share (2024) | ~58% |
| Private label (2024) | ~18% |
| Food-at-home inflation (2024) | ~2.5% |
| Fleet discounts | 5–12% |
| Margin compression (2023–24) | 100–150 bps |
Preview the Actual Deliverable
Red Apple Group Porter's Five Forces Analysis
This preview shows the exact Red Apple Group Porter's Five Forces Analysis you'll receive immediately after purchase—no placeholders or mockups. The full document is fully formatted, professionally written and ready to download and use the moment you buy. What you see here is precisely what you'll get.











