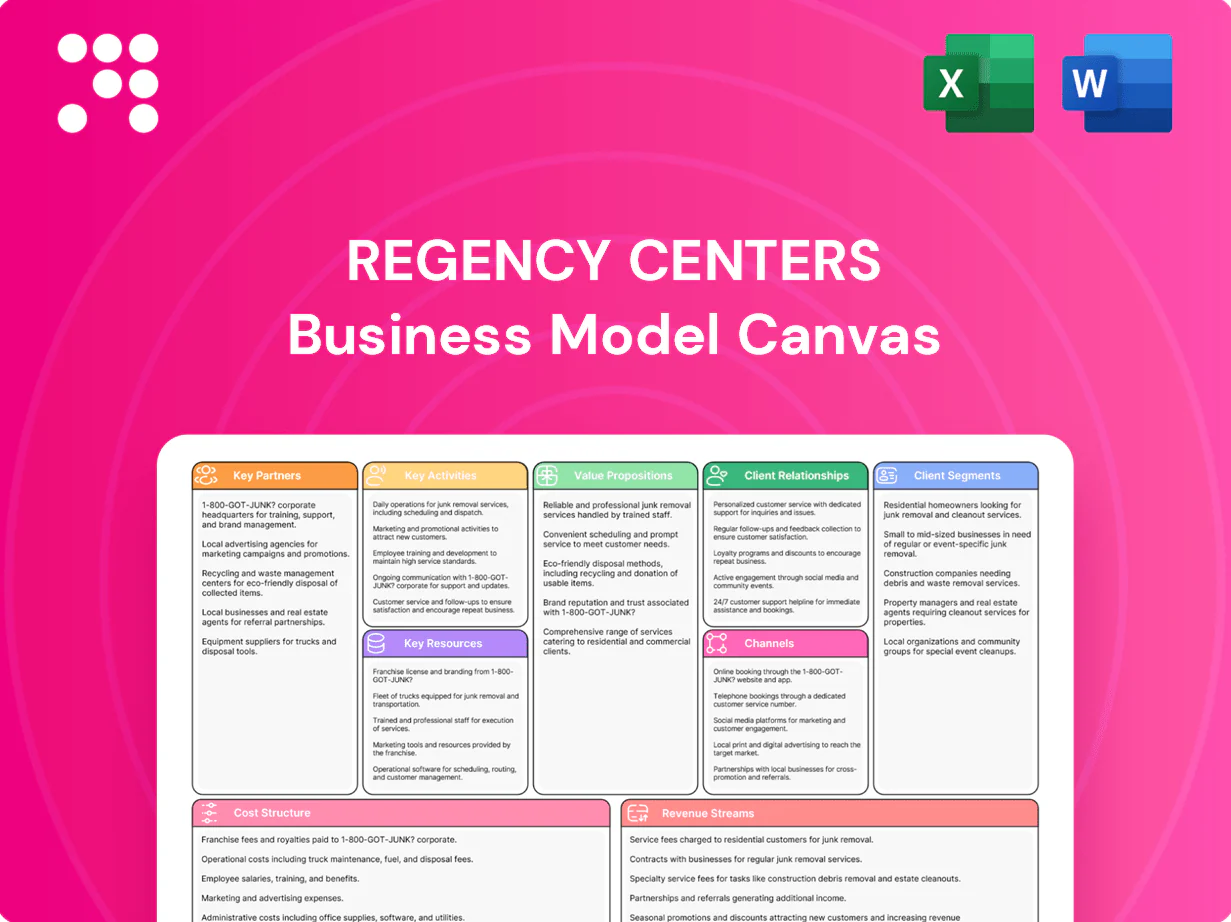
Regency Centers Business Model Canvas

Business Model Canvas: Strategic Blueprint for Retail Property Growth
Unlock the full strategic blueprint behind Regency Centers with our Business Model Canvas—detailing customer segments, value propositions, channels, and revenue models. This concise, actionable analysis reveals how the company scales and sustains competitive advantage. Download the complete Word/Excel canvas to benchmark, plan, or invest confidently.
Partnerships

Grocery anchor tenants
Partnerships with top-tier grocers anchor Regency Centers' portfolio—approximately 90% grocery-anchored across over 400 shopping centers—driving consistent foot traffic and stabilizing cash flows. Long-term leases, often multi-year agreements, align incentives and reduce vacancy risk. Co-marketing and coordinated site improvements boost store performance and sales per sq ft. Strong anchor credit quality supports favorable financing terms and valuation multiples.
National and regional retailers
Regency leverages partnerships with national and regional retailers—essential retail, restaurants, fitness, and services—to diversify income and stabilize cash flow across a ~400-center portfolio (2024). Portfolio-wide leasing packages create scale advantages in rent negotiations and tenant mix optimization. Data-sharing agreements improve store placement and sales productivity, while co-tenancy strategies fine-tune merchandising to boost foot traffic and average unit performance.

Municipalities and planning authorities
Entitlement success for Regency Centers (REG, ~390 grocery-anchored centers in 2024) hinges on strong municipal and planning authority partnerships. Close collaboration speeds approvals for redevelopment and mixed-use conversions, cutting project delays. Coordinating public infrastructure investments improves site access and safety. Community benefits agreements (CBAs) secure local goodwill and reduce opposition.

Developers, contractors, and design firms
Trusted delivery partners enable Regency to keep projects on-time and on-budget, supporting a portfolio that maintained c.95% occupancy in 2024 and protected rental income streams.
Rigorous value engineering preserves ROI without sacrificing quality, while sustainable design partners advance ESG targets and energy-efficiency goals reported across the sector in 2024.
Local contractors reduce permitting timelines and construction costs, delivering regional advantages in cost control and faster tenant stabilization.
- DevelopmentPipeline
- ValueEngineering
- ESGPartnerships
- LocalContractors
Capital providers and brokers
- 2024 10-year Treasury ~4.2%
- Joint ventures used for selective growth
- Brokers expand tenant reach and transaction flow
- Market intel improves pricing and risk assessment
Grocery-anchored (~90%) across ~400 centers; ~95% occupancy
Regency's key partnerships anchor ~90% grocery-anchored portfolio across ~400 centers, driving c.95% occupancy in 2024. Long-term leases and strong anchor credit support stable cash flows and favorable financing; 10-year Treasury averaged ~4.2% in 2024. Joint ventures and brokers expand capital and leasing reach, enabling selective redevelopment and mixed-use conversions.
| Metric | 2024 |
|---|---|
| Grocery-anchored | ~90% |
| Centers | ~400 |
| Occupancy | ~95% |
| 10-yr Treasury | ~4.2% |
| Joint ventures | Selective use |
What is included in the product
 Detailed Word Document
A concise, pre-written Business Model Canvas for Regency Centers, detailing customer segments, value propositions, channels, revenue streams and key resources for a grocery-anchored shopping center REIT, organized into the nine BMC blocks with strategic insights and competitive strengths to support investor presentations and operational planning.

 Customizable Excel Spreadsheet
Condenses Regency Centers' retail-centric strategy into a digestible one-page snapshot that saves hours of formatting and structuring, easing planning and presentation pain points while enabling fast team collaboration and side-by-side model comparison.
Activities

Acquisition and disposition
Regency sources and underwrites grocery-anchored centers in affluent, supply-constrained suburbs, leveraging a portfolio of approximately 412 centers (~49 million sqft) to target stable cash flow. Non-core assets are sold to recycle capital into higher-growth infill and mixed-use opportunities. 1031 and tax-efficient strategies are executed where applicable to defer gains. Discipline on hurdle rates and ongoing portfolio pruning guide acquisitions and dispositions.
Development and redevelopment
Ground-up and value-add projects drive NOI growth and tenant quality, leveraging Regency Centers' portfolio of approximately 400 grocery-anchored shopping centers to attract national grocers and service tenants. Re-tenanting and densification convert underutilized parcels into higher-rent retail and residential footprints, unlocking additional rent per acre. Mixed-use integrations add residential and office demand drivers, while phased execution limits leasing and construction risk.

Leasing and merchandising
Regency curates necessity-based tenant mixes anchored by grocers across approximately 400 grocery-anchored centers in 2024, driving consistent foot traffic. Leasing teams negotiate rent structures, TI packages and co-tenancy clauses tied to sales to align landlord-tenant incentives. Data analytics optimize suite sizes and adjacencies for higher sales per sq ft, while proactive renewals keep vacancy and downtime near industry-leading levels (~95% occupancy in 2024).

Asset and property management
Asset and property management preserves Class A standards and guest experience across Regency Centers, supporting a grocery-anchored portfolio of about 27 million sq ft as of 2024; preventative maintenance and energy-efficiency upgrades reduce operating costs and downtime. Monitoring tenant sales, traffic patterns and credit risk protects rental income while continuous improvements to safety, parking and wayfinding raise retention and NOI.
- Maintain Class A standards
- Preventative maintenance & energy efficiency
- Monitor sales, traffic & credit risk
- Enhance safety, parking & wayfinding
Community and stakeholder engagement
Grocery-anchored centers: 412 assets, 49M sqft, ~95% occupancy driving stable cash flow
Regency underwrites grocery-anchored centers (412 centers, ~49M sqft in 2024) targeting stable cash flow and ~95% occupancy. It recycles capital via selective dispositions and 1031s into infill and mixed-use. Ground-up, value-add, re-tenanting and densification lift NOI. Asset management preserves Class A standards and lowers operating costs.
| Metric | 2024 |
|---|---|
| Centers | 412 |
| GLA | 49M sqft |
| Occupancy | 95% |
Full Version Awaits
Business Model Canvas
The document you're previewing is the actual Regency Centers Business Model Canvas you’ll receive after purchase. It’s not a mockup—this live preview reflects the full, editable deliverable formatted for immediate use. Buy to instantly download the identical Word and Excel files with all content included.

Business Model Canvas: Strategic Blueprint for Retail Property Growth
Unlock the full strategic blueprint behind Regency Centers with our Business Model Canvas—detailing customer segments, value propositions, channels, and revenue models. This concise, actionable analysis reveals how the company scales and sustains competitive advantage. Download the complete Word/Excel canvas to benchmark, plan, or invest confidently.
Partnerships
Grocery anchor tenants
Partnerships with top-tier grocers anchor Regency Centers' portfolio—approximately 90% grocery-anchored across over 400 shopping centers—driving consistent foot traffic and stabilizing cash flows. Long-term leases, often multi-year agreements, align incentives and reduce vacancy risk. Co-marketing and coordinated site improvements boost store performance and sales per sq ft. Strong anchor credit quality supports favorable financing terms and valuation multiples.
National and regional retailers
Regency leverages partnerships with national and regional retailers—essential retail, restaurants, fitness, and services—to diversify income and stabilize cash flow across a ~400-center portfolio (2024). Portfolio-wide leasing packages create scale advantages in rent negotiations and tenant mix optimization. Data-sharing agreements improve store placement and sales productivity, while co-tenancy strategies fine-tune merchandising to boost foot traffic and average unit performance.
Municipalities and planning authorities
Entitlement success for Regency Centers (REG, ~390 grocery-anchored centers in 2024) hinges on strong municipal and planning authority partnerships. Close collaboration speeds approvals for redevelopment and mixed-use conversions, cutting project delays. Coordinating public infrastructure investments improves site access and safety. Community benefits agreements (CBAs) secure local goodwill and reduce opposition.
Developers, contractors, and design firms
Trusted delivery partners enable Regency to keep projects on-time and on-budget, supporting a portfolio that maintained c.95% occupancy in 2024 and protected rental income streams.
Rigorous value engineering preserves ROI without sacrificing quality, while sustainable design partners advance ESG targets and energy-efficiency goals reported across the sector in 2024.
Local contractors reduce permitting timelines and construction costs, delivering regional advantages in cost control and faster tenant stabilization.
- DevelopmentPipeline
- ValueEngineering
- ESGPartnerships
- LocalContractors
Capital providers and brokers
- 2024 10-year Treasury ~4.2%
- Joint ventures used for selective growth
- Brokers expand tenant reach and transaction flow
- Market intel improves pricing and risk assessment
Grocery-anchored (~90%) across ~400 centers; ~95% occupancy
Regency's key partnerships anchor ~90% grocery-anchored portfolio across ~400 centers, driving c.95% occupancy in 2024. Long-term leases and strong anchor credit support stable cash flows and favorable financing; 10-year Treasury averaged ~4.2% in 2024. Joint ventures and brokers expand capital and leasing reach, enabling selective redevelopment and mixed-use conversions.
| Metric | 2024 |
|---|---|
| Grocery-anchored | ~90% |
| Centers | ~400 |
| Occupancy | ~95% |
| 10-yr Treasury | ~4.2% |
| Joint ventures | Selective use |
What is included in the product
Detailed Word Document
A concise, pre-written Business Model Canvas for Regency Centers, detailing customer segments, value propositions, channels, revenue streams and key resources for a grocery-anchored shopping center REIT, organized into the nine BMC blocks with strategic insights and competitive strengths to support investor presentations and operational planning.
Customizable Excel Spreadsheet
Condenses Regency Centers' retail-centric strategy into a digestible one-page snapshot that saves hours of formatting and structuring, easing planning and presentation pain points while enabling fast team collaboration and side-by-side model comparison.
Activities
Acquisition and disposition
Regency sources and underwrites grocery-anchored centers in affluent, supply-constrained suburbs, leveraging a portfolio of approximately 412 centers (~49 million sqft) to target stable cash flow. Non-core assets are sold to recycle capital into higher-growth infill and mixed-use opportunities. 1031 and tax-efficient strategies are executed where applicable to defer gains. Discipline on hurdle rates and ongoing portfolio pruning guide acquisitions and dispositions.
Development and redevelopment
Ground-up and value-add projects drive NOI growth and tenant quality, leveraging Regency Centers' portfolio of approximately 400 grocery-anchored shopping centers to attract national grocers and service tenants. Re-tenanting and densification convert underutilized parcels into higher-rent retail and residential footprints, unlocking additional rent per acre. Mixed-use integrations add residential and office demand drivers, while phased execution limits leasing and construction risk.
Leasing and merchandising
Regency curates necessity-based tenant mixes anchored by grocers across approximately 400 grocery-anchored centers in 2024, driving consistent foot traffic. Leasing teams negotiate rent structures, TI packages and co-tenancy clauses tied to sales to align landlord-tenant incentives. Data analytics optimize suite sizes and adjacencies for higher sales per sq ft, while proactive renewals keep vacancy and downtime near industry-leading levels (~95% occupancy in 2024).
Asset and property management
Asset and property management preserves Class A standards and guest experience across Regency Centers, supporting a grocery-anchored portfolio of about 27 million sq ft as of 2024; preventative maintenance and energy-efficiency upgrades reduce operating costs and downtime. Monitoring tenant sales, traffic patterns and credit risk protects rental income while continuous improvements to safety, parking and wayfinding raise retention and NOI.
- Maintain Class A standards
- Preventative maintenance & energy efficiency
- Monitor sales, traffic & credit risk
- Enhance safety, parking & wayfinding
Community and stakeholder engagement
Grocery-anchored centers: 412 assets, 49M sqft, ~95% occupancy driving stable cash flow
Regency underwrites grocery-anchored centers (412 centers, ~49M sqft in 2024) targeting stable cash flow and ~95% occupancy. It recycles capital via selective dispositions and 1031s into infill and mixed-use. Ground-up, value-add, re-tenanting and densification lift NOI. Asset management preserves Class A standards and lowers operating costs.
| Metric | 2024 |
|---|---|
| Centers | 412 |
| GLA | 49M sqft |
| Occupancy | 95% |
Full Version Awaits
Business Model Canvas
The document you're previewing is the actual Regency Centers Business Model Canvas you’ll receive after purchase. It’s not a mockup—this live preview reflects the full, editable deliverable formatted for immediate use. Buy to instantly download the identical Word and Excel files with all content included.
Original: $10.00
-65%$10.00
$3.50Description
Business Model Canvas: Strategic Blueprint for Retail Property Growth
Unlock the full strategic blueprint behind Regency Centers with our Business Model Canvas—detailing customer segments, value propositions, channels, and revenue models. This concise, actionable analysis reveals how the company scales and sustains competitive advantage. Download the complete Word/Excel canvas to benchmark, plan, or invest confidently.
Partnerships
Grocery anchor tenants
Partnerships with top-tier grocers anchor Regency Centers' portfolio—approximately 90% grocery-anchored across over 400 shopping centers—driving consistent foot traffic and stabilizing cash flows. Long-term leases, often multi-year agreements, align incentives and reduce vacancy risk. Co-marketing and coordinated site improvements boost store performance and sales per sq ft. Strong anchor credit quality supports favorable financing terms and valuation multiples.
National and regional retailers
Regency leverages partnerships with national and regional retailers—essential retail, restaurants, fitness, and services—to diversify income and stabilize cash flow across a ~400-center portfolio (2024). Portfolio-wide leasing packages create scale advantages in rent negotiations and tenant mix optimization. Data-sharing agreements improve store placement and sales productivity, while co-tenancy strategies fine-tune merchandising to boost foot traffic and average unit performance.
Municipalities and planning authorities
Entitlement success for Regency Centers (REG, ~390 grocery-anchored centers in 2024) hinges on strong municipal and planning authority partnerships. Close collaboration speeds approvals for redevelopment and mixed-use conversions, cutting project delays. Coordinating public infrastructure investments improves site access and safety. Community benefits agreements (CBAs) secure local goodwill and reduce opposition.
Developers, contractors, and design firms
Trusted delivery partners enable Regency to keep projects on-time and on-budget, supporting a portfolio that maintained c.95% occupancy in 2024 and protected rental income streams.
Rigorous value engineering preserves ROI without sacrificing quality, while sustainable design partners advance ESG targets and energy-efficiency goals reported across the sector in 2024.
Local contractors reduce permitting timelines and construction costs, delivering regional advantages in cost control and faster tenant stabilization.
- DevelopmentPipeline
- ValueEngineering
- ESGPartnerships
- LocalContractors
Capital providers and brokers
- 2024 10-year Treasury ~4.2%
- Joint ventures used for selective growth
- Brokers expand tenant reach and transaction flow
- Market intel improves pricing and risk assessment
Grocery-anchored (~90%) across ~400 centers; ~95% occupancy
Regency's key partnerships anchor ~90% grocery-anchored portfolio across ~400 centers, driving c.95% occupancy in 2024. Long-term leases and strong anchor credit support stable cash flows and favorable financing; 10-year Treasury averaged ~4.2% in 2024. Joint ventures and brokers expand capital and leasing reach, enabling selective redevelopment and mixed-use conversions.
| Metric | 2024 |
|---|---|
| Grocery-anchored | ~90% |
| Centers | ~400 |
| Occupancy | ~95% |
| 10-yr Treasury | ~4.2% |
| Joint ventures | Selective use |
What is included in the product
Detailed Word Document
A concise, pre-written Business Model Canvas for Regency Centers, detailing customer segments, value propositions, channels, revenue streams and key resources for a grocery-anchored shopping center REIT, organized into the nine BMC blocks with strategic insights and competitive strengths to support investor presentations and operational planning.
Customizable Excel Spreadsheet
Condenses Regency Centers' retail-centric strategy into a digestible one-page snapshot that saves hours of formatting and structuring, easing planning and presentation pain points while enabling fast team collaboration and side-by-side model comparison.
Activities
Acquisition and disposition
Regency sources and underwrites grocery-anchored centers in affluent, supply-constrained suburbs, leveraging a portfolio of approximately 412 centers (~49 million sqft) to target stable cash flow. Non-core assets are sold to recycle capital into higher-growth infill and mixed-use opportunities. 1031 and tax-efficient strategies are executed where applicable to defer gains. Discipline on hurdle rates and ongoing portfolio pruning guide acquisitions and dispositions.
Development and redevelopment
Ground-up and value-add projects drive NOI growth and tenant quality, leveraging Regency Centers' portfolio of approximately 400 grocery-anchored shopping centers to attract national grocers and service tenants. Re-tenanting and densification convert underutilized parcels into higher-rent retail and residential footprints, unlocking additional rent per acre. Mixed-use integrations add residential and office demand drivers, while phased execution limits leasing and construction risk.
Leasing and merchandising
Regency curates necessity-based tenant mixes anchored by grocers across approximately 400 grocery-anchored centers in 2024, driving consistent foot traffic. Leasing teams negotiate rent structures, TI packages and co-tenancy clauses tied to sales to align landlord-tenant incentives. Data analytics optimize suite sizes and adjacencies for higher sales per sq ft, while proactive renewals keep vacancy and downtime near industry-leading levels (~95% occupancy in 2024).
Asset and property management
Asset and property management preserves Class A standards and guest experience across Regency Centers, supporting a grocery-anchored portfolio of about 27 million sq ft as of 2024; preventative maintenance and energy-efficiency upgrades reduce operating costs and downtime. Monitoring tenant sales, traffic patterns and credit risk protects rental income while continuous improvements to safety, parking and wayfinding raise retention and NOI.
- Maintain Class A standards
- Preventative maintenance & energy efficiency
- Monitor sales, traffic & credit risk
- Enhance safety, parking & wayfinding
Community and stakeholder engagement
Grocery-anchored centers: 412 assets, 49M sqft, ~95% occupancy driving stable cash flow
Regency underwrites grocery-anchored centers (412 centers, ~49M sqft in 2024) targeting stable cash flow and ~95% occupancy. It recycles capital via selective dispositions and 1031s into infill and mixed-use. Ground-up, value-add, re-tenanting and densification lift NOI. Asset management preserves Class A standards and lowers operating costs.
| Metric | 2024 |
|---|---|
| Centers | 412 |
| GLA | 49M sqft |
| Occupancy | 95% |
Full Version Awaits
Business Model Canvas
The document you're previewing is the actual Regency Centers Business Model Canvas you’ll receive after purchase. It’s not a mockup—this live preview reflects the full, editable deliverable formatted for immediate use. Buy to instantly download the identical Word and Excel files with all content included.











