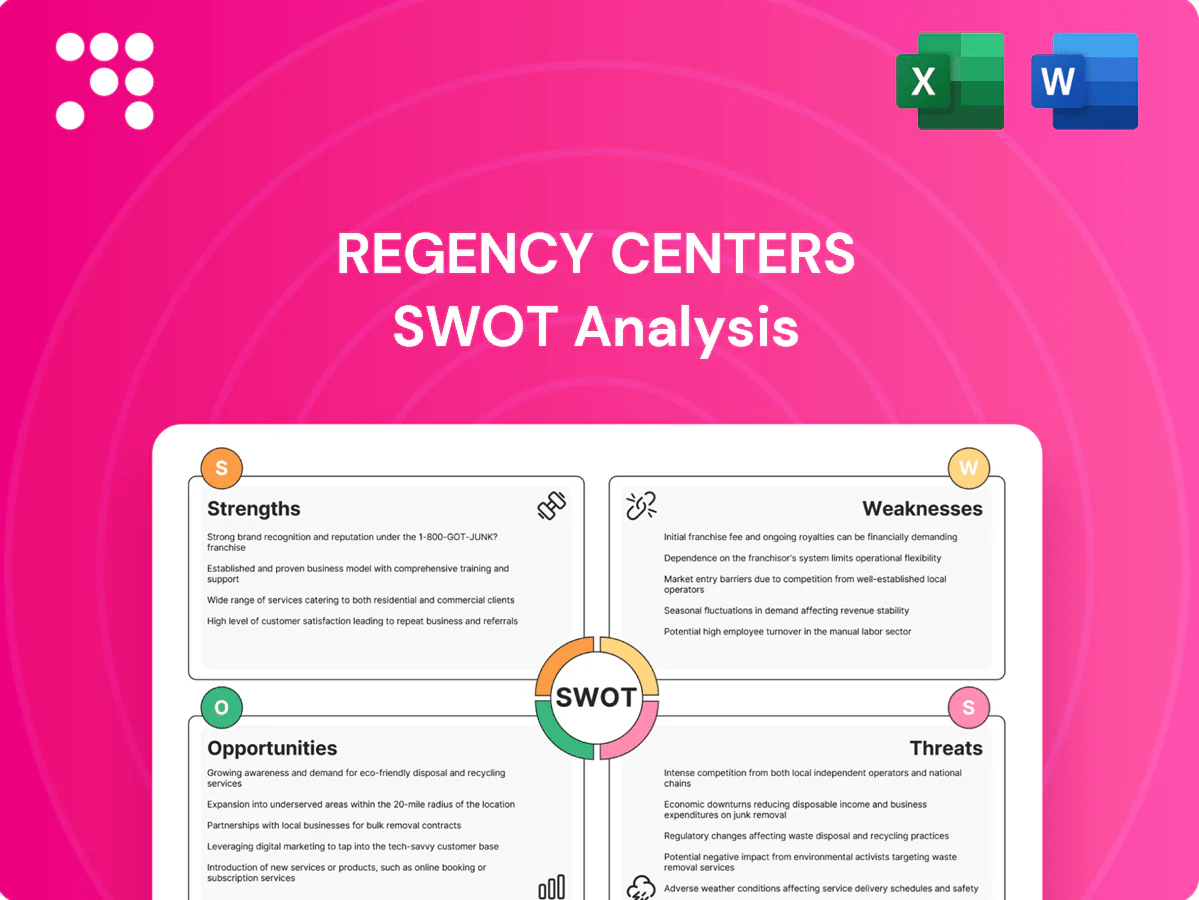
Regency Centers SWOT Analysis

Elevate Your Analysis with the Complete SWOT Report
Regency Centers' SWOT highlights a resilient grocery-anchored portfolio, strong occupancy and a disciplined development pipeline, alongside exposure to rising interest rates and evolving retail trends. The snapshot flags clear growth drivers and operational risks. Purchase the full SWOT to access a research-backed, editable Word and Excel package with financial context and strategic recommendations.
Strengths

Grocery-anchored portfolio resilience
Essential, traffic-driving grocers stabilize footfall and rent collections through cycles, with Regency owning or operating about 415 shopping centers as of 2024, predominantly grocery-anchored. Necessity-based trips keep centers relevant versus discretionary retail, supporting higher visit frequency and resilience. Anchors boost inline tenant sales and occupancy, underpinning lower volatility and steadier cash flows.
Focus on affluent, educated suburbs
Regency Centers’ focus on affluent, educated suburbs concentrates trade areas with household incomes above the US median ($74,580 in 2022), supporting stronger tenant sales and higher rent levels. These demographics attract premium service, health and restaurant concepts that pay rent premiums and report superior sales per square foot. The resulting pricing power and renewal spreads bolster asset liquidity and valuation for the portfolio.

Diverse necessity and service tenant mix
Regency Centers' diverse mix of essential retail, restaurants and service tenants across over 400 grocery-anchored centers reduces category concentration risk and supports resilient cash flow. Cross-shopping between grocers and restaurants increases dwell time and sales per square foot, boosting tenant productivity versus non-anchored centers. Service uses—healthcare, salons, urgent care—face minimal e-commerce displacement, improving occupancy durability.

Active development and redevelopment capability
Active development and redevelopment lift NOI through densification, remerchandising, and mixed-use additions that increase customer traffic and ancillary revenue, while in-house development expertise shortens timelines and controls cost, improving project IRRs. Redevelopment refreshes aging centers to current consumer preferences and compounds growth beyond base rent bumps by capturing new demand and higher lease rates.
- Value-add NOI uplift via densification and mixed-use
- In-house team reduces timeline and cost
- Redevelopment aligns centers with consumer trends
Community-centric placemaking strategy
Regency Centers leverages a community-centric placemaking strategy that transforms centers into daily-needs hubs, driving loyalty and repeat visits through curated programming, safety-focused design, and convenience amenities. Deep community integration supports stable leasing demand and higher tenant retention, differentiating assets from commodity strip centers and reinforcing value per square foot.
- Daily-needs hub
- Programming & design
- Community integration
- Asset differentiation
Grocery-anchored 415-center portfolio drives steady cash flow in affluent suburbs
Grocery-anchored portfolio of about 415 shopping centers (2024) stabilizes traffic, rents and cash flow. Focus on affluent suburbs—trade areas with household incomes above the 2022 US median ($74,580)—supports premium rents and tenant sales. Active densification/redevelopment and in-house development increase NOI and asset revaluation.
| Metric | Value |
|---|---|
| Centers (2024) | ~415 |
| US median household income (2022) | $74,580 |
What is included in the product
 Detailed Word Document
Provides a concise SWOT analysis of Regency Centers, highlighting internal strengths and weaknesses and external opportunities and threats that shape its competitive position and growth prospects.

 Customizable Excel Spreadsheet
Provides a clear SWOT matrix tailored to Regency Centers for rapid alignment on retail property risks and opportunities; editable format enables quick updates as market conditions or tenant mixes change.
Weaknesses

Exposure to retail tenant health
Despite Regency Centers' necessity-driven portfolio of roughly 25 million square feet, tenant failures and chain bankruptcies can still dent NOI through lost rent and increased TI/downtime; recent retail restructurings have driven higher vacancy durations. Releasing spreads compress in softer markets, and re-leasing large, complex anchor boxes typically takes longer and raises leasing cost risk.
Capital intensity for redevelopment
Redevelopment is capital intensive and often needs large upfront outlays; cost overruns and permitting delays can compress IRRs. Higher short-term rates (Fed funds 5.25–5.50% in 2024–25) elevate carry costs and WACC, pressuring returns. Regency’s Sunbelt-focused pipeline concentration increases execution and market risk.

Geographic concentration risks
Regency Centers' focus in select suburban MSAs (roughly 380 centers, ~60 million sq ft) magnifies local economic shocks, with top MSAs driving a large share of NOI. Heavy competitive supply in hot submarkets can cap rent growth, while commercial insurance and resilience costs have risen mid‑teens percent recently after escalating natural disasters. Regional demand shifts could unbalance portfolio performance.

Sensitivity to interest rates
As a REIT, Regency Centers faces rate sensitivity: the Fed funds target reached 5.25–5.50% during the 2023–24 tightening cycle, raising borrowing costs and pressuring cap rates, which compress acquisition returns; higher refinancing costs risk diluting FFO growth and rising required equity returns if unit prices weaken.
- Rate environment: Fed funds 5.25–5.50%
- Cap rate pressure: lowers acquisition math
- Refinancing risk: potential FFO dilution
- Equity risk: higher cost if shares weaken
Limited e-commerce immunity
Regency’s over 90% grocery-anchored portfolio limits e-commerce insulation as online sales hit 16.4% of US retail in 2024 (US Census) while grocery e-commerce remains ~3-4% (Brick Meets Click), and rapid curbside/delivery adoption cuts in-store trip frequency. Required parking/logistics retrofits raise capex, and thin grocer margins (often 1–3%) can pressure tenants and constrain rent growth.
- 16.4% US e‑commerce share (2024, US Census)
- Grocery e‑commerce ~3–4% (Brick Meets Click)
- Grocery margins ~1–3%—limits rent upside
Sunbelt grocery centers: vacancy, capex & refinancing risk at 5.25–5.50%
Regency’s grocery‑anchored, Sunbelt‑focused portfolio (~380 centers, ~60M sq ft) faces vacancy/leasing cost risk from tenant failures and long anchor re‑lets; redevelopment is capex‑intensive and sensitive to permitting. Rate pressure (Fed funds 5.25–5.50%) raises WACC and refinancing risk, while e‑commerce (16.4% of retail) and thin grocer margins (1–3%) limit rent upside.
| Metric | Value |
|---|---|
| Centers / GLA | ~380 / ~60M sq ft |
| Fed funds (2024–25) | 5.25–5.50% |
| US e‑commerce (2024) | 16.4% |
| Grocery e‑com | 3–4% |
| Grocery margins | 1–3% |
What You See Is What You Get
Regency Centers SWOT Analysis
This is a real excerpt from the complete Regency Centers SWOT analysis you'll receive upon purchase—no surprises, just professional quality. The preview below is taken directly from the full report. Buy to unlock the entire editable, detailed version for immediate download.

Elevate Your Analysis with the Complete SWOT Report
Regency Centers' SWOT highlights a resilient grocery-anchored portfolio, strong occupancy and a disciplined development pipeline, alongside exposure to rising interest rates and evolving retail trends. The snapshot flags clear growth drivers and operational risks. Purchase the full SWOT to access a research-backed, editable Word and Excel package with financial context and strategic recommendations.
Strengths
Grocery-anchored portfolio resilience
Essential, traffic-driving grocers stabilize footfall and rent collections through cycles, with Regency owning or operating about 415 shopping centers as of 2024, predominantly grocery-anchored. Necessity-based trips keep centers relevant versus discretionary retail, supporting higher visit frequency and resilience. Anchors boost inline tenant sales and occupancy, underpinning lower volatility and steadier cash flows.
Focus on affluent, educated suburbs
Regency Centers’ focus on affluent, educated suburbs concentrates trade areas with household incomes above the US median ($74,580 in 2022), supporting stronger tenant sales and higher rent levels. These demographics attract premium service, health and restaurant concepts that pay rent premiums and report superior sales per square foot. The resulting pricing power and renewal spreads bolster asset liquidity and valuation for the portfolio.
Diverse necessity and service tenant mix
Regency Centers' diverse mix of essential retail, restaurants and service tenants across over 400 grocery-anchored centers reduces category concentration risk and supports resilient cash flow. Cross-shopping between grocers and restaurants increases dwell time and sales per square foot, boosting tenant productivity versus non-anchored centers. Service uses—healthcare, salons, urgent care—face minimal e-commerce displacement, improving occupancy durability.
Active development and redevelopment capability
Active development and redevelopment lift NOI through densification, remerchandising, and mixed-use additions that increase customer traffic and ancillary revenue, while in-house development expertise shortens timelines and controls cost, improving project IRRs. Redevelopment refreshes aging centers to current consumer preferences and compounds growth beyond base rent bumps by capturing new demand and higher lease rates.
- Value-add NOI uplift via densification and mixed-use
- In-house team reduces timeline and cost
- Redevelopment aligns centers with consumer trends
Community-centric placemaking strategy
Regency Centers leverages a community-centric placemaking strategy that transforms centers into daily-needs hubs, driving loyalty and repeat visits through curated programming, safety-focused design, and convenience amenities. Deep community integration supports stable leasing demand and higher tenant retention, differentiating assets from commodity strip centers and reinforcing value per square foot.
- Daily-needs hub
- Programming & design
- Community integration
- Asset differentiation
Grocery-anchored 415-center portfolio drives steady cash flow in affluent suburbs
Grocery-anchored portfolio of about 415 shopping centers (2024) stabilizes traffic, rents and cash flow. Focus on affluent suburbs—trade areas with household incomes above the 2022 US median ($74,580)—supports premium rents and tenant sales. Active densification/redevelopment and in-house development increase NOI and asset revaluation.
| Metric | Value |
|---|---|
| Centers (2024) | ~415 |
| US median household income (2022) | $74,580 |
What is included in the product
Detailed Word Document
Provides a concise SWOT analysis of Regency Centers, highlighting internal strengths and weaknesses and external opportunities and threats that shape its competitive position and growth prospects.
Customizable Excel Spreadsheet
Provides a clear SWOT matrix tailored to Regency Centers for rapid alignment on retail property risks and opportunities; editable format enables quick updates as market conditions or tenant mixes change.
Weaknesses
Exposure to retail tenant health
Despite Regency Centers' necessity-driven portfolio of roughly 25 million square feet, tenant failures and chain bankruptcies can still dent NOI through lost rent and increased TI/downtime; recent retail restructurings have driven higher vacancy durations. Releasing spreads compress in softer markets, and re-leasing large, complex anchor boxes typically takes longer and raises leasing cost risk.
Capital intensity for redevelopment
Redevelopment is capital intensive and often needs large upfront outlays; cost overruns and permitting delays can compress IRRs. Higher short-term rates (Fed funds 5.25–5.50% in 2024–25) elevate carry costs and WACC, pressuring returns. Regency’s Sunbelt-focused pipeline concentration increases execution and market risk.
Geographic concentration risks
Regency Centers' focus in select suburban MSAs (roughly 380 centers, ~60 million sq ft) magnifies local economic shocks, with top MSAs driving a large share of NOI. Heavy competitive supply in hot submarkets can cap rent growth, while commercial insurance and resilience costs have risen mid‑teens percent recently after escalating natural disasters. Regional demand shifts could unbalance portfolio performance.
Sensitivity to interest rates
As a REIT, Regency Centers faces rate sensitivity: the Fed funds target reached 5.25–5.50% during the 2023–24 tightening cycle, raising borrowing costs and pressuring cap rates, which compress acquisition returns; higher refinancing costs risk diluting FFO growth and rising required equity returns if unit prices weaken.
- Rate environment: Fed funds 5.25–5.50%
- Cap rate pressure: lowers acquisition math
- Refinancing risk: potential FFO dilution
- Equity risk: higher cost if shares weaken
Limited e-commerce immunity
Regency’s over 90% grocery-anchored portfolio limits e-commerce insulation as online sales hit 16.4% of US retail in 2024 (US Census) while grocery e-commerce remains ~3-4% (Brick Meets Click), and rapid curbside/delivery adoption cuts in-store trip frequency. Required parking/logistics retrofits raise capex, and thin grocer margins (often 1–3%) can pressure tenants and constrain rent growth.
- 16.4% US e‑commerce share (2024, US Census)
- Grocery e‑commerce ~3–4% (Brick Meets Click)
- Grocery margins ~1–3%—limits rent upside
Sunbelt grocery centers: vacancy, capex & refinancing risk at 5.25–5.50%
Regency’s grocery‑anchored, Sunbelt‑focused portfolio (~380 centers, ~60M sq ft) faces vacancy/leasing cost risk from tenant failures and long anchor re‑lets; redevelopment is capex‑intensive and sensitive to permitting. Rate pressure (Fed funds 5.25–5.50%) raises WACC and refinancing risk, while e‑commerce (16.4% of retail) and thin grocer margins (1–3%) limit rent upside.
| Metric | Value |
|---|---|
| Centers / GLA | ~380 / ~60M sq ft |
| Fed funds (2024–25) | 5.25–5.50% |
| US e‑commerce (2024) | 16.4% |
| Grocery e‑com | 3–4% |
| Grocery margins | 1–3% |
What You See Is What You Get
Regency Centers SWOT Analysis
This is a real excerpt from the complete Regency Centers SWOT analysis you'll receive upon purchase—no surprises, just professional quality. The preview below is taken directly from the full report. Buy to unlock the entire editable, detailed version for immediate download.
Original: $10.00
-65%$10.00
$3.50Description
Elevate Your Analysis with the Complete SWOT Report
Regency Centers' SWOT highlights a resilient grocery-anchored portfolio, strong occupancy and a disciplined development pipeline, alongside exposure to rising interest rates and evolving retail trends. The snapshot flags clear growth drivers and operational risks. Purchase the full SWOT to access a research-backed, editable Word and Excel package with financial context and strategic recommendations.
Strengths
Grocery-anchored portfolio resilience
Essential, traffic-driving grocers stabilize footfall and rent collections through cycles, with Regency owning or operating about 415 shopping centers as of 2024, predominantly grocery-anchored. Necessity-based trips keep centers relevant versus discretionary retail, supporting higher visit frequency and resilience. Anchors boost inline tenant sales and occupancy, underpinning lower volatility and steadier cash flows.
Focus on affluent, educated suburbs
Regency Centers’ focus on affluent, educated suburbs concentrates trade areas with household incomes above the US median ($74,580 in 2022), supporting stronger tenant sales and higher rent levels. These demographics attract premium service, health and restaurant concepts that pay rent premiums and report superior sales per square foot. The resulting pricing power and renewal spreads bolster asset liquidity and valuation for the portfolio.
Diverse necessity and service tenant mix
Regency Centers' diverse mix of essential retail, restaurants and service tenants across over 400 grocery-anchored centers reduces category concentration risk and supports resilient cash flow. Cross-shopping between grocers and restaurants increases dwell time and sales per square foot, boosting tenant productivity versus non-anchored centers. Service uses—healthcare, salons, urgent care—face minimal e-commerce displacement, improving occupancy durability.
Active development and redevelopment capability
Active development and redevelopment lift NOI through densification, remerchandising, and mixed-use additions that increase customer traffic and ancillary revenue, while in-house development expertise shortens timelines and controls cost, improving project IRRs. Redevelopment refreshes aging centers to current consumer preferences and compounds growth beyond base rent bumps by capturing new demand and higher lease rates.
- Value-add NOI uplift via densification and mixed-use
- In-house team reduces timeline and cost
- Redevelopment aligns centers with consumer trends
Community-centric placemaking strategy
Regency Centers leverages a community-centric placemaking strategy that transforms centers into daily-needs hubs, driving loyalty and repeat visits through curated programming, safety-focused design, and convenience amenities. Deep community integration supports stable leasing demand and higher tenant retention, differentiating assets from commodity strip centers and reinforcing value per square foot.
- Daily-needs hub
- Programming & design
- Community integration
- Asset differentiation
Grocery-anchored 415-center portfolio drives steady cash flow in affluent suburbs
Grocery-anchored portfolio of about 415 shopping centers (2024) stabilizes traffic, rents and cash flow. Focus on affluent suburbs—trade areas with household incomes above the 2022 US median ($74,580)—supports premium rents and tenant sales. Active densification/redevelopment and in-house development increase NOI and asset revaluation.
| Metric | Value |
|---|---|
| Centers (2024) | ~415 |
| US median household income (2022) | $74,580 |
What is included in the product
Detailed Word Document
Provides a concise SWOT analysis of Regency Centers, highlighting internal strengths and weaknesses and external opportunities and threats that shape its competitive position and growth prospects.
Customizable Excel Spreadsheet
Provides a clear SWOT matrix tailored to Regency Centers for rapid alignment on retail property risks and opportunities; editable format enables quick updates as market conditions or tenant mixes change.
Weaknesses
Exposure to retail tenant health
Despite Regency Centers' necessity-driven portfolio of roughly 25 million square feet, tenant failures and chain bankruptcies can still dent NOI through lost rent and increased TI/downtime; recent retail restructurings have driven higher vacancy durations. Releasing spreads compress in softer markets, and re-leasing large, complex anchor boxes typically takes longer and raises leasing cost risk.
Capital intensity for redevelopment
Redevelopment is capital intensive and often needs large upfront outlays; cost overruns and permitting delays can compress IRRs. Higher short-term rates (Fed funds 5.25–5.50% in 2024–25) elevate carry costs and WACC, pressuring returns. Regency’s Sunbelt-focused pipeline concentration increases execution and market risk.
Geographic concentration risks
Regency Centers' focus in select suburban MSAs (roughly 380 centers, ~60 million sq ft) magnifies local economic shocks, with top MSAs driving a large share of NOI. Heavy competitive supply in hot submarkets can cap rent growth, while commercial insurance and resilience costs have risen mid‑teens percent recently after escalating natural disasters. Regional demand shifts could unbalance portfolio performance.
Sensitivity to interest rates
As a REIT, Regency Centers faces rate sensitivity: the Fed funds target reached 5.25–5.50% during the 2023–24 tightening cycle, raising borrowing costs and pressuring cap rates, which compress acquisition returns; higher refinancing costs risk diluting FFO growth and rising required equity returns if unit prices weaken.
- Rate environment: Fed funds 5.25–5.50%
- Cap rate pressure: lowers acquisition math
- Refinancing risk: potential FFO dilution
- Equity risk: higher cost if shares weaken
Limited e-commerce immunity
Regency’s over 90% grocery-anchored portfolio limits e-commerce insulation as online sales hit 16.4% of US retail in 2024 (US Census) while grocery e-commerce remains ~3-4% (Brick Meets Click), and rapid curbside/delivery adoption cuts in-store trip frequency. Required parking/logistics retrofits raise capex, and thin grocer margins (often 1–3%) can pressure tenants and constrain rent growth.
- 16.4% US e‑commerce share (2024, US Census)
- Grocery e‑commerce ~3–4% (Brick Meets Click)
- Grocery margins ~1–3%—limits rent upside
Sunbelt grocery centers: vacancy, capex & refinancing risk at 5.25–5.50%
Regency’s grocery‑anchored, Sunbelt‑focused portfolio (~380 centers, ~60M sq ft) faces vacancy/leasing cost risk from tenant failures and long anchor re‑lets; redevelopment is capex‑intensive and sensitive to permitting. Rate pressure (Fed funds 5.25–5.50%) raises WACC and refinancing risk, while e‑commerce (16.4% of retail) and thin grocer margins (1–3%) limit rent upside.
| Metric | Value |
|---|---|
| Centers / GLA | ~380 / ~60M sq ft |
| Fed funds (2024–25) | 5.25–5.50% |
| US e‑commerce (2024) | 16.4% |
| Grocery e‑com | 3–4% |
| Grocery margins | 1–3% |
What You See Is What You Get
Regency Centers SWOT Analysis
This is a real excerpt from the complete Regency Centers SWOT analysis you'll receive upon purchase—no surprises, just professional quality. The preview below is taken directly from the full report. Buy to unlock the entire editable, detailed version for immediate download.











