Reka Industrial SWOT Analysis

Go Beyond the Preview—Access the Full Strategic Report
Reka Industrial's SWOT highlights strong engineering capabilities and diversified market access, tempered by margin pressure and raw-material exposure. Our full SWOT deep-dives competitive positioning, financial implications, and strategic opportunities. Purchase the complete, editable report for investor-ready insights to plan, pitch, or act with confidence.
Strengths

Focused industrial investment model
Reka Industrial’s active ownership approach provides hands-on strategic steering and operational support for subsidiaries, enabling faster performance turnaround than passive holding peers. Long-term commitment aligns management incentives and capital allocation with compounding value creation over cycles. The model is especially effective in cyclical industrials where sustained operational excellence drives returns.
Diversified exposure to cable and rubber
Operating across cable and rubber spreads Reka Industrial’s risk across distinct yet complementary end-markets—infrastructure, energy, mobility and industrial maintenance—helping stabilize cash flows through cycles. This exposure aligns revenues with steady public and private infrastructure spending and ongoing energy and mobility upgrades. The dual portfolio also enables cross-portfolio learnings in manufacturing efficiency and centralized procurement, lowering unit costs and improving margin resilience.

Strong industrial know-how and Finnish heritage
Finland’s deep engineering base and ~3.6% R&D intensity of GDP (Eurostat 2023) support Reka Industrial’s high-quality manufacturing, safety and compliance standards. Strong Finnish brand trust and technical credibility boost tender success in regulated markets, increasing win rates versus unknown suppliers. Local expertise improves workforce stability and process innovation, underpinning premium positioning against low-cost competitors.

Operational improvement and synergy potential
- Lean & automation roll-out
- Procurement scale in metals/polymers/chemicals
- Cross-selling to shared B2B bases
- Compounding multi-year synergies
Stable B2B customer relationships
Cable and rubber products often integrate into long-lived systems with strict qualification barriers, creating high entry hurdles for competitors. Repeat orders and framework agreements provide strong revenue visibility while technical support and aftersales increase switching costs. These factors underpin resilient baseline volumes even during cyclical downturns.
- Long-lived system integration: high qualification barriers
- Repeat orders/frameworks: improved revenue visibility
- Aftersales/technical support: elevated switching costs
- Resilience: stable baseline volumes in downturns
Active ownership fuels faster turnarounds and stable cash flow across four end-markets
Reka Industrial’s active ownership drives faster operational turnarounds and long-term capital alignment across its cable and rubber businesses, stabilizing cash flow via diversified exposure to four end-markets: infrastructure, energy, mobility and industrial maintenance. Finnish engineering strength and Eurostat 2023 R&D intensity of 3.6% support high-quality manufacturing and tender competitiveness. Long-lived system integration and framework agreements create high switching costs and revenue visibility.
| Metric | Value |
|---|---|
| R&D intensity (Finland, Eurostat 2023) | 3.6% |
| End-markets | 4 |
What is included in the product
 Detailed Word Document
Provides a concise SWOT analysis of Reka Industrial, highlighting internal strengths and weaknesses plus external opportunities and threats to assess its competitive position, growth drivers, and strategic risks.

 Customizable Excel Spreadsheet
Provides a concise, visual SWOT matrix for Reka Industrial to quickly align strategy, streamline stakeholder communication, and enable fast updates as risks and opportunities evolve.
Weaknesses

Sector concentration in two niches
Exposure is largely confined to cable and rubber markets, leaving Reka Industrial dependent on two niches that together represented the bulk of sales in 2024. A simultaneous downturn in construction, infrastructure or automotive — sectors that drove ~60–70% of demand for these inputs in 2024 regional data — could depress revenues sharply. Limited sector breadth reduces shock absorption and constrains portfolio rebalancing options.
Subscale versus global incumbents
Subscale versus global incumbents leaves Reka Industrial at a procurement and distribution disadvantage: global manufacturers drive procurement economies and vertical integration while global R&D spend topped about $2.0 trillion in 2023, widening innovation gaps. Price competition in commoditized lines can compress margins by double digits, eroding profitability. Limited scale weakens bargaining power with suppliers and key accounts and constrains rapid global market penetration.

Capital intensity and working capital needs
Reka Industrial faces continuous capex demands for machinery, tooling and regulatory compliance, typically representing 5–8% of revenue in cable/rubber peers; copper and elastomer inventories lock capital — LME copper averaged about $9,500/t in 2024 with >20% intra‑year swings — and elevated maintenance capex squeezes free cash flow, constraining ability to fund rapid expansion.

Exposure to cyclical end-markets
Reka Industrial is exposed to cyclical end-markets where construction, utilities capex and transportation cycles drive volumes, making revenue sensitive to project delays and budget cuts that create lumpiness; OEM production swings further propagate through the supply chain and complicate forecasting and capacity planning.
- Construction, utilities, transport sensitivity
- Project delays → revenue lumpiness
- OEM production swings affect supply chain
- Harder forecasting & capacity planning
Key-person and execution risk
Active ownership depends on experienced operators and integration talent; global CEO tenure averaged about 7.2 years in 2023, so leadership churn can stall Reka’s programs. Missteps in M&A or plant modernization can destroy value—roughly 70% of acquisitions and large transformations fail. Governance complexity rises with multiple subsidiaries, increasing oversight and compliance burdens.
- Key-person risk
- Integration talent gap
- 70% M&A/transformation failure rate
- Higher governance complexity with multiple subsidiaries
Cable/rubber exposure 60–70% plus capex and copper risk
Reka’s revenue is concentrated in cable/rubber (≈60–70% end‑market exposure in 2024), raising downside risk from construction/auto cycles; scale gaps versus global peers (global R&D ≈$2.0T in 2023) compress margins. Capex needs (peer 5–8% of revenue) and LME copper ≈$9,500/t in 2024 tie up cash. Leadership/key‑person risk (CEO tenure ~7.2 yrs) and ~70% M&A failure rate heighten execution risk.
| Metric | Value |
|---|---|
| End‑market exposure (2024) | 60–70% |
| Peer capex | 5–8% rev |
| LME copper (2024 avg) | $9,500/t |
| Global R&D (2023) | $2.0T |
| M&A failure rate | ~70% |
What You See Is What You Get
Reka Industrial SWOT Analysis
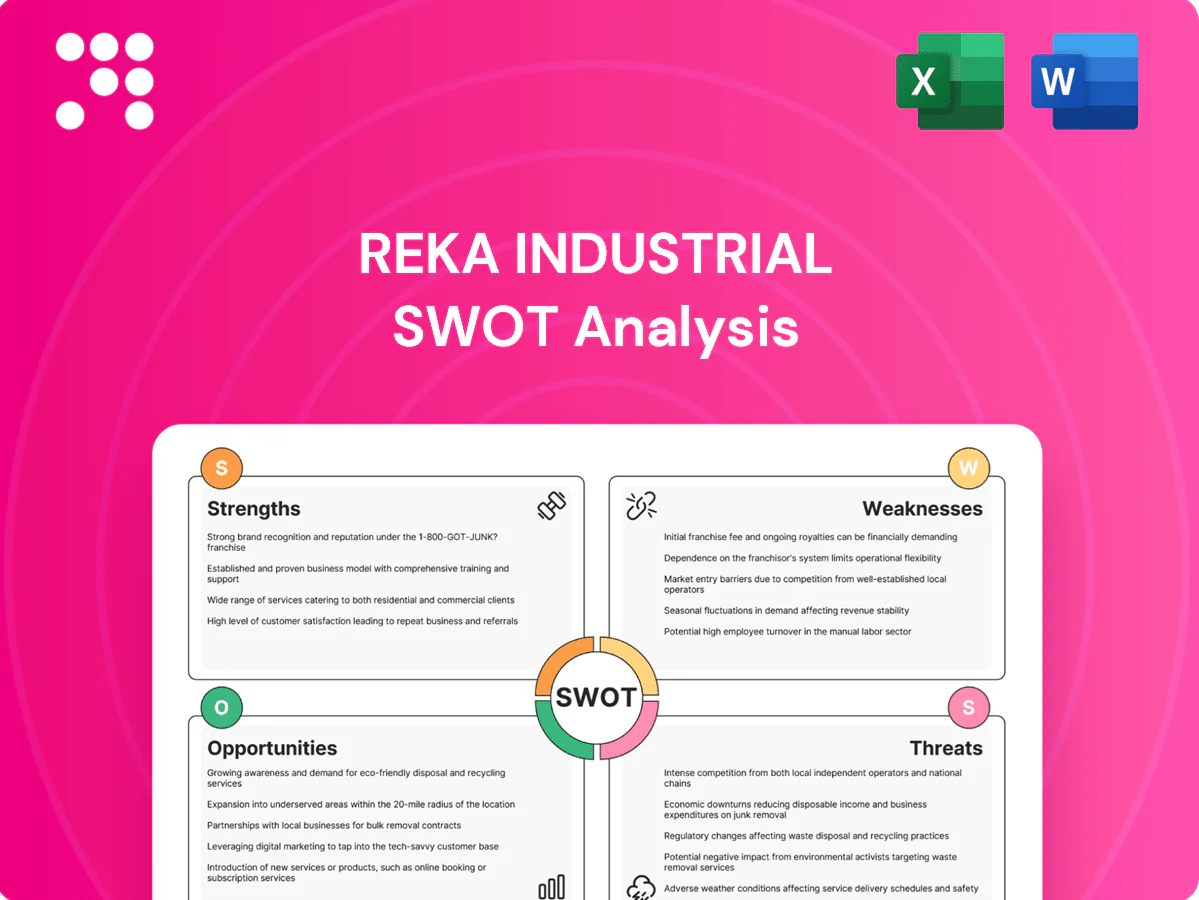
This is the actual Reka Industrial SWOT analysis document you’ll receive upon purchase—no surprises, just professional quality and structured insights. The preview below is taken directly from the full report and reflects the same editable file available after checkout. Buy now to unlock the complete, detailed version ready for immediate download and use.

Go Beyond the Preview—Access the Full Strategic Report
Reka Industrial's SWOT highlights strong engineering capabilities and diversified market access, tempered by margin pressure and raw-material exposure. Our full SWOT deep-dives competitive positioning, financial implications, and strategic opportunities. Purchase the complete, editable report for investor-ready insights to plan, pitch, or act with confidence.
Strengths
Focused industrial investment model
Reka Industrial’s active ownership approach provides hands-on strategic steering and operational support for subsidiaries, enabling faster performance turnaround than passive holding peers. Long-term commitment aligns management incentives and capital allocation with compounding value creation over cycles. The model is especially effective in cyclical industrials where sustained operational excellence drives returns.
Diversified exposure to cable and rubber
Operating across cable and rubber spreads Reka Industrial’s risk across distinct yet complementary end-markets—infrastructure, energy, mobility and industrial maintenance—helping stabilize cash flows through cycles. This exposure aligns revenues with steady public and private infrastructure spending and ongoing energy and mobility upgrades. The dual portfolio also enables cross-portfolio learnings in manufacturing efficiency and centralized procurement, lowering unit costs and improving margin resilience.
Strong industrial know-how and Finnish heritage
Finland’s deep engineering base and ~3.6% R&D intensity of GDP (Eurostat 2023) support Reka Industrial’s high-quality manufacturing, safety and compliance standards. Strong Finnish brand trust and technical credibility boost tender success in regulated markets, increasing win rates versus unknown suppliers. Local expertise improves workforce stability and process innovation, underpinning premium positioning against low-cost competitors.
Operational improvement and synergy potential
- Lean & automation roll-out
- Procurement scale in metals/polymers/chemicals
- Cross-selling to shared B2B bases
- Compounding multi-year synergies
Stable B2B customer relationships
Cable and rubber products often integrate into long-lived systems with strict qualification barriers, creating high entry hurdles for competitors. Repeat orders and framework agreements provide strong revenue visibility while technical support and aftersales increase switching costs. These factors underpin resilient baseline volumes even during cyclical downturns.
- Long-lived system integration: high qualification barriers
- Repeat orders/frameworks: improved revenue visibility
- Aftersales/technical support: elevated switching costs
- Resilience: stable baseline volumes in downturns
Active ownership fuels faster turnarounds and stable cash flow across four end-markets
Reka Industrial’s active ownership drives faster operational turnarounds and long-term capital alignment across its cable and rubber businesses, stabilizing cash flow via diversified exposure to four end-markets: infrastructure, energy, mobility and industrial maintenance. Finnish engineering strength and Eurostat 2023 R&D intensity of 3.6% support high-quality manufacturing and tender competitiveness. Long-lived system integration and framework agreements create high switching costs and revenue visibility.
| Metric | Value |
|---|---|
| R&D intensity (Finland, Eurostat 2023) | 3.6% |
| End-markets | 4 |
What is included in the product
Detailed Word Document
Provides a concise SWOT analysis of Reka Industrial, highlighting internal strengths and weaknesses plus external opportunities and threats to assess its competitive position, growth drivers, and strategic risks.
Customizable Excel Spreadsheet
Provides a concise, visual SWOT matrix for Reka Industrial to quickly align strategy, streamline stakeholder communication, and enable fast updates as risks and opportunities evolve.
Weaknesses
Sector concentration in two niches
Exposure is largely confined to cable and rubber markets, leaving Reka Industrial dependent on two niches that together represented the bulk of sales in 2024. A simultaneous downturn in construction, infrastructure or automotive — sectors that drove ~60–70% of demand for these inputs in 2024 regional data — could depress revenues sharply. Limited sector breadth reduces shock absorption and constrains portfolio rebalancing options.
Subscale versus global incumbents
Subscale versus global incumbents leaves Reka Industrial at a procurement and distribution disadvantage: global manufacturers drive procurement economies and vertical integration while global R&D spend topped about $2.0 trillion in 2023, widening innovation gaps. Price competition in commoditized lines can compress margins by double digits, eroding profitability. Limited scale weakens bargaining power with suppliers and key accounts and constrains rapid global market penetration.
Capital intensity and working capital needs
Reka Industrial faces continuous capex demands for machinery, tooling and regulatory compliance, typically representing 5–8% of revenue in cable/rubber peers; copper and elastomer inventories lock capital — LME copper averaged about $9,500/t in 2024 with >20% intra‑year swings — and elevated maintenance capex squeezes free cash flow, constraining ability to fund rapid expansion.
Exposure to cyclical end-markets
Reka Industrial is exposed to cyclical end-markets where construction, utilities capex and transportation cycles drive volumes, making revenue sensitive to project delays and budget cuts that create lumpiness; OEM production swings further propagate through the supply chain and complicate forecasting and capacity planning.
- Construction, utilities, transport sensitivity
- Project delays → revenue lumpiness
- OEM production swings affect supply chain
- Harder forecasting & capacity planning
Key-person and execution risk
Active ownership depends on experienced operators and integration talent; global CEO tenure averaged about 7.2 years in 2023, so leadership churn can stall Reka’s programs. Missteps in M&A or plant modernization can destroy value—roughly 70% of acquisitions and large transformations fail. Governance complexity rises with multiple subsidiaries, increasing oversight and compliance burdens.
- Key-person risk
- Integration talent gap
- 70% M&A/transformation failure rate
- Higher governance complexity with multiple subsidiaries
Cable/rubber exposure 60–70% plus capex and copper risk
Reka’s revenue is concentrated in cable/rubber (≈60–70% end‑market exposure in 2024), raising downside risk from construction/auto cycles; scale gaps versus global peers (global R&D ≈$2.0T in 2023) compress margins. Capex needs (peer 5–8% of revenue) and LME copper ≈$9,500/t in 2024 tie up cash. Leadership/key‑person risk (CEO tenure ~7.2 yrs) and ~70% M&A failure rate heighten execution risk.
| Metric | Value |
|---|---|
| End‑market exposure (2024) | 60–70% |
| Peer capex | 5–8% rev |
| LME copper (2024 avg) | $9,500/t |
| Global R&D (2023) | $2.0T |
| M&A failure rate | ~70% |
What You See Is What You Get
Reka Industrial SWOT Analysis
This is the actual Reka Industrial SWOT analysis document you’ll receive upon purchase—no surprises, just professional quality and structured insights. The preview below is taken directly from the full report and reflects the same editable file available after checkout. Buy now to unlock the complete, detailed version ready for immediate download and use.
Original: $10.00
-65%$10.00
$3.50Description
Go Beyond the Preview—Access the Full Strategic Report
Reka Industrial's SWOT highlights strong engineering capabilities and diversified market access, tempered by margin pressure and raw-material exposure. Our full SWOT deep-dives competitive positioning, financial implications, and strategic opportunities. Purchase the complete, editable report for investor-ready insights to plan, pitch, or act with confidence.
Strengths
Focused industrial investment model
Reka Industrial’s active ownership approach provides hands-on strategic steering and operational support for subsidiaries, enabling faster performance turnaround than passive holding peers. Long-term commitment aligns management incentives and capital allocation with compounding value creation over cycles. The model is especially effective in cyclical industrials where sustained operational excellence drives returns.
Diversified exposure to cable and rubber
Operating across cable and rubber spreads Reka Industrial’s risk across distinct yet complementary end-markets—infrastructure, energy, mobility and industrial maintenance—helping stabilize cash flows through cycles. This exposure aligns revenues with steady public and private infrastructure spending and ongoing energy and mobility upgrades. The dual portfolio also enables cross-portfolio learnings in manufacturing efficiency and centralized procurement, lowering unit costs and improving margin resilience.
Strong industrial know-how and Finnish heritage
Finland’s deep engineering base and ~3.6% R&D intensity of GDP (Eurostat 2023) support Reka Industrial’s high-quality manufacturing, safety and compliance standards. Strong Finnish brand trust and technical credibility boost tender success in regulated markets, increasing win rates versus unknown suppliers. Local expertise improves workforce stability and process innovation, underpinning premium positioning against low-cost competitors.
Operational improvement and synergy potential
- Lean & automation roll-out
- Procurement scale in metals/polymers/chemicals
- Cross-selling to shared B2B bases
- Compounding multi-year synergies
Stable B2B customer relationships
Cable and rubber products often integrate into long-lived systems with strict qualification barriers, creating high entry hurdles for competitors. Repeat orders and framework agreements provide strong revenue visibility while technical support and aftersales increase switching costs. These factors underpin resilient baseline volumes even during cyclical downturns.
- Long-lived system integration: high qualification barriers
- Repeat orders/frameworks: improved revenue visibility
- Aftersales/technical support: elevated switching costs
- Resilience: stable baseline volumes in downturns
Active ownership fuels faster turnarounds and stable cash flow across four end-markets
Reka Industrial’s active ownership drives faster operational turnarounds and long-term capital alignment across its cable and rubber businesses, stabilizing cash flow via diversified exposure to four end-markets: infrastructure, energy, mobility and industrial maintenance. Finnish engineering strength and Eurostat 2023 R&D intensity of 3.6% support high-quality manufacturing and tender competitiveness. Long-lived system integration and framework agreements create high switching costs and revenue visibility.
| Metric | Value |
|---|---|
| R&D intensity (Finland, Eurostat 2023) | 3.6% |
| End-markets | 4 |
What is included in the product
Detailed Word Document
Provides a concise SWOT analysis of Reka Industrial, highlighting internal strengths and weaknesses plus external opportunities and threats to assess its competitive position, growth drivers, and strategic risks.
Customizable Excel Spreadsheet
Provides a concise, visual SWOT matrix for Reka Industrial to quickly align strategy, streamline stakeholder communication, and enable fast updates as risks and opportunities evolve.
Weaknesses
Sector concentration in two niches
Exposure is largely confined to cable and rubber markets, leaving Reka Industrial dependent on two niches that together represented the bulk of sales in 2024. A simultaneous downturn in construction, infrastructure or automotive — sectors that drove ~60–70% of demand for these inputs in 2024 regional data — could depress revenues sharply. Limited sector breadth reduces shock absorption and constrains portfolio rebalancing options.
Subscale versus global incumbents
Subscale versus global incumbents leaves Reka Industrial at a procurement and distribution disadvantage: global manufacturers drive procurement economies and vertical integration while global R&D spend topped about $2.0 trillion in 2023, widening innovation gaps. Price competition in commoditized lines can compress margins by double digits, eroding profitability. Limited scale weakens bargaining power with suppliers and key accounts and constrains rapid global market penetration.
Capital intensity and working capital needs
Reka Industrial faces continuous capex demands for machinery, tooling and regulatory compliance, typically representing 5–8% of revenue in cable/rubber peers; copper and elastomer inventories lock capital — LME copper averaged about $9,500/t in 2024 with >20% intra‑year swings — and elevated maintenance capex squeezes free cash flow, constraining ability to fund rapid expansion.
Exposure to cyclical end-markets
Reka Industrial is exposed to cyclical end-markets where construction, utilities capex and transportation cycles drive volumes, making revenue sensitive to project delays and budget cuts that create lumpiness; OEM production swings further propagate through the supply chain and complicate forecasting and capacity planning.
- Construction, utilities, transport sensitivity
- Project delays → revenue lumpiness
- OEM production swings affect supply chain
- Harder forecasting & capacity planning
Key-person and execution risk
Active ownership depends on experienced operators and integration talent; global CEO tenure averaged about 7.2 years in 2023, so leadership churn can stall Reka’s programs. Missteps in M&A or plant modernization can destroy value—roughly 70% of acquisitions and large transformations fail. Governance complexity rises with multiple subsidiaries, increasing oversight and compliance burdens.
- Key-person risk
- Integration talent gap
- 70% M&A/transformation failure rate
- Higher governance complexity with multiple subsidiaries
Cable/rubber exposure 60–70% plus capex and copper risk
Reka’s revenue is concentrated in cable/rubber (≈60–70% end‑market exposure in 2024), raising downside risk from construction/auto cycles; scale gaps versus global peers (global R&D ≈$2.0T in 2023) compress margins. Capex needs (peer 5–8% of revenue) and LME copper ≈$9,500/t in 2024 tie up cash. Leadership/key‑person risk (CEO tenure ~7.2 yrs) and ~70% M&A failure rate heighten execution risk.
| Metric | Value |
|---|---|
| End‑market exposure (2024) | 60–70% |
| Peer capex | 5–8% rev |
| LME copper (2024 avg) | $9,500/t |
| Global R&D (2023) | $2.0T |
| M&A failure rate | ~70% |
What You See Is What You Get
Reka Industrial SWOT Analysis
This is the actual Reka Industrial SWOT analysis document you’ll receive upon purchase—no surprises, just professional quality and structured insights. The preview below is taken directly from the full report and reflects the same editable file available after checkout. Buy now to unlock the complete, detailed version ready for immediate download and use.











