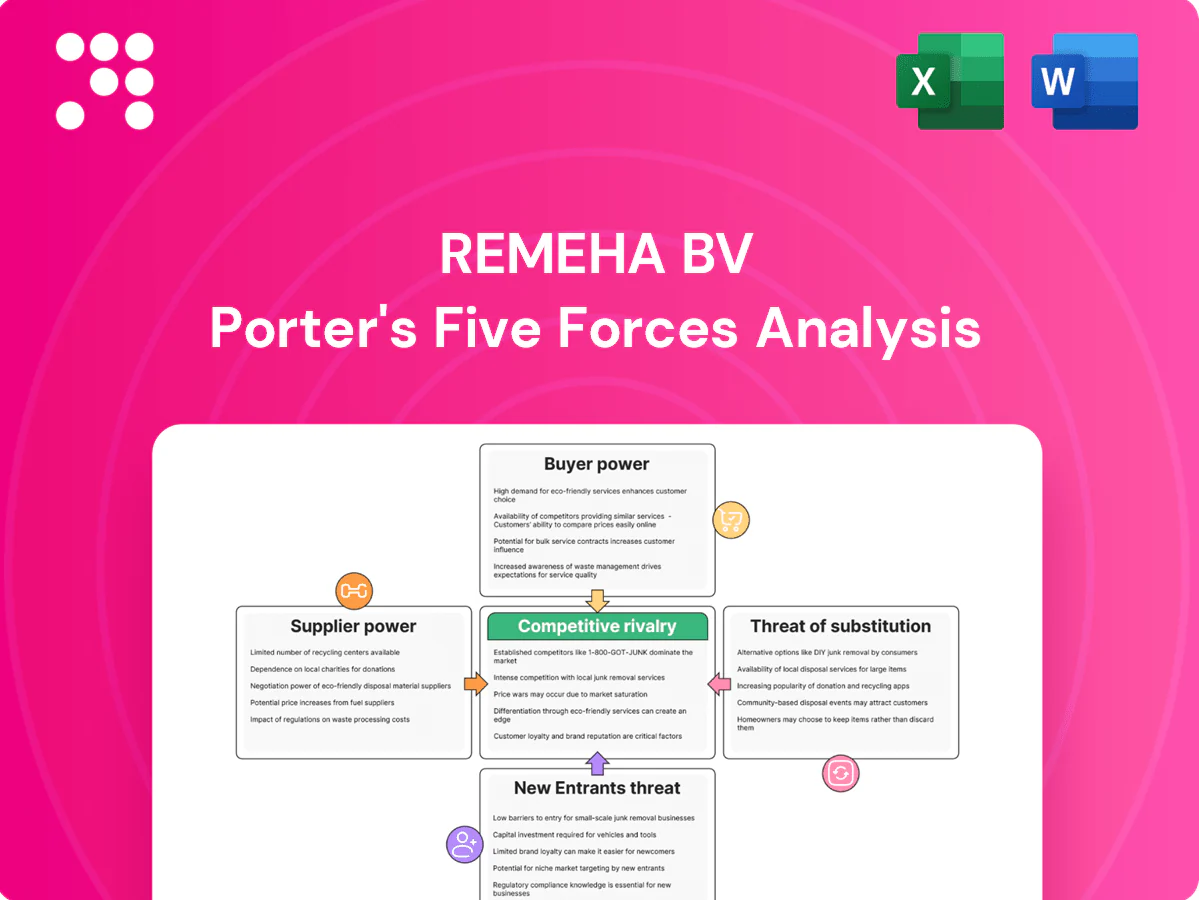
Remeha BV Porter's Five Forces Analysis

From Overview to Strategy Blueprint
Remeha BV faces moderate supplier power due to component specialization, while buyer power is rising as B2B clients seek integrated energy solutions. Competitive rivalry is intense with consolidation and tech-driven differentiation, and substitutes from renewables accelerate market disruption. Regulatory and environmental pressures add strategic risk. This brief snapshot only scratches the surface. Unlock the full Porter's Five Forces Analysis to explore Remeha BV’s competitive dynamics, market pressures, and strategic advantages in detail.
Suppliers Bargaining Power

Specialized components
Core parts like heat exchangers, gas valves and control electronics for Remeha BV are supplied by specialized vendors holding technical IP, creating dependency and supplier leverage. Limited qualified sources and certification/qualification cycles commonly lasting 6–18 months amplify that power. Dual-sourcing and modular designs can mitigate exposure, but certification constraints and long qualification lead times limit rapid switching. Supplier bargaining is therefore structurally strong.
Raw materials volatility
Steel (~€850/t), copper (~$9,500/t), aluminum (~$2,400/t) and rare earths (NdPr oxide ≈ $70/kg in 2024) drove pronounced input-cost swings for Remeha BV, squeezing margins on fixed-price HVAC contracts. Suppliers passed through most input inflation, forcing margin pressure where pass-through clauses were weak. Hedging and multi-year supply agreements softened spot spikes but did not eliminate exposure. Index-linked pricing terms became a central negotiation point.

Compliance-grade inputs
CE marking, ErP (Ecodesign) rules and national safety standards force Remeha to buy certified materials and tested parts, raising entry barriers in 2024. Few vendors hold most approvals, concentrating supplier power and often supplying the majority of compliant components. Any redesign to qualify alternative parts is costly and can take months, while suppliers in 2024 tied priority and lead times to volume commitments.

Logistics and lead times
Long lead items—castings (often >12 weeks in 2024), PCBs (8–14 weeks) and heat‑pump compressors (20–30 weeks)—create scheduling risk and let suppliers allocate volumes in peak seasons, extracting tighter payment and price terms. Buffer stocks and VMI mitigate shortages but tie up working capital; nearshoring lowers lead-time risk yet can increase unit costs by single-digit percentages.
- Scheduling risk: long leads
- Allocation power in peaks
- VMI/buffers = working capital
- Nearshoring reduces risk, raises unit cost
Co-development lock-in
Joint R&D for high-efficiency boilers and hybrid systems embeds supplier-specific designs, raising switching costs via tooling, firmware and certification rework; in 2024 this deep integration improved unit performance but tilted bargaining power toward key partners. Contractual IP ownership and second-source clauses partially rebalance supplier leverage.
- Co-development lock-in: higher switching costs, supplier leverage
- Mitigants: IP clauses, second-source requirements
Certification cycles, long leads and raw-material shocks boost supplier leverage over OEMs
Specialized suppliers hold technical IP and certifications, creating structural leverage for Remeha BV; certification cycles (6–18 months) and long leads (castings >12w, PCBs 8–14w, compressors 20–30w) limit switching. Input-price shocks (steel €850/t, copper $9,500/t, Al €2,400/t, NdPr ≈ $70/kg in 2024) squeezed margins; hedging and long-term contracts mitigate but do not remove supplier power.
| Factor | 2024 Data |
|---|---|
| Certification lead | 6–18 months |
| Long leads | Castings >12w; PCBs 8–14w; Compressors 20–30w |
| Key material prices | Steel €850/t; Cu $9,500/t; Al €2,400/t; NdPr ≈ $70/kg |
What is included in the product
 Detailed Word Document
Tailored Porter's Five Forces analysis for Remeha BV, uncovering competitive drivers, supplier and buyer power, and barriers that shape its profitability. Identifies disruptive substitutes, emerging entrants, and market dynamics with strategic commentary—fully editable for incorporation into reports, investor decks, or internal strategy documents.

 Customizable Excel Spreadsheet
Clear one-sheet Porter's Five Forces for Remeha BV—quickly pinpoint competitive pressures and relieve strategic uncertainty with an editable radar chart and simple layout ready for slides.
Customers Bargaining Power

Consolidated channels
Large distributors, utilities and EPCs consolidate buying power—top buyers can represent over 40% of channel volume in European heating markets (2024), enabling aggressive negotiation. Framework agreements in 2024 commonly enforce price concessions and service KPIs, often compressing margins by 5–12%. Their control of installer access amplifies leverage, and losing a major account can reduce factory utilization by an estimated 10–20%, materially impacting cash flow.
Tender-driven projects
Commercial and industrial buyers run competitive tenders with strict specs, pushing suppliers to match published performance benchmarks and certifications; comparable performance data intensifies price competition. EU buildings account for roughly 40% of final energy consumption, so tenders increasingly weight total cost of ownership and demonstrated energy savings. Value-added services and lifecycle guarantees become decisive differentiators in award decisions.

Installer influence
Installers shape Remeha brand choice through familiarity, factory training programs and certified-installers networks, steering end-customer decisions and specification at point of installation. They demand robust after-sales support and rapid spare-parts availability, making service responsiveness a purchase determinant. Rebates and loyalty programs lower switching but compress installer margins and price elasticity. Technical helplines and digital diagnostic tools measurably reduce churn risk by improving first-time fixes.

Price transparency
Online catalogs and configurators make Remeha BV product pricing and feature sets immediately comparable; a 2024 industry survey found 68% of commercial heating buyers used online tools to shortlist suppliers, accelerating cross-brand benchmarking. Transparent subsidies and payback calculators raised upfront cost sensitivity, forcing differentiation toward efficiency, extended warranty and lifecycle service offerings.
- Benchmarking: faster cross-brand comparison
- Cost focus: payback calculators increase price elasticity
- Differentiation: efficiency, warranty, lifecycle service
Installed-base switching
Installed-base switching is moderated by legacy flue layouts and control integrations that create retrofit complexity and cost, though boilers reaching end-of-life reopen competition during replacement cycles. Compatibility kits and adoption of open protocols (Modbus, BACnet) help Remeha retain customers by lowering integration barriers. A strong service network and long service histories materially reduce buyer propensity to switch.
- Installed-base lock-in
- Retrofit opportunity at end-of-life
- Compatibility kits & open protocols
- Service history lowers churn
Distributor concentration >40% and 68% online shortlisting drive 5-12% margin squeeze
Large distributors and utilities (>40% of channel volume in European heating, 2024) exert strong price leverage; framework agreements in 2024 compressed supplier margins by ~5–12% and losing a major account can cut factory utilization ~10–20%. Online shortlisting (68% of commercial buyers, 2024) accelerates benchmarking, raising price elasticity and making efficiency, warranties and lifecycle services decisive.
| Metric | 2024 value | Impact |
|---|---|---|
| Top-buyer share | >40% | High negotiation power |
| Margin squeeze | 5–12% | Profit pressure |
| Online shortlist | 68% | Faster benchmarking |
| Utilization hit | 10–20% | Cashflow risk |
Same Document Delivered
Remeha BV Porter's Five Forces Analysis
This preview shows the exact Remeha BV Porter's Five Forces Analysis you'll receive immediately after purchase; no placeholders or mockups. The file is the full, professionally formatted analysis ready for download and use the moment you buy. What you see is the complete deliverable—accurate, final and instant-access.

From Overview to Strategy Blueprint
Remeha BV faces moderate supplier power due to component specialization, while buyer power is rising as B2B clients seek integrated energy solutions. Competitive rivalry is intense with consolidation and tech-driven differentiation, and substitutes from renewables accelerate market disruption. Regulatory and environmental pressures add strategic risk. This brief snapshot only scratches the surface. Unlock the full Porter's Five Forces Analysis to explore Remeha BV’s competitive dynamics, market pressures, and strategic advantages in detail.
Suppliers Bargaining Power
Specialized components
Core parts like heat exchangers, gas valves and control electronics for Remeha BV are supplied by specialized vendors holding technical IP, creating dependency and supplier leverage. Limited qualified sources and certification/qualification cycles commonly lasting 6–18 months amplify that power. Dual-sourcing and modular designs can mitigate exposure, but certification constraints and long qualification lead times limit rapid switching. Supplier bargaining is therefore structurally strong.
Raw materials volatility
Steel (~€850/t), copper (~$9,500/t), aluminum (~$2,400/t) and rare earths (NdPr oxide ≈ $70/kg in 2024) drove pronounced input-cost swings for Remeha BV, squeezing margins on fixed-price HVAC contracts. Suppliers passed through most input inflation, forcing margin pressure where pass-through clauses were weak. Hedging and multi-year supply agreements softened spot spikes but did not eliminate exposure. Index-linked pricing terms became a central negotiation point.
Compliance-grade inputs
CE marking, ErP (Ecodesign) rules and national safety standards force Remeha to buy certified materials and tested parts, raising entry barriers in 2024. Few vendors hold most approvals, concentrating supplier power and often supplying the majority of compliant components. Any redesign to qualify alternative parts is costly and can take months, while suppliers in 2024 tied priority and lead times to volume commitments.
Logistics and lead times
Long lead items—castings (often >12 weeks in 2024), PCBs (8–14 weeks) and heat‑pump compressors (20–30 weeks)—create scheduling risk and let suppliers allocate volumes in peak seasons, extracting tighter payment and price terms. Buffer stocks and VMI mitigate shortages but tie up working capital; nearshoring lowers lead-time risk yet can increase unit costs by single-digit percentages.
- Scheduling risk: long leads
- Allocation power in peaks
- VMI/buffers = working capital
- Nearshoring reduces risk, raises unit cost
Co-development lock-in
Joint R&D for high-efficiency boilers and hybrid systems embeds supplier-specific designs, raising switching costs via tooling, firmware and certification rework; in 2024 this deep integration improved unit performance but tilted bargaining power toward key partners. Contractual IP ownership and second-source clauses partially rebalance supplier leverage.
- Co-development lock-in: higher switching costs, supplier leverage
- Mitigants: IP clauses, second-source requirements
Certification cycles, long leads and raw-material shocks boost supplier leverage over OEMs
Specialized suppliers hold technical IP and certifications, creating structural leverage for Remeha BV; certification cycles (6–18 months) and long leads (castings >12w, PCBs 8–14w, compressors 20–30w) limit switching. Input-price shocks (steel €850/t, copper $9,500/t, Al €2,400/t, NdPr ≈ $70/kg in 2024) squeezed margins; hedging and long-term contracts mitigate but do not remove supplier power.
| Factor | 2024 Data |
|---|---|
| Certification lead | 6–18 months |
| Long leads | Castings >12w; PCBs 8–14w; Compressors 20–30w |
| Key material prices | Steel €850/t; Cu $9,500/t; Al €2,400/t; NdPr ≈ $70/kg |
What is included in the product
Detailed Word Document
Tailored Porter's Five Forces analysis for Remeha BV, uncovering competitive drivers, supplier and buyer power, and barriers that shape its profitability. Identifies disruptive substitutes, emerging entrants, and market dynamics with strategic commentary—fully editable for incorporation into reports, investor decks, or internal strategy documents.
Customizable Excel Spreadsheet
Clear one-sheet Porter's Five Forces for Remeha BV—quickly pinpoint competitive pressures and relieve strategic uncertainty with an editable radar chart and simple layout ready for slides.
Customers Bargaining Power
Consolidated channels
Large distributors, utilities and EPCs consolidate buying power—top buyers can represent over 40% of channel volume in European heating markets (2024), enabling aggressive negotiation. Framework agreements in 2024 commonly enforce price concessions and service KPIs, often compressing margins by 5–12%. Their control of installer access amplifies leverage, and losing a major account can reduce factory utilization by an estimated 10–20%, materially impacting cash flow.
Tender-driven projects
Commercial and industrial buyers run competitive tenders with strict specs, pushing suppliers to match published performance benchmarks and certifications; comparable performance data intensifies price competition. EU buildings account for roughly 40% of final energy consumption, so tenders increasingly weight total cost of ownership and demonstrated energy savings. Value-added services and lifecycle guarantees become decisive differentiators in award decisions.
Installer influence
Installers shape Remeha brand choice through familiarity, factory training programs and certified-installers networks, steering end-customer decisions and specification at point of installation. They demand robust after-sales support and rapid spare-parts availability, making service responsiveness a purchase determinant. Rebates and loyalty programs lower switching but compress installer margins and price elasticity. Technical helplines and digital diagnostic tools measurably reduce churn risk by improving first-time fixes.
Price transparency
Online catalogs and configurators make Remeha BV product pricing and feature sets immediately comparable; a 2024 industry survey found 68% of commercial heating buyers used online tools to shortlist suppliers, accelerating cross-brand benchmarking. Transparent subsidies and payback calculators raised upfront cost sensitivity, forcing differentiation toward efficiency, extended warranty and lifecycle service offerings.
- Benchmarking: faster cross-brand comparison
- Cost focus: payback calculators increase price elasticity
- Differentiation: efficiency, warranty, lifecycle service
Installed-base switching
Installed-base switching is moderated by legacy flue layouts and control integrations that create retrofit complexity and cost, though boilers reaching end-of-life reopen competition during replacement cycles. Compatibility kits and adoption of open protocols (Modbus, BACnet) help Remeha retain customers by lowering integration barriers. A strong service network and long service histories materially reduce buyer propensity to switch.
- Installed-base lock-in
- Retrofit opportunity at end-of-life
- Compatibility kits & open protocols
- Service history lowers churn
Distributor concentration >40% and 68% online shortlisting drive 5-12% margin squeeze
Large distributors and utilities (>40% of channel volume in European heating, 2024) exert strong price leverage; framework agreements in 2024 compressed supplier margins by ~5–12% and losing a major account can cut factory utilization ~10–20%. Online shortlisting (68% of commercial buyers, 2024) accelerates benchmarking, raising price elasticity and making efficiency, warranties and lifecycle services decisive.
| Metric | 2024 value | Impact |
|---|---|---|
| Top-buyer share | >40% | High negotiation power |
| Margin squeeze | 5–12% | Profit pressure |
| Online shortlist | 68% | Faster benchmarking |
| Utilization hit | 10–20% | Cashflow risk |
Same Document Delivered
Remeha BV Porter's Five Forces Analysis
This preview shows the exact Remeha BV Porter's Five Forces Analysis you'll receive immediately after purchase; no placeholders or mockups. The file is the full, professionally formatted analysis ready for download and use the moment you buy. What you see is the complete deliverable—accurate, final and instant-access.
Original: $10.00
-65%$10.00
$3.50Description
From Overview to Strategy Blueprint
Remeha BV faces moderate supplier power due to component specialization, while buyer power is rising as B2B clients seek integrated energy solutions. Competitive rivalry is intense with consolidation and tech-driven differentiation, and substitutes from renewables accelerate market disruption. Regulatory and environmental pressures add strategic risk. This brief snapshot only scratches the surface. Unlock the full Porter's Five Forces Analysis to explore Remeha BV’s competitive dynamics, market pressures, and strategic advantages in detail.
Suppliers Bargaining Power
Specialized components
Core parts like heat exchangers, gas valves and control electronics for Remeha BV are supplied by specialized vendors holding technical IP, creating dependency and supplier leverage. Limited qualified sources and certification/qualification cycles commonly lasting 6–18 months amplify that power. Dual-sourcing and modular designs can mitigate exposure, but certification constraints and long qualification lead times limit rapid switching. Supplier bargaining is therefore structurally strong.
Raw materials volatility
Steel (~€850/t), copper (~$9,500/t), aluminum (~$2,400/t) and rare earths (NdPr oxide ≈ $70/kg in 2024) drove pronounced input-cost swings for Remeha BV, squeezing margins on fixed-price HVAC contracts. Suppliers passed through most input inflation, forcing margin pressure where pass-through clauses were weak. Hedging and multi-year supply agreements softened spot spikes but did not eliminate exposure. Index-linked pricing terms became a central negotiation point.
Compliance-grade inputs
CE marking, ErP (Ecodesign) rules and national safety standards force Remeha to buy certified materials and tested parts, raising entry barriers in 2024. Few vendors hold most approvals, concentrating supplier power and often supplying the majority of compliant components. Any redesign to qualify alternative parts is costly and can take months, while suppliers in 2024 tied priority and lead times to volume commitments.
Logistics and lead times
Long lead items—castings (often >12 weeks in 2024), PCBs (8–14 weeks) and heat‑pump compressors (20–30 weeks)—create scheduling risk and let suppliers allocate volumes in peak seasons, extracting tighter payment and price terms. Buffer stocks and VMI mitigate shortages but tie up working capital; nearshoring lowers lead-time risk yet can increase unit costs by single-digit percentages.
- Scheduling risk: long leads
- Allocation power in peaks
- VMI/buffers = working capital
- Nearshoring reduces risk, raises unit cost
Co-development lock-in
Joint R&D for high-efficiency boilers and hybrid systems embeds supplier-specific designs, raising switching costs via tooling, firmware and certification rework; in 2024 this deep integration improved unit performance but tilted bargaining power toward key partners. Contractual IP ownership and second-source clauses partially rebalance supplier leverage.
- Co-development lock-in: higher switching costs, supplier leverage
- Mitigants: IP clauses, second-source requirements
Certification cycles, long leads and raw-material shocks boost supplier leverage over OEMs
Specialized suppliers hold technical IP and certifications, creating structural leverage for Remeha BV; certification cycles (6–18 months) and long leads (castings >12w, PCBs 8–14w, compressors 20–30w) limit switching. Input-price shocks (steel €850/t, copper $9,500/t, Al €2,400/t, NdPr ≈ $70/kg in 2024) squeezed margins; hedging and long-term contracts mitigate but do not remove supplier power.
| Factor | 2024 Data |
|---|---|
| Certification lead | 6–18 months |
| Long leads | Castings >12w; PCBs 8–14w; Compressors 20–30w |
| Key material prices | Steel €850/t; Cu $9,500/t; Al €2,400/t; NdPr ≈ $70/kg |
What is included in the product
Detailed Word Document
Tailored Porter's Five Forces analysis for Remeha BV, uncovering competitive drivers, supplier and buyer power, and barriers that shape its profitability. Identifies disruptive substitutes, emerging entrants, and market dynamics with strategic commentary—fully editable for incorporation into reports, investor decks, or internal strategy documents.
Customizable Excel Spreadsheet
Clear one-sheet Porter's Five Forces for Remeha BV—quickly pinpoint competitive pressures and relieve strategic uncertainty with an editable radar chart and simple layout ready for slides.
Customers Bargaining Power
Consolidated channels
Large distributors, utilities and EPCs consolidate buying power—top buyers can represent over 40% of channel volume in European heating markets (2024), enabling aggressive negotiation. Framework agreements in 2024 commonly enforce price concessions and service KPIs, often compressing margins by 5–12%. Their control of installer access amplifies leverage, and losing a major account can reduce factory utilization by an estimated 10–20%, materially impacting cash flow.
Tender-driven projects
Commercial and industrial buyers run competitive tenders with strict specs, pushing suppliers to match published performance benchmarks and certifications; comparable performance data intensifies price competition. EU buildings account for roughly 40% of final energy consumption, so tenders increasingly weight total cost of ownership and demonstrated energy savings. Value-added services and lifecycle guarantees become decisive differentiators in award decisions.
Installer influence
Installers shape Remeha brand choice through familiarity, factory training programs and certified-installers networks, steering end-customer decisions and specification at point of installation. They demand robust after-sales support and rapid spare-parts availability, making service responsiveness a purchase determinant. Rebates and loyalty programs lower switching but compress installer margins and price elasticity. Technical helplines and digital diagnostic tools measurably reduce churn risk by improving first-time fixes.
Price transparency
Online catalogs and configurators make Remeha BV product pricing and feature sets immediately comparable; a 2024 industry survey found 68% of commercial heating buyers used online tools to shortlist suppliers, accelerating cross-brand benchmarking. Transparent subsidies and payback calculators raised upfront cost sensitivity, forcing differentiation toward efficiency, extended warranty and lifecycle service offerings.
- Benchmarking: faster cross-brand comparison
- Cost focus: payback calculators increase price elasticity
- Differentiation: efficiency, warranty, lifecycle service
Installed-base switching
Installed-base switching is moderated by legacy flue layouts and control integrations that create retrofit complexity and cost, though boilers reaching end-of-life reopen competition during replacement cycles. Compatibility kits and adoption of open protocols (Modbus, BACnet) help Remeha retain customers by lowering integration barriers. A strong service network and long service histories materially reduce buyer propensity to switch.
- Installed-base lock-in
- Retrofit opportunity at end-of-life
- Compatibility kits & open protocols
- Service history lowers churn
Distributor concentration >40% and 68% online shortlisting drive 5-12% margin squeeze
Large distributors and utilities (>40% of channel volume in European heating, 2024) exert strong price leverage; framework agreements in 2024 compressed supplier margins by ~5–12% and losing a major account can cut factory utilization ~10–20%. Online shortlisting (68% of commercial buyers, 2024) accelerates benchmarking, raising price elasticity and making efficiency, warranties and lifecycle services decisive.
| Metric | 2024 value | Impact |
|---|---|---|
| Top-buyer share | >40% | High negotiation power |
| Margin squeeze | 5–12% | Profit pressure |
| Online shortlist | 68% | Faster benchmarking |
| Utilization hit | 10–20% | Cashflow risk |
Same Document Delivered
Remeha BV Porter's Five Forces Analysis
This preview shows the exact Remeha BV Porter's Five Forces Analysis you'll receive immediately after purchase; no placeholders or mockups. The file is the full, professionally formatted analysis ready for download and use the moment you buy. What you see is the complete deliverable—accurate, final and instant-access.











