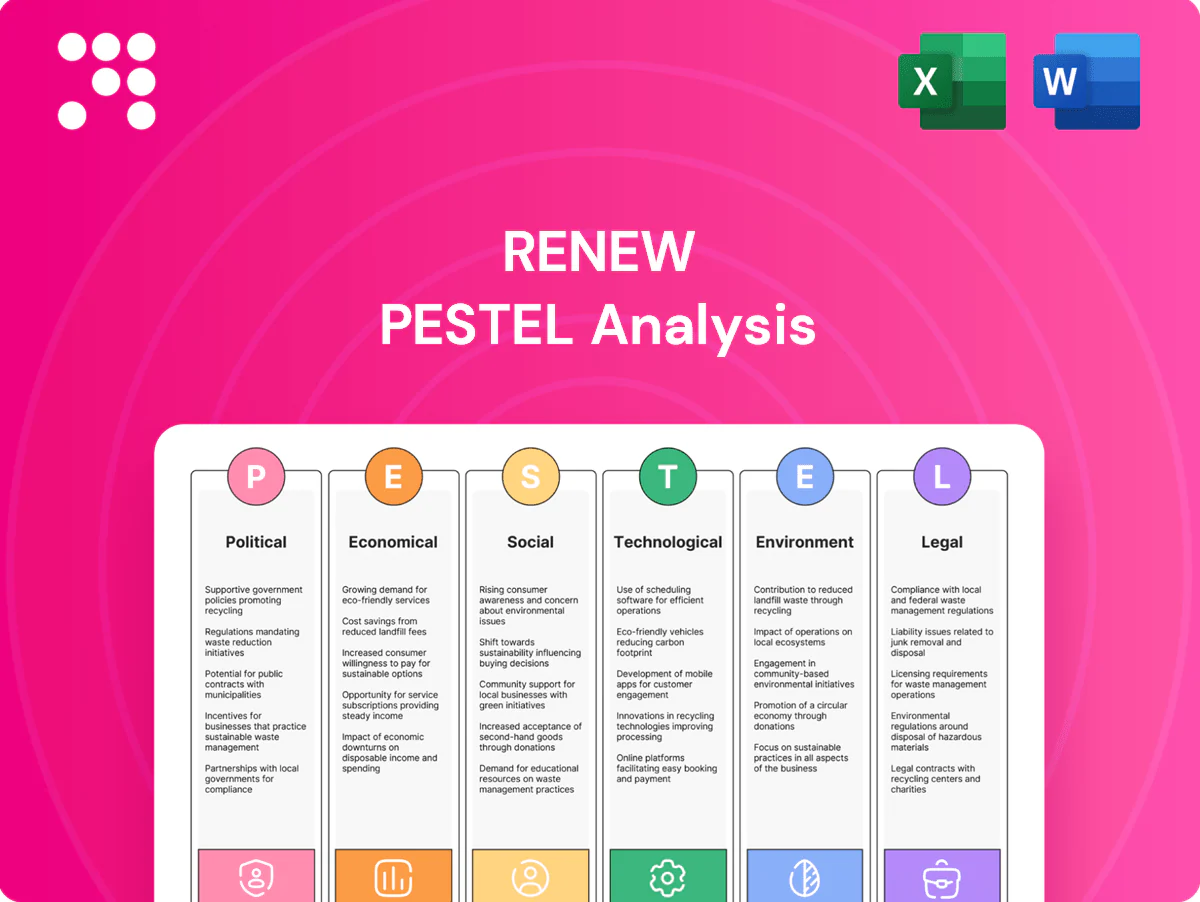
Renew PESTLE Analysis

Your Shortcut to Market Insight Starts Here
Unlock strategic clarity with our PESTLE Analysis of Renew—three to five sentence insights revealing how political, economic, social, technological, legal, and environmental forces shape its future. Use these findings to refine forecasts and de-risk decisions. Purchase the full report to access deep dives, data tables, and actionable recommendations instantly.
Political factors

UK infrastructure policy and public spending priorities
Pipeline visibility depends on the UK National Infrastructure Strategy, which aims to unlock up to 600 billion pounds of investment over the coming decade, and on sector cycles such as water AMP7 (2020–25) and AMP8 (2025–30) plus rail/road multi-year settlement rounds. Shifts in Treasury spending rules or departmental budgets can accelerate or defer projects, so Renew must align bidding and capacity planning to multi-year settlements and engage policymakers to anticipate allocation changes.
Regulatory direction for utilities (Ofwat, Ofgem, Environment Agency)
Ofwat PR24 (2025–30), Ofgem RIIO‑ED2/TPCR frameworks (noting RIIO periods 2023–28) and Environment Agency enforcement determinations shape capex plans, allowable returns and service obligations, directly driving workload volume and margin. Tighter targets on leakage, resilience and reliability expand scopes and subcontracting needs. Tougher efficiency tests increase pricing pressure. Demonstrable compliance and value creation improve chances of framework retention.

Devolution and local authority procurement agendas
Ten metro mayors and devolved administrations set regional transport, housing and environmental priorities across England and the UK, shaping local agendas. UK public procurement is around £300bn annually, with social value and local content often weighted 10–20% in award criteria. Renew should tailor propositions to regional strategies and demonstrable community benefits. Strong regional relationships reduce planning friction and speed delivery.

Energy security and geopolitical drivers
Security-of-supply policies drive grid reinforcement, interconnections and distributed energy integration, and geopolitical tensions reprioritize domestic infrastructure resilience; US IRA directs about $369 billion to clean energy and the EU REPowerEU estimates ~€300 billion mobilization, potentially unlocking capital for Renew where it operates. Flexibility to mobilize quickly is a clear competitive edge.
- Policy-driven funding: IRA $369bn, REPowerEU ~€300bn
- Priority shift: resilience over cost-efficiency
- Opportunity: capital for critical assets
- Advantage: rapid mobilization
Net-zero and national climate commitments
Government net-zero targets (137 countries covering ~88% of emissions in 2024) underpin public funding for renewables connections, EV charging and low-carbon construction; US IRA (~$369bn) and EU packages have mobilised large incentives. Policy stability enables long-term project finance; reversals stall pipelines. Emissions-aligned bids and tighter reporting (CSRD ~50,000 firms) strengthen procurement.
- Targets drive funding
- Policy stability = finance certainty
- Align with emissions cuts to win bids
- Carbon reporting under growing scrutiny
£600bn UK pipeline, £300bn/yr procurement, IRA $369bn & REPowerEU €300bn
Pipeline visibility tied to UK National Infrastructure Strategy (up to 600 billion pounds) and multi‑year settlements; regulators (Ofwat PR24, Ofgem RIIO) directly affect capex, returns and margins. Regional procurement ~300bn pounds/yr with 10–20% social value weighting. Net‑zero policies (137 countries ≈88% emissions) plus IRA $369bn and REPowerEU ~€300bn mobilize capital.
| Factor | Key data | Implication |
|---|---|---|
| Infrastructure | £600bn | Long pipeline |
| Procurement | £300bn/yr; 10–20% social value | Win via local value |
| Climate finance | IRA $369bn; REPowerEU €300bn | Capital access |
What is included in the product
 Detailed Word Document
Analyzes how macro-environmental forces shape Renew across Political, Economic, Social, Technological, Environmental, and Legal dimensions, with data-driven insights and region/industry specificity. Designed for executives and investors, it highlights risks, opportunities, and forward-looking scenarios ready for inclusion in plans and decks.

 Customizable Excel Spreadsheet
Compact, visually segmented PESTLE summaries that are easy to drop into presentations or planning sessions, editable for region- or business-specific notes and optimized for quick team alignment; uses clear language to support risk discussions and strategic decisions.
Economic factors

Interest rates and cost of capital
Higher policy rates (central banks pushed rates into the c.4.5–5.5% range in 2024–25) raise financing costs for clients and can delay discretionary capex; regulated utilities’ allowed returns often track 10-year yields (around 4.0–4.5% in 2024–25), affecting project pacing. Renew must manage working capital and pricing to reflect financing conditions; cash discipline and a diverse financing framework mitigate cycle risk.
Inflation in labor and materials
Input cost volatility erodes margins when contracts lack indexation; global inflation eased to about 3.2% in 2024 (World Bank) even as steel HRC prices fell roughly 30% from 2022 peaks to 2024, creating sharp swings in material spend. NEC options, clear escalation clauses and commodity hedging protect profitability. Closer supply-chain collaboration cuts waste and rework, while rigorous cost tracking enables timely variations and claims.

Macroeconomic growth and fiscal constraints
Slower global GDP growth (~3.0% in 2024) has tightened public budgets, though countercyclical infrastructure programmes in 2024–25 raised capex in several markets and partially offset cuts. Fiscal tightening and deficit reduction targets have reprioritised timelines, even for essential works, with many advanced-economy deficits still near 4–7% of GDP in 2024. Renew’s focus on non-discretionary maintenance offers resilience, and balanced sector exposure smooths demand swings.

Skilled labor availability and wage pressure
Shortages of engineers and specialist trades are driving wage inflation and delivery risk; 74% of UK construction firms reported skills gaps in 2024, pushing wage growth in some regions above 8% year-on-year. Apprenticeships and in-house training secure capacity, productivity tools and modular methods offset costs, and partnering with local talent pipelines strengthens bid commitments.
- Tag: Skills shortage — 74% firms affected (2024)
- Tag: Wage pressure — regional wage growth >8% YoY
- Tag: Capacity — apprenticeships & in-house training
- Tag: Efficiency — productivity tools & modular build
Supply chain stability and contractor consolidation
Failures among subcontractors can disrupt delivery and raise project costs; in 2024 surveys ~38% of contractors reported at least one subcontractor-caused delay, pushing contingency spend up to 5–8% on affected projects.
Prequalification, continuous financial monitoring and multi-sourcing cut dependency and failure risk, while strategic partnerships secure availability of critical items (e.g., long-lead components) and volume discounts.
Prompt payment practices sustain supplier health—timely payments reduced supplier insolvency risk in several 2024 studies and improve on-time delivery metrics.
- Risk: subcontractor-caused delays ~38%
- Cost impact: contingencies +5–8% on hit projects
- Mitigants: prequal, financial monitoring, multi-sourcing
- Benefits: strategic partnerships, prompt payment
£600bn UK pipeline, £300bn/yr procurement, IRA $369bn & REPowerEU €300bn
Higher policy rates (c.4.5–5.5% in 2024–25) and 10y yields (~4.0–4.5%) raise financing costs; inflation eased to ~3.2% (2024) while HRC steel fell ~30% from 2022–24. Global GDP ~3.0% (2024) tightens public budgets; skills gaps (74% UK firms, 2024) and subcontractor delays (~38%) push contingencies +5–8%.
| Metric | Value (2024) |
|---|---|
| Policy rates | 4.5–5.5% |
| 10y yield | 4.0–4.5% |
| Inflation | 3.2% |
| HRC steel | -30% |
| GDP growth | ~3.0% |
| Skills gap | 74% |
| Subcontractor delays | 38% |
| Contingency impact | +5–8% |
Full Version Awaits
Renew PESTLE Analysis
The Renew PESTLE Analysis preview shown here is the exact document you’ll receive after purchase—fully formatted, professionally structured and ready to use. No placeholders or teasers; the content and layout are identical to the downloadable file.

Your Shortcut to Market Insight Starts Here
Unlock strategic clarity with our PESTLE Analysis of Renew—three to five sentence insights revealing how political, economic, social, technological, legal, and environmental forces shape its future. Use these findings to refine forecasts and de-risk decisions. Purchase the full report to access deep dives, data tables, and actionable recommendations instantly.
Political factors
UK infrastructure policy and public spending priorities
Pipeline visibility depends on the UK National Infrastructure Strategy, which aims to unlock up to 600 billion pounds of investment over the coming decade, and on sector cycles such as water AMP7 (2020–25) and AMP8 (2025–30) plus rail/road multi-year settlement rounds. Shifts in Treasury spending rules or departmental budgets can accelerate or defer projects, so Renew must align bidding and capacity planning to multi-year settlements and engage policymakers to anticipate allocation changes.
Regulatory direction for utilities (Ofwat, Ofgem, Environment Agency)
Ofwat PR24 (2025–30), Ofgem RIIO‑ED2/TPCR frameworks (noting RIIO periods 2023–28) and Environment Agency enforcement determinations shape capex plans, allowable returns and service obligations, directly driving workload volume and margin. Tighter targets on leakage, resilience and reliability expand scopes and subcontracting needs. Tougher efficiency tests increase pricing pressure. Demonstrable compliance and value creation improve chances of framework retention.
Devolution and local authority procurement agendas
Ten metro mayors and devolved administrations set regional transport, housing and environmental priorities across England and the UK, shaping local agendas. UK public procurement is around £300bn annually, with social value and local content often weighted 10–20% in award criteria. Renew should tailor propositions to regional strategies and demonstrable community benefits. Strong regional relationships reduce planning friction and speed delivery.
Energy security and geopolitical drivers
Security-of-supply policies drive grid reinforcement, interconnections and distributed energy integration, and geopolitical tensions reprioritize domestic infrastructure resilience; US IRA directs about $369 billion to clean energy and the EU REPowerEU estimates ~€300 billion mobilization, potentially unlocking capital for Renew where it operates. Flexibility to mobilize quickly is a clear competitive edge.
- Policy-driven funding: IRA $369bn, REPowerEU ~€300bn
- Priority shift: resilience over cost-efficiency
- Opportunity: capital for critical assets
- Advantage: rapid mobilization
Net-zero and national climate commitments
Government net-zero targets (137 countries covering ~88% of emissions in 2024) underpin public funding for renewables connections, EV charging and low-carbon construction; US IRA (~$369bn) and EU packages have mobilised large incentives. Policy stability enables long-term project finance; reversals stall pipelines. Emissions-aligned bids and tighter reporting (CSRD ~50,000 firms) strengthen procurement.
- Targets drive funding
- Policy stability = finance certainty
- Align with emissions cuts to win bids
- Carbon reporting under growing scrutiny
£600bn UK pipeline, £300bn/yr procurement, IRA $369bn & REPowerEU €300bn
Pipeline visibility tied to UK National Infrastructure Strategy (up to 600 billion pounds) and multi‑year settlements; regulators (Ofwat PR24, Ofgem RIIO) directly affect capex, returns and margins. Regional procurement ~300bn pounds/yr with 10–20% social value weighting. Net‑zero policies (137 countries ≈88% emissions) plus IRA $369bn and REPowerEU ~€300bn mobilize capital.
| Factor | Key data | Implication |
|---|---|---|
| Infrastructure | £600bn | Long pipeline |
| Procurement | £300bn/yr; 10–20% social value | Win via local value |
| Climate finance | IRA $369bn; REPowerEU €300bn | Capital access |
What is included in the product
Detailed Word Document
Analyzes how macro-environmental forces shape Renew across Political, Economic, Social, Technological, Environmental, and Legal dimensions, with data-driven insights and region/industry specificity. Designed for executives and investors, it highlights risks, opportunities, and forward-looking scenarios ready for inclusion in plans and decks.
Customizable Excel Spreadsheet
Compact, visually segmented PESTLE summaries that are easy to drop into presentations or planning sessions, editable for region- or business-specific notes and optimized for quick team alignment; uses clear language to support risk discussions and strategic decisions.
Economic factors
Interest rates and cost of capital
Higher policy rates (central banks pushed rates into the c.4.5–5.5% range in 2024–25) raise financing costs for clients and can delay discretionary capex; regulated utilities’ allowed returns often track 10-year yields (around 4.0–4.5% in 2024–25), affecting project pacing. Renew must manage working capital and pricing to reflect financing conditions; cash discipline and a diverse financing framework mitigate cycle risk.
Inflation in labor and materials
Input cost volatility erodes margins when contracts lack indexation; global inflation eased to about 3.2% in 2024 (World Bank) even as steel HRC prices fell roughly 30% from 2022 peaks to 2024, creating sharp swings in material spend. NEC options, clear escalation clauses and commodity hedging protect profitability. Closer supply-chain collaboration cuts waste and rework, while rigorous cost tracking enables timely variations and claims.
Macroeconomic growth and fiscal constraints
Slower global GDP growth (~3.0% in 2024) has tightened public budgets, though countercyclical infrastructure programmes in 2024–25 raised capex in several markets and partially offset cuts. Fiscal tightening and deficit reduction targets have reprioritised timelines, even for essential works, with many advanced-economy deficits still near 4–7% of GDP in 2024. Renew’s focus on non-discretionary maintenance offers resilience, and balanced sector exposure smooths demand swings.
Skilled labor availability and wage pressure
Shortages of engineers and specialist trades are driving wage inflation and delivery risk; 74% of UK construction firms reported skills gaps in 2024, pushing wage growth in some regions above 8% year-on-year. Apprenticeships and in-house training secure capacity, productivity tools and modular methods offset costs, and partnering with local talent pipelines strengthens bid commitments.
- Tag: Skills shortage — 74% firms affected (2024)
- Tag: Wage pressure — regional wage growth >8% YoY
- Tag: Capacity — apprenticeships & in-house training
- Tag: Efficiency — productivity tools & modular build
Supply chain stability and contractor consolidation
Failures among subcontractors can disrupt delivery and raise project costs; in 2024 surveys ~38% of contractors reported at least one subcontractor-caused delay, pushing contingency spend up to 5–8% on affected projects.
Prequalification, continuous financial monitoring and multi-sourcing cut dependency and failure risk, while strategic partnerships secure availability of critical items (e.g., long-lead components) and volume discounts.
Prompt payment practices sustain supplier health—timely payments reduced supplier insolvency risk in several 2024 studies and improve on-time delivery metrics.
- Risk: subcontractor-caused delays ~38%
- Cost impact: contingencies +5–8% on hit projects
- Mitigants: prequal, financial monitoring, multi-sourcing
- Benefits: strategic partnerships, prompt payment
£600bn UK pipeline, £300bn/yr procurement, IRA $369bn & REPowerEU €300bn
Higher policy rates (c.4.5–5.5% in 2024–25) and 10y yields (~4.0–4.5%) raise financing costs; inflation eased to ~3.2% (2024) while HRC steel fell ~30% from 2022–24. Global GDP ~3.0% (2024) tightens public budgets; skills gaps (74% UK firms, 2024) and subcontractor delays (~38%) push contingencies +5–8%.
| Metric | Value (2024) |
|---|---|
| Policy rates | 4.5–5.5% |
| 10y yield | 4.0–4.5% |
| Inflation | 3.2% |
| HRC steel | -30% |
| GDP growth | ~3.0% |
| Skills gap | 74% |
| Subcontractor delays | 38% |
| Contingency impact | +5–8% |
Full Version Awaits
Renew PESTLE Analysis
The Renew PESTLE Analysis preview shown here is the exact document you’ll receive after purchase—fully formatted, professionally structured and ready to use. No placeholders or teasers; the content and layout are identical to the downloadable file.
Description
Your Shortcut to Market Insight Starts Here
Unlock strategic clarity with our PESTLE Analysis of Renew—three to five sentence insights revealing how political, economic, social, technological, legal, and environmental forces shape its future. Use these findings to refine forecasts and de-risk decisions. Purchase the full report to access deep dives, data tables, and actionable recommendations instantly.
Political factors
UK infrastructure policy and public spending priorities
Pipeline visibility depends on the UK National Infrastructure Strategy, which aims to unlock up to 600 billion pounds of investment over the coming decade, and on sector cycles such as water AMP7 (2020–25) and AMP8 (2025–30) plus rail/road multi-year settlement rounds. Shifts in Treasury spending rules or departmental budgets can accelerate or defer projects, so Renew must align bidding and capacity planning to multi-year settlements and engage policymakers to anticipate allocation changes.
Regulatory direction for utilities (Ofwat, Ofgem, Environment Agency)
Ofwat PR24 (2025–30), Ofgem RIIO‑ED2/TPCR frameworks (noting RIIO periods 2023–28) and Environment Agency enforcement determinations shape capex plans, allowable returns and service obligations, directly driving workload volume and margin. Tighter targets on leakage, resilience and reliability expand scopes and subcontracting needs. Tougher efficiency tests increase pricing pressure. Demonstrable compliance and value creation improve chances of framework retention.
Devolution and local authority procurement agendas
Ten metro mayors and devolved administrations set regional transport, housing and environmental priorities across England and the UK, shaping local agendas. UK public procurement is around £300bn annually, with social value and local content often weighted 10–20% in award criteria. Renew should tailor propositions to regional strategies and demonstrable community benefits. Strong regional relationships reduce planning friction and speed delivery.
Energy security and geopolitical drivers
Security-of-supply policies drive grid reinforcement, interconnections and distributed energy integration, and geopolitical tensions reprioritize domestic infrastructure resilience; US IRA directs about $369 billion to clean energy and the EU REPowerEU estimates ~€300 billion mobilization, potentially unlocking capital for Renew where it operates. Flexibility to mobilize quickly is a clear competitive edge.
- Policy-driven funding: IRA $369bn, REPowerEU ~€300bn
- Priority shift: resilience over cost-efficiency
- Opportunity: capital for critical assets
- Advantage: rapid mobilization
Net-zero and national climate commitments
Government net-zero targets (137 countries covering ~88% of emissions in 2024) underpin public funding for renewables connections, EV charging and low-carbon construction; US IRA (~$369bn) and EU packages have mobilised large incentives. Policy stability enables long-term project finance; reversals stall pipelines. Emissions-aligned bids and tighter reporting (CSRD ~50,000 firms) strengthen procurement.
- Targets drive funding
- Policy stability = finance certainty
- Align with emissions cuts to win bids
- Carbon reporting under growing scrutiny
£600bn UK pipeline, £300bn/yr procurement, IRA $369bn & REPowerEU €300bn
Pipeline visibility tied to UK National Infrastructure Strategy (up to 600 billion pounds) and multi‑year settlements; regulators (Ofwat PR24, Ofgem RIIO) directly affect capex, returns and margins. Regional procurement ~300bn pounds/yr with 10–20% social value weighting. Net‑zero policies (137 countries ≈88% emissions) plus IRA $369bn and REPowerEU ~€300bn mobilize capital.
| Factor | Key data | Implication |
|---|---|---|
| Infrastructure | £600bn | Long pipeline |
| Procurement | £300bn/yr; 10–20% social value | Win via local value |
| Climate finance | IRA $369bn; REPowerEU €300bn | Capital access |
What is included in the product
Detailed Word Document
Analyzes how macro-environmental forces shape Renew across Political, Economic, Social, Technological, Environmental, and Legal dimensions, with data-driven insights and region/industry specificity. Designed for executives and investors, it highlights risks, opportunities, and forward-looking scenarios ready for inclusion in plans and decks.
Customizable Excel Spreadsheet
Compact, visually segmented PESTLE summaries that are easy to drop into presentations or planning sessions, editable for region- or business-specific notes and optimized for quick team alignment; uses clear language to support risk discussions and strategic decisions.
Economic factors
Interest rates and cost of capital
Higher policy rates (central banks pushed rates into the c.4.5–5.5% range in 2024–25) raise financing costs for clients and can delay discretionary capex; regulated utilities’ allowed returns often track 10-year yields (around 4.0–4.5% in 2024–25), affecting project pacing. Renew must manage working capital and pricing to reflect financing conditions; cash discipline and a diverse financing framework mitigate cycle risk.
Inflation in labor and materials
Input cost volatility erodes margins when contracts lack indexation; global inflation eased to about 3.2% in 2024 (World Bank) even as steel HRC prices fell roughly 30% from 2022 peaks to 2024, creating sharp swings in material spend. NEC options, clear escalation clauses and commodity hedging protect profitability. Closer supply-chain collaboration cuts waste and rework, while rigorous cost tracking enables timely variations and claims.
Macroeconomic growth and fiscal constraints
Slower global GDP growth (~3.0% in 2024) has tightened public budgets, though countercyclical infrastructure programmes in 2024–25 raised capex in several markets and partially offset cuts. Fiscal tightening and deficit reduction targets have reprioritised timelines, even for essential works, with many advanced-economy deficits still near 4–7% of GDP in 2024. Renew’s focus on non-discretionary maintenance offers resilience, and balanced sector exposure smooths demand swings.
Skilled labor availability and wage pressure
Shortages of engineers and specialist trades are driving wage inflation and delivery risk; 74% of UK construction firms reported skills gaps in 2024, pushing wage growth in some regions above 8% year-on-year. Apprenticeships and in-house training secure capacity, productivity tools and modular methods offset costs, and partnering with local talent pipelines strengthens bid commitments.
- Tag: Skills shortage — 74% firms affected (2024)
- Tag: Wage pressure — regional wage growth >8% YoY
- Tag: Capacity — apprenticeships & in-house training
- Tag: Efficiency — productivity tools & modular build
Supply chain stability and contractor consolidation
Failures among subcontractors can disrupt delivery and raise project costs; in 2024 surveys ~38% of contractors reported at least one subcontractor-caused delay, pushing contingency spend up to 5–8% on affected projects.
Prequalification, continuous financial monitoring and multi-sourcing cut dependency and failure risk, while strategic partnerships secure availability of critical items (e.g., long-lead components) and volume discounts.
Prompt payment practices sustain supplier health—timely payments reduced supplier insolvency risk in several 2024 studies and improve on-time delivery metrics.
- Risk: subcontractor-caused delays ~38%
- Cost impact: contingencies +5–8% on hit projects
- Mitigants: prequal, financial monitoring, multi-sourcing
- Benefits: strategic partnerships, prompt payment
£600bn UK pipeline, £300bn/yr procurement, IRA $369bn & REPowerEU €300bn
Higher policy rates (c.4.5–5.5% in 2024–25) and 10y yields (~4.0–4.5%) raise financing costs; inflation eased to ~3.2% (2024) while HRC steel fell ~30% from 2022–24. Global GDP ~3.0% (2024) tightens public budgets; skills gaps (74% UK firms, 2024) and subcontractor delays (~38%) push contingencies +5–8%.
| Metric | Value (2024) |
|---|---|
| Policy rates | 4.5–5.5% |
| 10y yield | 4.0–4.5% |
| Inflation | 3.2% |
| HRC steel | -30% |
| GDP growth | ~3.0% |
| Skills gap | 74% |
| Subcontractor delays | 38% |
| Contingency impact | +5–8% |
Full Version Awaits
Renew PESTLE Analysis
The Renew PESTLE Analysis preview shown here is the exact document you’ll receive after purchase—fully formatted, professionally structured and ready to use. No placeholders or teasers; the content and layout are identical to the downloadable file.











