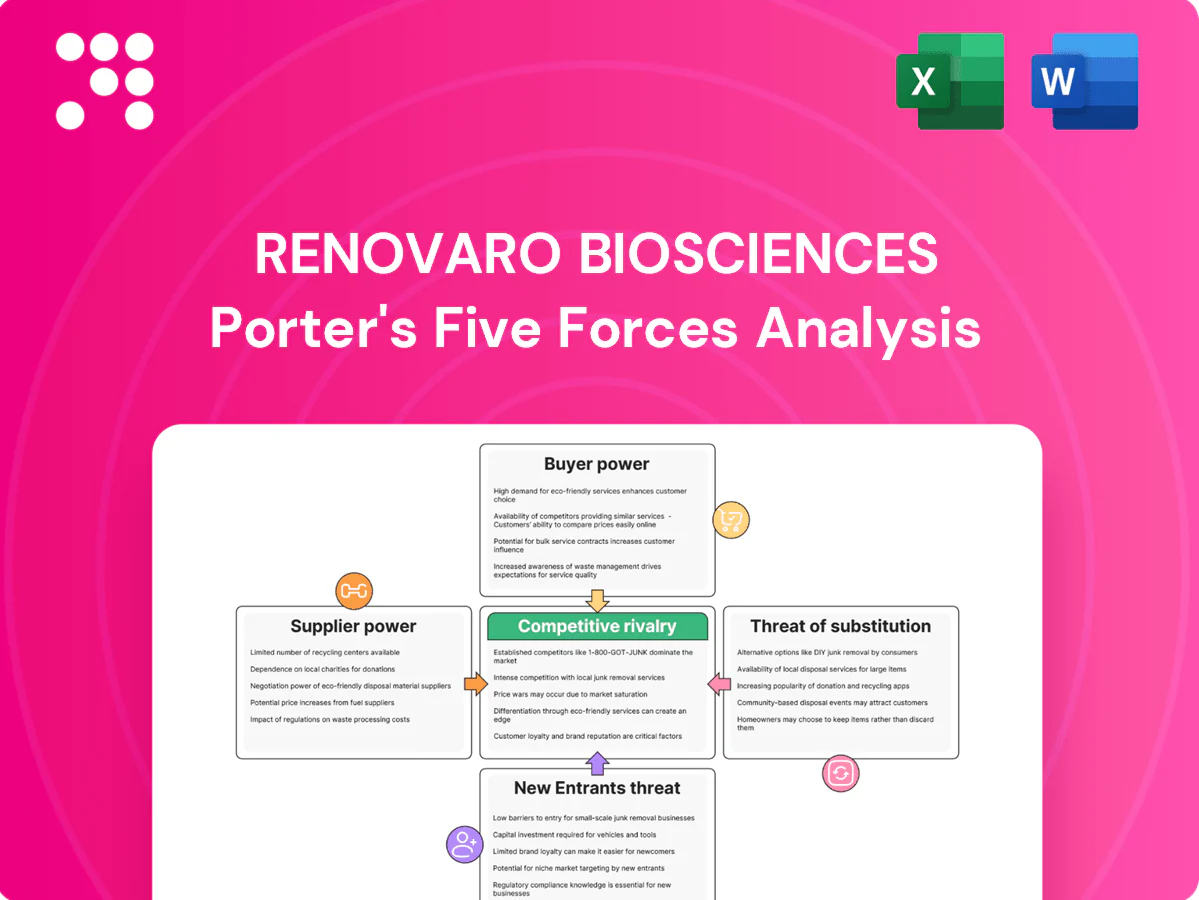
Renovaro Biosciences Porter's Five Forces Analysis

Don't Miss the Bigger Picture
Renovaro Biosciences faces moderate buyer power, high R&D-led barriers for new entrants, supplier concentration risks, and evolving substitute threats from alternative biotechnologies, creating a nuanced competitive landscape that rewards strategic partnerships and IP strength. This brief snapshot only scratches the surface. Unlock the full Porter's Five Forces Analysis to explore detailed force ratings, visuals, and actionable implications.
Suppliers Bargaining Power

Specialized CDMOs and vector makers
Manufacturing for viral vectors, plasmids and cell processing is concentrated among a few GMP-capable CDMOs—notably Lonza, Catalent and Thermo Fisher—giving suppliers pricing and slot leverage. Vendor switches require revalidation and comparability work that often adds months to timelines. Capacity constraints and 6–12 month lead times cited in 2024 can delay trials. Strategic multi-sourcing and prepped tech transfers reduce this exposure.
Proprietary reagents and platforms
Unique cell lines, delivery systems and patented tools often require licenses or sole sourcing, with industry royalty rates commonly reported at 3–6% in 2024; multiple licenses can create royalty stacks that may raise COGS by an estimated 5–15%. Field-of-use limits restrict freedom-to-operate and increase renegotiation risk, so negotiating broader rights early—now a growing priority in 2024 deal terms—reduces that exposure. Internalizing critical know-how or in-licensing broader rights can materially rebalance supplier bargaining power and lower long-term licensing spend.

Clinical trial sites and CRO dependencies
Tier-1 oncology centers and experienced CROs remain scarce and oversubscribed, giving providers take-it-or-leave-it leverage while the global CRO market exceeded $60 billion in 2024. Startup biotechs face queueing and often pay 20–30% premium rates to secure investigators and accelerate enrollment, with oncology trials commonly experiencing ~30% slower recruitment than planned. Mid-trial site performance variability raises switching costs, so long-term partnerships and country diversification are key mitigants.

Skilled talent and tacit expertise
CMC, immunology, and gene therapy specialists are scarce for process scale-up, and in 2024 demand outstripped supply, driving compensation and retention bonuses up roughly 20–40% from larger pharmas, raising supplier bargaining power. Attrition creates hidden risk through loss of tacit expertise; equity incentives and rigorous process documentation materially reduce dependency and knowledge flight.
- Limited supply: CMC/immunology/gene therapy specialists
- Compensation pressure: ~20–40% premium (2024)
- Hidden risk: tacit knowledge loss on attrition
- Mitigants: equity incentives; documented processes
Cold-chain and single-use systems
Advanced cold-chain logistics and single-use bioprocess components exert strong supplier power because periodic shortages and capacity constraints have been reported in 2024; the global cold-chain market is roughly $300 billion and single-use systems near $7 billion, concentrating demand with few specialist suppliers.
Lead-time spikes — often extending weeks to months during 2024 capacity crunches — can ripple through trial timelines and increase development costs and delay milestones.
Suppliers tend to prioritize larger customers during scarcity; active forecasting, increased safety stock, and qualifying alternate vendors materially reduce disruption risk.
- Fact: market sizes — cold-chain ~$300B (2024), single-use ~$7B (2024)
- Mitigation: forecasting, safety stock, qualified alternates
- Risk: lead-time spikes → trial delays and higher costs
GMP CDMO scarcity: 6–12m lead times, 3–6% royalties, premium CRO & cold-chain costs
Supplier power is high: GMP CDMOs (Lonza, Catalent, Thermo Fisher) control capacity, causing 6–12 month lead times and pricing leverage. Patented tools/licenses (royalties 3–6% in 2024) can add ~5–15% to COGS. CRO/capacity scarcity (global CRO >$60B) drives 20–30% premium; cold-chain ~$300B, single-use ~$7B concentrate leverage.
| Category | 2024 datapoint |
|---|---|
| CDMO lead times | 6–12 months |
| Royalty rates | 3–6% |
| COGS impact | +5–15% |
| CRO market | >$60B |
| Cold-chain / single-use | $300B / $7B |
What is included in the product
 Detailed Word Document
Tailored exclusively for Renovaro Biosciences, this Porter’s Five Forces analysis uncovers key drivers of competition, supplier and buyer power, and market entry risks while identifying disruptive substitutes and emerging threats that could reshape pricing, profitability, and strategic positioning.

 Customizable Excel Spreadsheet
Clear one-sheet Porter's Five Forces for Renovaro Biosciences—customize pressure levels, swap in your data and instantly visualize strategic pressure with a ready-to-use spider chart for decks or reports.
Customers Bargaining Power

Payers and HTA gatekeepers
Payers and HTA gatekeepers exert high leverage: with cell and gene therapies priced at scale (Zolgensma $2.1M, Luxturna $425k, CAR-Ts ~$373k–$475k), scrutiny on cost-effectiveness and budget impact is intense, using thresholds like ICER $100k–$150k/QALY and NICE £20k–30k/QALY. Payers increasingly demand outcomes-based contracts and prior authorization to limit use. Limited substitutes in niche indications can soften pressure but oncology remains crowded. Early pharmaco-economic modeling strengthens Renovaro’s value narrative.
Hospital systems and infusion centers
Provider adoption hinges on operational fit, training, and reimbursement certainty; large IDNs can negotiate discounts typically in the 5–25% range or adopt competing protocols. Site-of-care economics — with site-shift savings often 20–40% versus inpatient delivery — strongly influence formulary and pathway inclusion. Robust implementation support and streamlined workflows, which can cut administration burden substantially, increase customer stickiness.

Biopharma partners and licensors
At clinical stages, out-licensing or co-development partners behave as highly concentrated buyers, driving hard bargains on milestone, territory and royalty structures; 2024 partnering trends showed top-tier deals continuing to hinge on aggressive milestone and royalty mixes. Competitive term sheets from multiple suitors materially improve sponsor leverage, while clear product differentiation and de-risked CMC data shift negotiation outcomes meaningfully in favor of the licensor.

Patients and advocacy groups
In 2024 regulators and sponsors increasingly integrated patient advocacy into oncology trial design, shaping endpoints and access while improving enrollment. Price sensitivity largely transfers to payers and assistance programs, though copay relief reduces immediate barriers. Strong clinical benefit and manageable toxicity drive pull‑through; compassionate use and patient‑reported outcomes build lasting goodwill.
- 2024: advocacy shaped trial endpoints and enrollment
- Payers/assistance absorb most price sensitivity
- High efficacy + low toxicity = stronger uptake
- Compassionate use and PROs enhance goodwill
Regulators as quasi-buyers
Regulators act as quasi-buyers for Renovaro: FDA and EMA decisions dictate marketability and label breadth, with PDUFA review targets of 10 months for standard and 6 months for priority reviews and EMA centralized timelines of 210 days affecting launch timing. Requirements for robust endpoints and intensified safety monitoring lengthen development and raise costs. Advisory committee outcomes, though non-binding, heavily shape payer coverage and labeling. Proactive regulator engagement and adaptive trial designs reduce approval risk and can accelerate review.
- PDUFA: 10 months standard, 6 months priority
- EMA centralized: 210 days
- Adcomm influence: non-binding but high impact on payer decisions
- Adaptive trials: accepted pathway to lower approval risk
Payer ICERs $100k–$150k/QALY; provider discounts 5–25%, site saves 20–40%
Payer/HTA leverage is high: willingness to use ICER thresholds ($100k–$150k/QALY) and outcomes contracts; Renovaro faces pricing scrutiny versus benchmarks (Zolgensma $2.1M, CAR‑T $373k–475k). Provider bargaining reduces net prices (~5–25% discounts) and favors site‑of‑care shifts (20–40% savings). Partners and regulators act as concentrated buyers shaping terms and launch timing.
| Metric | Value |
|---|---|
| Payer thresholds | $100k–$150k/QALY |
| Provider discounts | 5–25% |
| Site‑of‑care savings | 20–40% |
What You See Is What You Get
Renovaro Biosciences Porter's Five Forces Analysis
This preview shows the exact Renovaro Biosciences Porter's Five Forces Analysis you'll receive immediately after purchase—no surprises or placeholders. The document is fully formatted, final, and ready for download and use the moment you buy. You're viewing the same deliverable that will be available to you instantly.

Don't Miss the Bigger Picture
Renovaro Biosciences faces moderate buyer power, high R&D-led barriers for new entrants, supplier concentration risks, and evolving substitute threats from alternative biotechnologies, creating a nuanced competitive landscape that rewards strategic partnerships and IP strength. This brief snapshot only scratches the surface. Unlock the full Porter's Five Forces Analysis to explore detailed force ratings, visuals, and actionable implications.
Suppliers Bargaining Power
Specialized CDMOs and vector makers
Manufacturing for viral vectors, plasmids and cell processing is concentrated among a few GMP-capable CDMOs—notably Lonza, Catalent and Thermo Fisher—giving suppliers pricing and slot leverage. Vendor switches require revalidation and comparability work that often adds months to timelines. Capacity constraints and 6–12 month lead times cited in 2024 can delay trials. Strategic multi-sourcing and prepped tech transfers reduce this exposure.
Proprietary reagents and platforms
Unique cell lines, delivery systems and patented tools often require licenses or sole sourcing, with industry royalty rates commonly reported at 3–6% in 2024; multiple licenses can create royalty stacks that may raise COGS by an estimated 5–15%. Field-of-use limits restrict freedom-to-operate and increase renegotiation risk, so negotiating broader rights early—now a growing priority in 2024 deal terms—reduces that exposure. Internalizing critical know-how or in-licensing broader rights can materially rebalance supplier bargaining power and lower long-term licensing spend.
Clinical trial sites and CRO dependencies
Tier-1 oncology centers and experienced CROs remain scarce and oversubscribed, giving providers take-it-or-leave-it leverage while the global CRO market exceeded $60 billion in 2024. Startup biotechs face queueing and often pay 20–30% premium rates to secure investigators and accelerate enrollment, with oncology trials commonly experiencing ~30% slower recruitment than planned. Mid-trial site performance variability raises switching costs, so long-term partnerships and country diversification are key mitigants.
Skilled talent and tacit expertise
CMC, immunology, and gene therapy specialists are scarce for process scale-up, and in 2024 demand outstripped supply, driving compensation and retention bonuses up roughly 20–40% from larger pharmas, raising supplier bargaining power. Attrition creates hidden risk through loss of tacit expertise; equity incentives and rigorous process documentation materially reduce dependency and knowledge flight.
- Limited supply: CMC/immunology/gene therapy specialists
- Compensation pressure: ~20–40% premium (2024)
- Hidden risk: tacit knowledge loss on attrition
- Mitigants: equity incentives; documented processes
Cold-chain and single-use systems
Advanced cold-chain logistics and single-use bioprocess components exert strong supplier power because periodic shortages and capacity constraints have been reported in 2024; the global cold-chain market is roughly $300 billion and single-use systems near $7 billion, concentrating demand with few specialist suppliers.
Lead-time spikes — often extending weeks to months during 2024 capacity crunches — can ripple through trial timelines and increase development costs and delay milestones.
Suppliers tend to prioritize larger customers during scarcity; active forecasting, increased safety stock, and qualifying alternate vendors materially reduce disruption risk.
- Fact: market sizes — cold-chain ~$300B (2024), single-use ~$7B (2024)
- Mitigation: forecasting, safety stock, qualified alternates
- Risk: lead-time spikes → trial delays and higher costs
GMP CDMO scarcity: 6–12m lead times, 3–6% royalties, premium CRO & cold-chain costs
Supplier power is high: GMP CDMOs (Lonza, Catalent, Thermo Fisher) control capacity, causing 6–12 month lead times and pricing leverage. Patented tools/licenses (royalties 3–6% in 2024) can add ~5–15% to COGS. CRO/capacity scarcity (global CRO >$60B) drives 20–30% premium; cold-chain ~$300B, single-use ~$7B concentrate leverage.
| Category | 2024 datapoint |
|---|---|
| CDMO lead times | 6–12 months |
| Royalty rates | 3–6% |
| COGS impact | +5–15% |
| CRO market | >$60B |
| Cold-chain / single-use | $300B / $7B |
What is included in the product
Detailed Word Document
Tailored exclusively for Renovaro Biosciences, this Porter’s Five Forces analysis uncovers key drivers of competition, supplier and buyer power, and market entry risks while identifying disruptive substitutes and emerging threats that could reshape pricing, profitability, and strategic positioning.
Customizable Excel Spreadsheet
Clear one-sheet Porter's Five Forces for Renovaro Biosciences—customize pressure levels, swap in your data and instantly visualize strategic pressure with a ready-to-use spider chart for decks or reports.
Customers Bargaining Power
Payers and HTA gatekeepers
Payers and HTA gatekeepers exert high leverage: with cell and gene therapies priced at scale (Zolgensma $2.1M, Luxturna $425k, CAR-Ts ~$373k–$475k), scrutiny on cost-effectiveness and budget impact is intense, using thresholds like ICER $100k–$150k/QALY and NICE £20k–30k/QALY. Payers increasingly demand outcomes-based contracts and prior authorization to limit use. Limited substitutes in niche indications can soften pressure but oncology remains crowded. Early pharmaco-economic modeling strengthens Renovaro’s value narrative.
Hospital systems and infusion centers
Provider adoption hinges on operational fit, training, and reimbursement certainty; large IDNs can negotiate discounts typically in the 5–25% range or adopt competing protocols. Site-of-care economics — with site-shift savings often 20–40% versus inpatient delivery — strongly influence formulary and pathway inclusion. Robust implementation support and streamlined workflows, which can cut administration burden substantially, increase customer stickiness.
Biopharma partners and licensors
At clinical stages, out-licensing or co-development partners behave as highly concentrated buyers, driving hard bargains on milestone, territory and royalty structures; 2024 partnering trends showed top-tier deals continuing to hinge on aggressive milestone and royalty mixes. Competitive term sheets from multiple suitors materially improve sponsor leverage, while clear product differentiation and de-risked CMC data shift negotiation outcomes meaningfully in favor of the licensor.
Patients and advocacy groups
In 2024 regulators and sponsors increasingly integrated patient advocacy into oncology trial design, shaping endpoints and access while improving enrollment. Price sensitivity largely transfers to payers and assistance programs, though copay relief reduces immediate barriers. Strong clinical benefit and manageable toxicity drive pull‑through; compassionate use and patient‑reported outcomes build lasting goodwill.
- 2024: advocacy shaped trial endpoints and enrollment
- Payers/assistance absorb most price sensitivity
- High efficacy + low toxicity = stronger uptake
- Compassionate use and PROs enhance goodwill
Regulators as quasi-buyers
Regulators act as quasi-buyers for Renovaro: FDA and EMA decisions dictate marketability and label breadth, with PDUFA review targets of 10 months for standard and 6 months for priority reviews and EMA centralized timelines of 210 days affecting launch timing. Requirements for robust endpoints and intensified safety monitoring lengthen development and raise costs. Advisory committee outcomes, though non-binding, heavily shape payer coverage and labeling. Proactive regulator engagement and adaptive trial designs reduce approval risk and can accelerate review.
- PDUFA: 10 months standard, 6 months priority
- EMA centralized: 210 days
- Adcomm influence: non-binding but high impact on payer decisions
- Adaptive trials: accepted pathway to lower approval risk
Payer ICERs $100k–$150k/QALY; provider discounts 5–25%, site saves 20–40%
Payer/HTA leverage is high: willingness to use ICER thresholds ($100k–$150k/QALY) and outcomes contracts; Renovaro faces pricing scrutiny versus benchmarks (Zolgensma $2.1M, CAR‑T $373k–475k). Provider bargaining reduces net prices (~5–25% discounts) and favors site‑of‑care shifts (20–40% savings). Partners and regulators act as concentrated buyers shaping terms and launch timing.
| Metric | Value |
|---|---|
| Payer thresholds | $100k–$150k/QALY |
| Provider discounts | 5–25% |
| Site‑of‑care savings | 20–40% |
What You See Is What You Get
Renovaro Biosciences Porter's Five Forces Analysis
This preview shows the exact Renovaro Biosciences Porter's Five Forces Analysis you'll receive immediately after purchase—no surprises or placeholders. The document is fully formatted, final, and ready for download and use the moment you buy. You're viewing the same deliverable that will be available to you instantly.
Original: $10.00
-65%$10.00
$3.50Description
Don't Miss the Bigger Picture
Renovaro Biosciences faces moderate buyer power, high R&D-led barriers for new entrants, supplier concentration risks, and evolving substitute threats from alternative biotechnologies, creating a nuanced competitive landscape that rewards strategic partnerships and IP strength. This brief snapshot only scratches the surface. Unlock the full Porter's Five Forces Analysis to explore detailed force ratings, visuals, and actionable implications.
Suppliers Bargaining Power
Specialized CDMOs and vector makers
Manufacturing for viral vectors, plasmids and cell processing is concentrated among a few GMP-capable CDMOs—notably Lonza, Catalent and Thermo Fisher—giving suppliers pricing and slot leverage. Vendor switches require revalidation and comparability work that often adds months to timelines. Capacity constraints and 6–12 month lead times cited in 2024 can delay trials. Strategic multi-sourcing and prepped tech transfers reduce this exposure.
Proprietary reagents and platforms
Unique cell lines, delivery systems and patented tools often require licenses or sole sourcing, with industry royalty rates commonly reported at 3–6% in 2024; multiple licenses can create royalty stacks that may raise COGS by an estimated 5–15%. Field-of-use limits restrict freedom-to-operate and increase renegotiation risk, so negotiating broader rights early—now a growing priority in 2024 deal terms—reduces that exposure. Internalizing critical know-how or in-licensing broader rights can materially rebalance supplier bargaining power and lower long-term licensing spend.
Clinical trial sites and CRO dependencies
Tier-1 oncology centers and experienced CROs remain scarce and oversubscribed, giving providers take-it-or-leave-it leverage while the global CRO market exceeded $60 billion in 2024. Startup biotechs face queueing and often pay 20–30% premium rates to secure investigators and accelerate enrollment, with oncology trials commonly experiencing ~30% slower recruitment than planned. Mid-trial site performance variability raises switching costs, so long-term partnerships and country diversification are key mitigants.
Skilled talent and tacit expertise
CMC, immunology, and gene therapy specialists are scarce for process scale-up, and in 2024 demand outstripped supply, driving compensation and retention bonuses up roughly 20–40% from larger pharmas, raising supplier bargaining power. Attrition creates hidden risk through loss of tacit expertise; equity incentives and rigorous process documentation materially reduce dependency and knowledge flight.
- Limited supply: CMC/immunology/gene therapy specialists
- Compensation pressure: ~20–40% premium (2024)
- Hidden risk: tacit knowledge loss on attrition
- Mitigants: equity incentives; documented processes
Cold-chain and single-use systems
Advanced cold-chain logistics and single-use bioprocess components exert strong supplier power because periodic shortages and capacity constraints have been reported in 2024; the global cold-chain market is roughly $300 billion and single-use systems near $7 billion, concentrating demand with few specialist suppliers.
Lead-time spikes — often extending weeks to months during 2024 capacity crunches — can ripple through trial timelines and increase development costs and delay milestones.
Suppliers tend to prioritize larger customers during scarcity; active forecasting, increased safety stock, and qualifying alternate vendors materially reduce disruption risk.
- Fact: market sizes — cold-chain ~$300B (2024), single-use ~$7B (2024)
- Mitigation: forecasting, safety stock, qualified alternates
- Risk: lead-time spikes → trial delays and higher costs
GMP CDMO scarcity: 6–12m lead times, 3–6% royalties, premium CRO & cold-chain costs
Supplier power is high: GMP CDMOs (Lonza, Catalent, Thermo Fisher) control capacity, causing 6–12 month lead times and pricing leverage. Patented tools/licenses (royalties 3–6% in 2024) can add ~5–15% to COGS. CRO/capacity scarcity (global CRO >$60B) drives 20–30% premium; cold-chain ~$300B, single-use ~$7B concentrate leverage.
| Category | 2024 datapoint |
|---|---|
| CDMO lead times | 6–12 months |
| Royalty rates | 3–6% |
| COGS impact | +5–15% |
| CRO market | >$60B |
| Cold-chain / single-use | $300B / $7B |
What is included in the product
Detailed Word Document
Tailored exclusively for Renovaro Biosciences, this Porter’s Five Forces analysis uncovers key drivers of competition, supplier and buyer power, and market entry risks while identifying disruptive substitutes and emerging threats that could reshape pricing, profitability, and strategic positioning.
Customizable Excel Spreadsheet
Clear one-sheet Porter's Five Forces for Renovaro Biosciences—customize pressure levels, swap in your data and instantly visualize strategic pressure with a ready-to-use spider chart for decks or reports.
Customers Bargaining Power
Payers and HTA gatekeepers
Payers and HTA gatekeepers exert high leverage: with cell and gene therapies priced at scale (Zolgensma $2.1M, Luxturna $425k, CAR-Ts ~$373k–$475k), scrutiny on cost-effectiveness and budget impact is intense, using thresholds like ICER $100k–$150k/QALY and NICE £20k–30k/QALY. Payers increasingly demand outcomes-based contracts and prior authorization to limit use. Limited substitutes in niche indications can soften pressure but oncology remains crowded. Early pharmaco-economic modeling strengthens Renovaro’s value narrative.
Hospital systems and infusion centers
Provider adoption hinges on operational fit, training, and reimbursement certainty; large IDNs can negotiate discounts typically in the 5–25% range or adopt competing protocols. Site-of-care economics — with site-shift savings often 20–40% versus inpatient delivery — strongly influence formulary and pathway inclusion. Robust implementation support and streamlined workflows, which can cut administration burden substantially, increase customer stickiness.
Biopharma partners and licensors
At clinical stages, out-licensing or co-development partners behave as highly concentrated buyers, driving hard bargains on milestone, territory and royalty structures; 2024 partnering trends showed top-tier deals continuing to hinge on aggressive milestone and royalty mixes. Competitive term sheets from multiple suitors materially improve sponsor leverage, while clear product differentiation and de-risked CMC data shift negotiation outcomes meaningfully in favor of the licensor.
Patients and advocacy groups
In 2024 regulators and sponsors increasingly integrated patient advocacy into oncology trial design, shaping endpoints and access while improving enrollment. Price sensitivity largely transfers to payers and assistance programs, though copay relief reduces immediate barriers. Strong clinical benefit and manageable toxicity drive pull‑through; compassionate use and patient‑reported outcomes build lasting goodwill.
- 2024: advocacy shaped trial endpoints and enrollment
- Payers/assistance absorb most price sensitivity
- High efficacy + low toxicity = stronger uptake
- Compassionate use and PROs enhance goodwill
Regulators as quasi-buyers
Regulators act as quasi-buyers for Renovaro: FDA and EMA decisions dictate marketability and label breadth, with PDUFA review targets of 10 months for standard and 6 months for priority reviews and EMA centralized timelines of 210 days affecting launch timing. Requirements for robust endpoints and intensified safety monitoring lengthen development and raise costs. Advisory committee outcomes, though non-binding, heavily shape payer coverage and labeling. Proactive regulator engagement and adaptive trial designs reduce approval risk and can accelerate review.
- PDUFA: 10 months standard, 6 months priority
- EMA centralized: 210 days
- Adcomm influence: non-binding but high impact on payer decisions
- Adaptive trials: accepted pathway to lower approval risk
Payer ICERs $100k–$150k/QALY; provider discounts 5–25%, site saves 20–40%
Payer/HTA leverage is high: willingness to use ICER thresholds ($100k–$150k/QALY) and outcomes contracts; Renovaro faces pricing scrutiny versus benchmarks (Zolgensma $2.1M, CAR‑T $373k–475k). Provider bargaining reduces net prices (~5–25% discounts) and favors site‑of‑care shifts (20–40% savings). Partners and regulators act as concentrated buyers shaping terms and launch timing.
| Metric | Value |
|---|---|
| Payer thresholds | $100k–$150k/QALY |
| Provider discounts | 5–25% |
| Site‑of‑care savings | 20–40% |
What You See Is What You Get
Renovaro Biosciences Porter's Five Forces Analysis
This preview shows the exact Renovaro Biosciences Porter's Five Forces Analysis you'll receive immediately after purchase—no surprises or placeholders. The document is fully formatted, final, and ready for download and use the moment you buy. You're viewing the same deliverable that will be available to you instantly.











