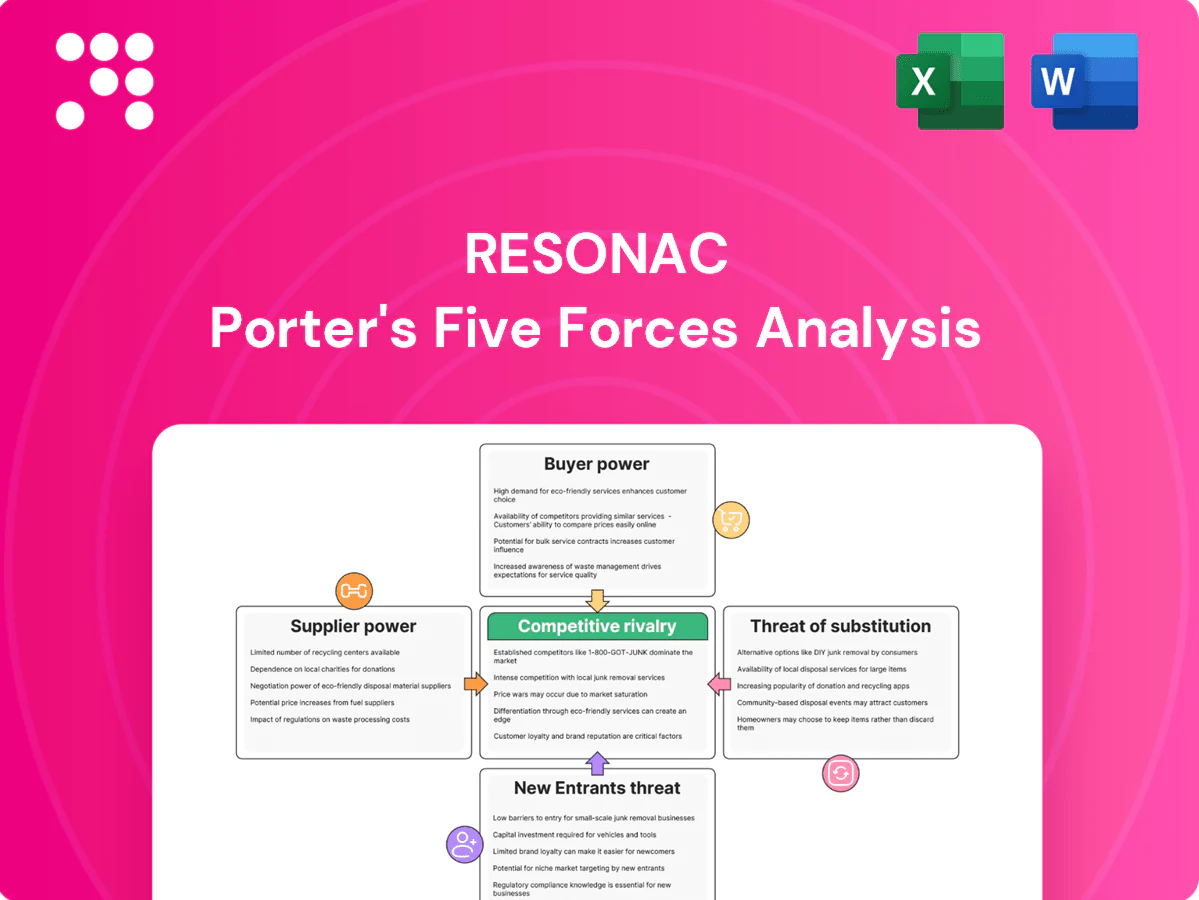
Resonac Porter's Five Forces Analysis

A Must-Have Tool for Decision-Makers
Resonac's Porter's Five Forces snapshot highlights supplier concentration, moderate buyer power, and steady rivalry driven by specialty chemical rivals. Barriers to entry are significant, while substitutes and regulatory shifts pose emerging risks. This brief overview hints at strategic pressure points and opportunity areas for Resonac. Unlock the full Porter's Five Forces Analysis for force-by-force ratings, visuals, and actionable strategy.
Suppliers Bargaining Power

Upstream feedstock concentration
Resonac depends on petrochemical feedstocks and rare/industrial gases from a concentrated set of global players (SABIC, INEOS, Shell; Linde, Air Liquide, Air Products), with top industrial gas firms holding about 65% market share and OPEC+ supplying ~40% of oil output in 2024. Consolidation and geopolitical risks raise switching costs and price volatility. Energy or shipping disruptions tighten supply, giving upstream suppliers negotiating leverage in tight cycles.
Specialty inputs and purity specs
Electronics-grade chemicals, precursors and high-purity materials for Resonac have few qualified sources, with ppm/ppb purity requirements sharply narrowing the vendor pool and raising dependency risk. Suppliers owning proprietary purification technologies command significant price premiums and long-term contracts. Qualification of alternate vendors is slow and costly, often exceeding 6 months and costing into the low six figures, reinforcing supplier power.

Energy and utilities intensity
Resonac's high electricity and steam intensity heightens exposure to power providers and fuel markets; Japan's energy self-sufficiency remained around 8% in 2024, keeping import-linked LNG and power prices critical. Spot LNG (JKM) averaged roughly $14/MMBtu in 2024, and electricity price spikes feed directly into COGS. Limited near-term fuel substitution constrains supplier bargaining; long-term PPAs and efficiency projects only partially offset this leverage.

Logistics and regional exposure
Global supply chains for solvents, metals and rare elements face port congestion and regulatory checks that have driven freight-rate swings of roughly 20–40% in 2024; Japan-centric operations import over 90% of key rare metals, exposing Resonac to FX swings and import bottlenecks. Carriers’ control of capacity lifts delivered costs, and suppliers who guarantee delivery windows can command 5–10% better terms.
ESG and compliance constraints
- Regulatory tightening 2024: fewer compliant vendors
- Certifications & traceability raise switching friction
- Compliance costs often passed to buyers
- Higher supplier power in specialty chem segments
Concentrated suppliers raise input risk — gas ~65%, OPEC+ ~40%
Resonac faces high supplier power: petrochemical and industrial-gas markets are concentrated (top gas firms ~65%; OPEC+ ~40% oil supply in 2024), raising price and switching risk. Electronics-grade precursors have few qualified vendors; qualification >6 months and low-six-figure costs. Energy/import dependence (Japan LNG spot ~$14/MMBtu 2024; >90% critical metal imports) further boosts supplier leverage.
| Metric | Value (2024) |
|---|---|
| Industrial gas share | ~65% |
| OPEC+ oil output | ~40% |
| Japan metal import | >90% |
| JKM LNG avg | $14/MMBtu |
| Freight volatility | 20–40% |
What is included in the product
 Detailed Word Document
Comprehensive Porter's Five Forces analysis tailored to Resonac, evaluating competitor rivalry, supplier and buyer power, threat of substitutes, and barriers to entry to reveal pricing pressures and profitability risks. Fully editable Word format for use in investor materials, strategic planning, and academic projects.

 Customizable Excel Spreadsheet
A one-sheet Porter's Five Forces for Resonac with customizable pressure sliders and radar chart to quickly pinpoint strategic threats and reliefs—clean layout ready for pitch decks or Excel dashboards and easy for non-finance users with no macros required.
Customers Bargaining Power

Concentrated OEMs and fabs
Automotive OEMs, major semiconductor fabs and electronics leaders exert strong buyer power over Resonac due to scale, demanding price, quality and delivery terms. TSMC alone held about 54% of the global foundry market in 2024, illustrating concentration among key fab customers. Volume leverage enables multi-year pricing frameworks and long-term supply contracts. This concentration raises buyer bargaining power in critical segments.
High qualification, high switching costs
In chips and advanced materials qualification is lengthy and risk-sensitive, commonly taking 6–18 months and involving extensive reliability testing. Once specified, customers avoid switching because yield and long-term reliability risks can affect production continuity, which tempers buyer power after adoption. During pre-qualification buyers extract concessions such as trial pricing, qualification discounts and engineering support to de-risk selection.

Co-development stickiness
Joint R&D and custom formulations embed Resonac into customer roadmaps, creating technical lock-in that reduces product comparability and encourages long-term supply contracts. This embedded know-how blunts pure price bargaining by shifting negotiations toward technical support, delivery and co-development timelines. Customers may still push for IP sharing or cost-down clauses as a trade-off for deeper integration.

Cyclical demand and inventory swings
Downcycles in autos and semiconductors drive destocking and aggressive re-bidding, with buyers demanding price cuts, rebates and flexible MOQs; in 2024 buyers retained leverage during softer demand phases. When end-market upcycles tighten capacity, bargaining power shifts back toward suppliers. Resonac’s diverse portfolio cushions but does not eliminate these cyclical swings.
- Buyer pressure: price cuts, rebates, flexible MOQs
- Cycle flip: power shifts as capacity tightens
- Resonac: portfolio diversity moderates cyclicality
Backward integration threats
Large fabs and battery leaders including TSMC, Samsung and CATL publicly expanded upstream materials pilots in 2024, exploring in-house slurry, CMP and precursor capabilities, creating a credible partial-integration threat that strengthens customer bargaining power. OEMs increasingly dual-source or develop private-label components, pressuring margins; Resonac must offset this by differentiating on performance and service.
- Threat: upstream pilots by TSMC/Samsung/CATL (2024)
- OEM response: dual-sourcing/private labels
- Resonac action: focus on superior yield, service SLAs
Concentrated buyers (TSMC 54%) boost buyer leverage; 6-18m qual limits switching
Concentrated customers (TSMC 54% foundry share in 2024) give strong buyer power over Resonac via volume pricing, long-term contracts and strict Q/D terms. Lengthy qualification (6–18 months) reduces switching after adoption, shifting leverage to suppliers post-qualification. Downcycles in 2024 increased buyer demands for cuts/rebates; upstream pilots by TSMC/Samsung/CATL raise partial-integration threat.
| Metric | 2024 |
|---|---|
| TSMC foundry share | 54% |
| Qualification time | 6–18 months |
| Upstream pilots | TSMC, Samsung, CATL |
| Downcycle buyer leverage | High (price cuts/rebates) |
What You See Is What You Get
Resonac Porter's Five Forces Analysis
This preview displays the full Resonac Porter’s Five Forces Analysis you’ll receive upon purchase—no placeholders, no excerpts. It’s the same professionally written, formatted document ready for immediate download and use. Purchase grants instant access to this exact file with comprehensive competitive insights and strategic implications.

A Must-Have Tool for Decision-Makers
Resonac's Porter's Five Forces snapshot highlights supplier concentration, moderate buyer power, and steady rivalry driven by specialty chemical rivals. Barriers to entry are significant, while substitutes and regulatory shifts pose emerging risks. This brief overview hints at strategic pressure points and opportunity areas for Resonac. Unlock the full Porter's Five Forces Analysis for force-by-force ratings, visuals, and actionable strategy.
Suppliers Bargaining Power
Upstream feedstock concentration
Resonac depends on petrochemical feedstocks and rare/industrial gases from a concentrated set of global players (SABIC, INEOS, Shell; Linde, Air Liquide, Air Products), with top industrial gas firms holding about 65% market share and OPEC+ supplying ~40% of oil output in 2024. Consolidation and geopolitical risks raise switching costs and price volatility. Energy or shipping disruptions tighten supply, giving upstream suppliers negotiating leverage in tight cycles.
Specialty inputs and purity specs
Electronics-grade chemicals, precursors and high-purity materials for Resonac have few qualified sources, with ppm/ppb purity requirements sharply narrowing the vendor pool and raising dependency risk. Suppliers owning proprietary purification technologies command significant price premiums and long-term contracts. Qualification of alternate vendors is slow and costly, often exceeding 6 months and costing into the low six figures, reinforcing supplier power.
Energy and utilities intensity
Resonac's high electricity and steam intensity heightens exposure to power providers and fuel markets; Japan's energy self-sufficiency remained around 8% in 2024, keeping import-linked LNG and power prices critical. Spot LNG (JKM) averaged roughly $14/MMBtu in 2024, and electricity price spikes feed directly into COGS. Limited near-term fuel substitution constrains supplier bargaining; long-term PPAs and efficiency projects only partially offset this leverage.
Logistics and regional exposure
Global supply chains for solvents, metals and rare elements face port congestion and regulatory checks that have driven freight-rate swings of roughly 20–40% in 2024; Japan-centric operations import over 90% of key rare metals, exposing Resonac to FX swings and import bottlenecks. Carriers’ control of capacity lifts delivered costs, and suppliers who guarantee delivery windows can command 5–10% better terms.
ESG and compliance constraints
- Regulatory tightening 2024: fewer compliant vendors
- Certifications & traceability raise switching friction
- Compliance costs often passed to buyers
- Higher supplier power in specialty chem segments
Concentrated suppliers raise input risk — gas ~65%, OPEC+ ~40%
Resonac faces high supplier power: petrochemical and industrial-gas markets are concentrated (top gas firms ~65%; OPEC+ ~40% oil supply in 2024), raising price and switching risk. Electronics-grade precursors have few qualified vendors; qualification >6 months and low-six-figure costs. Energy/import dependence (Japan LNG spot ~$14/MMBtu 2024; >90% critical metal imports) further boosts supplier leverage.
| Metric | Value (2024) |
|---|---|
| Industrial gas share | ~65% |
| OPEC+ oil output | ~40% |
| Japan metal import | >90% |
| JKM LNG avg | $14/MMBtu |
| Freight volatility | 20–40% |
What is included in the product
Detailed Word Document
Comprehensive Porter's Five Forces analysis tailored to Resonac, evaluating competitor rivalry, supplier and buyer power, threat of substitutes, and barriers to entry to reveal pricing pressures and profitability risks. Fully editable Word format for use in investor materials, strategic planning, and academic projects.
Customizable Excel Spreadsheet
A one-sheet Porter's Five Forces for Resonac with customizable pressure sliders and radar chart to quickly pinpoint strategic threats and reliefs—clean layout ready for pitch decks or Excel dashboards and easy for non-finance users with no macros required.
Customers Bargaining Power
Concentrated OEMs and fabs
Automotive OEMs, major semiconductor fabs and electronics leaders exert strong buyer power over Resonac due to scale, demanding price, quality and delivery terms. TSMC alone held about 54% of the global foundry market in 2024, illustrating concentration among key fab customers. Volume leverage enables multi-year pricing frameworks and long-term supply contracts. This concentration raises buyer bargaining power in critical segments.
High qualification, high switching costs
In chips and advanced materials qualification is lengthy and risk-sensitive, commonly taking 6–18 months and involving extensive reliability testing. Once specified, customers avoid switching because yield and long-term reliability risks can affect production continuity, which tempers buyer power after adoption. During pre-qualification buyers extract concessions such as trial pricing, qualification discounts and engineering support to de-risk selection.
Co-development stickiness
Joint R&D and custom formulations embed Resonac into customer roadmaps, creating technical lock-in that reduces product comparability and encourages long-term supply contracts. This embedded know-how blunts pure price bargaining by shifting negotiations toward technical support, delivery and co-development timelines. Customers may still push for IP sharing or cost-down clauses as a trade-off for deeper integration.
Cyclical demand and inventory swings
Downcycles in autos and semiconductors drive destocking and aggressive re-bidding, with buyers demanding price cuts, rebates and flexible MOQs; in 2024 buyers retained leverage during softer demand phases. When end-market upcycles tighten capacity, bargaining power shifts back toward suppliers. Resonac’s diverse portfolio cushions but does not eliminate these cyclical swings.
- Buyer pressure: price cuts, rebates, flexible MOQs
- Cycle flip: power shifts as capacity tightens
- Resonac: portfolio diversity moderates cyclicality
Backward integration threats
Large fabs and battery leaders including TSMC, Samsung and CATL publicly expanded upstream materials pilots in 2024, exploring in-house slurry, CMP and precursor capabilities, creating a credible partial-integration threat that strengthens customer bargaining power. OEMs increasingly dual-source or develop private-label components, pressuring margins; Resonac must offset this by differentiating on performance and service.
- Threat: upstream pilots by TSMC/Samsung/CATL (2024)
- OEM response: dual-sourcing/private labels
- Resonac action: focus on superior yield, service SLAs
Concentrated buyers (TSMC 54%) boost buyer leverage; 6-18m qual limits switching
Concentrated customers (TSMC 54% foundry share in 2024) give strong buyer power over Resonac via volume pricing, long-term contracts and strict Q/D terms. Lengthy qualification (6–18 months) reduces switching after adoption, shifting leverage to suppliers post-qualification. Downcycles in 2024 increased buyer demands for cuts/rebates; upstream pilots by TSMC/Samsung/CATL raise partial-integration threat.
| Metric | 2024 |
|---|---|
| TSMC foundry share | 54% |
| Qualification time | 6–18 months |
| Upstream pilots | TSMC, Samsung, CATL |
| Downcycle buyer leverage | High (price cuts/rebates) |
What You See Is What You Get
Resonac Porter's Five Forces Analysis
This preview displays the full Resonac Porter’s Five Forces Analysis you’ll receive upon purchase—no placeholders, no excerpts. It’s the same professionally written, formatted document ready for immediate download and use. Purchase grants instant access to this exact file with comprehensive competitive insights and strategic implications.
Original: $10.00
-65%$10.00
$3.50Description
A Must-Have Tool for Decision-Makers
Resonac's Porter's Five Forces snapshot highlights supplier concentration, moderate buyer power, and steady rivalry driven by specialty chemical rivals. Barriers to entry are significant, while substitutes and regulatory shifts pose emerging risks. This brief overview hints at strategic pressure points and opportunity areas for Resonac. Unlock the full Porter's Five Forces Analysis for force-by-force ratings, visuals, and actionable strategy.
Suppliers Bargaining Power
Upstream feedstock concentration
Resonac depends on petrochemical feedstocks and rare/industrial gases from a concentrated set of global players (SABIC, INEOS, Shell; Linde, Air Liquide, Air Products), with top industrial gas firms holding about 65% market share and OPEC+ supplying ~40% of oil output in 2024. Consolidation and geopolitical risks raise switching costs and price volatility. Energy or shipping disruptions tighten supply, giving upstream suppliers negotiating leverage in tight cycles.
Specialty inputs and purity specs
Electronics-grade chemicals, precursors and high-purity materials for Resonac have few qualified sources, with ppm/ppb purity requirements sharply narrowing the vendor pool and raising dependency risk. Suppliers owning proprietary purification technologies command significant price premiums and long-term contracts. Qualification of alternate vendors is slow and costly, often exceeding 6 months and costing into the low six figures, reinforcing supplier power.
Energy and utilities intensity
Resonac's high electricity and steam intensity heightens exposure to power providers and fuel markets; Japan's energy self-sufficiency remained around 8% in 2024, keeping import-linked LNG and power prices critical. Spot LNG (JKM) averaged roughly $14/MMBtu in 2024, and electricity price spikes feed directly into COGS. Limited near-term fuel substitution constrains supplier bargaining; long-term PPAs and efficiency projects only partially offset this leverage.
Logistics and regional exposure
Global supply chains for solvents, metals and rare elements face port congestion and regulatory checks that have driven freight-rate swings of roughly 20–40% in 2024; Japan-centric operations import over 90% of key rare metals, exposing Resonac to FX swings and import bottlenecks. Carriers’ control of capacity lifts delivered costs, and suppliers who guarantee delivery windows can command 5–10% better terms.
ESG and compliance constraints
- Regulatory tightening 2024: fewer compliant vendors
- Certifications & traceability raise switching friction
- Compliance costs often passed to buyers
- Higher supplier power in specialty chem segments
Concentrated suppliers raise input risk — gas ~65%, OPEC+ ~40%
Resonac faces high supplier power: petrochemical and industrial-gas markets are concentrated (top gas firms ~65%; OPEC+ ~40% oil supply in 2024), raising price and switching risk. Electronics-grade precursors have few qualified vendors; qualification >6 months and low-six-figure costs. Energy/import dependence (Japan LNG spot ~$14/MMBtu 2024; >90% critical metal imports) further boosts supplier leverage.
| Metric | Value (2024) |
|---|---|
| Industrial gas share | ~65% |
| OPEC+ oil output | ~40% |
| Japan metal import | >90% |
| JKM LNG avg | $14/MMBtu |
| Freight volatility | 20–40% |
What is included in the product
Detailed Word Document
Comprehensive Porter's Five Forces analysis tailored to Resonac, evaluating competitor rivalry, supplier and buyer power, threat of substitutes, and barriers to entry to reveal pricing pressures and profitability risks. Fully editable Word format for use in investor materials, strategic planning, and academic projects.
Customizable Excel Spreadsheet
A one-sheet Porter's Five Forces for Resonac with customizable pressure sliders and radar chart to quickly pinpoint strategic threats and reliefs—clean layout ready for pitch decks or Excel dashboards and easy for non-finance users with no macros required.
Customers Bargaining Power
Concentrated OEMs and fabs
Automotive OEMs, major semiconductor fabs and electronics leaders exert strong buyer power over Resonac due to scale, demanding price, quality and delivery terms. TSMC alone held about 54% of the global foundry market in 2024, illustrating concentration among key fab customers. Volume leverage enables multi-year pricing frameworks and long-term supply contracts. This concentration raises buyer bargaining power in critical segments.
High qualification, high switching costs
In chips and advanced materials qualification is lengthy and risk-sensitive, commonly taking 6–18 months and involving extensive reliability testing. Once specified, customers avoid switching because yield and long-term reliability risks can affect production continuity, which tempers buyer power after adoption. During pre-qualification buyers extract concessions such as trial pricing, qualification discounts and engineering support to de-risk selection.
Co-development stickiness
Joint R&D and custom formulations embed Resonac into customer roadmaps, creating technical lock-in that reduces product comparability and encourages long-term supply contracts. This embedded know-how blunts pure price bargaining by shifting negotiations toward technical support, delivery and co-development timelines. Customers may still push for IP sharing or cost-down clauses as a trade-off for deeper integration.
Cyclical demand and inventory swings
Downcycles in autos and semiconductors drive destocking and aggressive re-bidding, with buyers demanding price cuts, rebates and flexible MOQs; in 2024 buyers retained leverage during softer demand phases. When end-market upcycles tighten capacity, bargaining power shifts back toward suppliers. Resonac’s diverse portfolio cushions but does not eliminate these cyclical swings.
- Buyer pressure: price cuts, rebates, flexible MOQs
- Cycle flip: power shifts as capacity tightens
- Resonac: portfolio diversity moderates cyclicality
Backward integration threats
Large fabs and battery leaders including TSMC, Samsung and CATL publicly expanded upstream materials pilots in 2024, exploring in-house slurry, CMP and precursor capabilities, creating a credible partial-integration threat that strengthens customer bargaining power. OEMs increasingly dual-source or develop private-label components, pressuring margins; Resonac must offset this by differentiating on performance and service.
- Threat: upstream pilots by TSMC/Samsung/CATL (2024)
- OEM response: dual-sourcing/private labels
- Resonac action: focus on superior yield, service SLAs
Concentrated buyers (TSMC 54%) boost buyer leverage; 6-18m qual limits switching
Concentrated customers (TSMC 54% foundry share in 2024) give strong buyer power over Resonac via volume pricing, long-term contracts and strict Q/D terms. Lengthy qualification (6–18 months) reduces switching after adoption, shifting leverage to suppliers post-qualification. Downcycles in 2024 increased buyer demands for cuts/rebates; upstream pilots by TSMC/Samsung/CATL raise partial-integration threat.
| Metric | 2024 |
|---|---|
| TSMC foundry share | 54% |
| Qualification time | 6–18 months |
| Upstream pilots | TSMC, Samsung, CATL |
| Downcycle buyer leverage | High (price cuts/rebates) |
What You See Is What You Get
Resonac Porter's Five Forces Analysis
This preview displays the full Resonac Porter’s Five Forces Analysis you’ll receive upon purchase—no placeholders, no excerpts. It’s the same professionally written, formatted document ready for immediate download and use. Purchase grants instant access to this exact file with comprehensive competitive insights and strategic implications.











