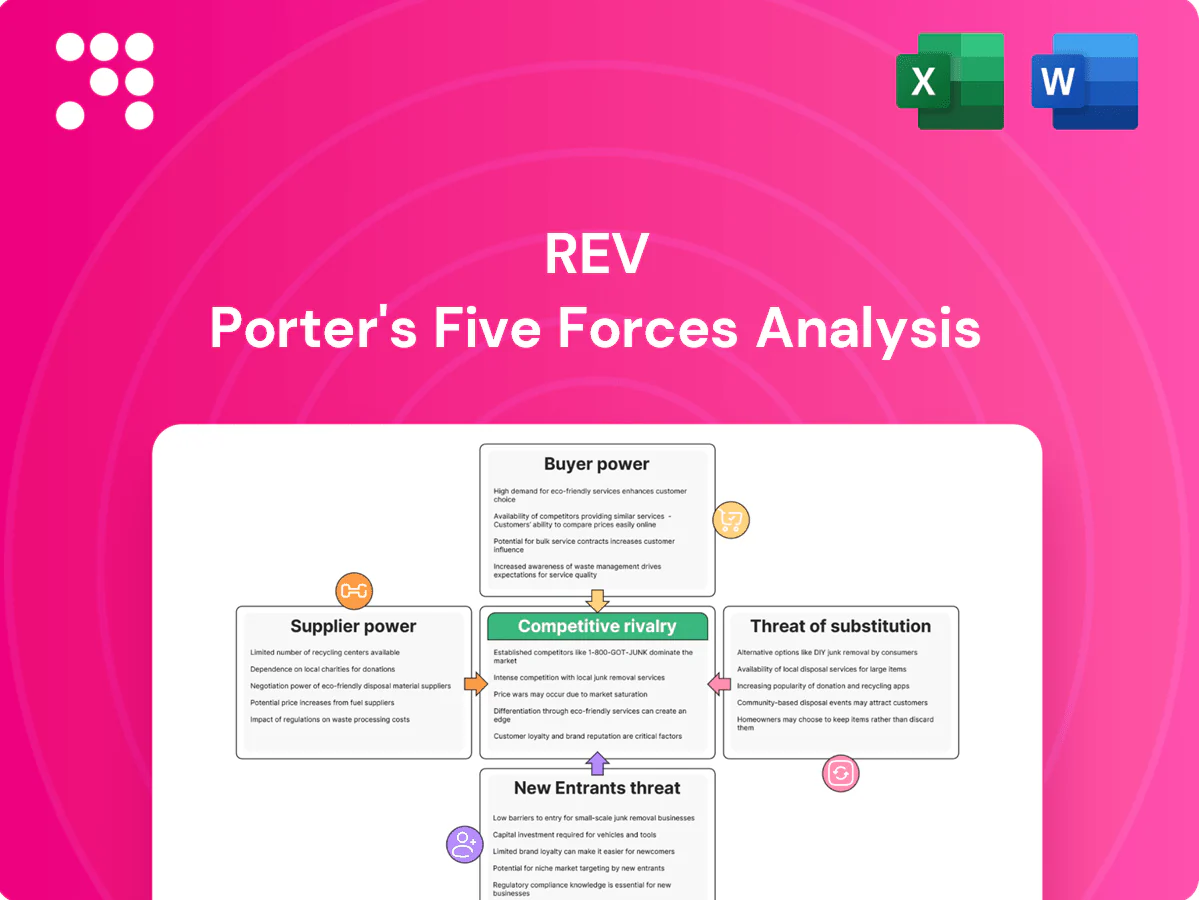
REV Porter's Five Forces Analysis

Elevate Your Analysis with the Complete Porter's Five Forces Analysis
REV’s Porter's Five Forces snapshot highlights supplier leverage, buyer power, competitive rivalry, threat of substitutes, and entry barriers, revealing where margin pressure and strategic advantage lie. This brief overview teases force-by-force ratings and implications. Unlock the full report for visuals, data-driven insights, and a consultant-grade breakdown to inform investment or strategy decisions.
Suppliers Bargaining Power

Concentrated critical components
Engines, chassis and transmissions for REV are sourced from a small set of dominant suppliers, with roughly 66% of REV powertrain volumes tied to three OEM partners in 2024, concentrating leverage with suppliers. Allocation policies from those suppliers can directly constrain REV’s build schedules and trim mix during peak demand windows. Supplier bargaining power notably rises when capacity utilization nears 90% or during platform transitions, tightening allocations and raising prices.
Specialized parts and compliance
Safety- and regulation-critical components narrow qualified suppliers because FMVSS comprises dozens of vehicle safety standards, NFPA publishes over 300 codes and standards (as of 2024), ADA was enacted in 1990 and EPA was established in 1970, all imposing certification hurdles that limit easy substitution. Certification requirements raise switching costs and reduce vendor pool size. This strengthens supplier influence over specs and delivery timelines.

Commodity volatility pass-through
Steel and aluminum price volatility—often swinging 15–30% between 2022–24 (HRC and LME ranges)—and electronics cost shocks materially raise COGS. Contractual pass-throughs to customers are imperfect and typically lag by quarters, while suppliers can impose surcharges within weeks, compressing OEM margins and widening working capital strain.

Dual-sourcing and value engineering
REV reduces supplier power through dual-sourcing and value engineering, using multiple vendors and design-to-spec approaches to avoid single points of failure; component standardization across platforms further dilutes any one supplier’s leverage. Effectiveness varies by vehicle segment and by component criticality, with critical chips and unique modules remaining harder to dual-source.
- Dual-sourcing reduces single-vendor risk
- Value engineering lowers custom dependency
- Platform standardization dilutes supplier influence
- High-criticality parts remain concentrated
Aftermarket lock-in dynamics
Proprietary parts ecosystems create steady lifecycle revenue for suppliers; 2024 industry data shows replacement-parts margins often range 20–50%, giving suppliers leverage when fielded fleets depend on specific components. REV mitigates this with its own aftermarket network, but unique OEM parts preserve supplier bargaining power and price flexibility.
- Aftermarket margins 20–50% (2024)
- Supplier leverage on unique parts
- REV aftermarket reduces but does not eliminate reliance
66% powertrain concentration and supplier caps above 90% tighten supply, lift costs
REV sources 66% of powertrains from three OEMs in 2024, concentrating supplier leverage.
Allocation constraints at >90% supplier capacity and platform transitions tighten supply and raise prices.
Steel/aluminum swung 15–30% (2022–24); electronics shocks and quick supplier surcharges compress margins.
Dual-sourcing, value engineering and REV aftermarket reduce but do not eliminate supplier power.
| Metric | 2024 |
|---|---|
| Powertrain concentration | 66% |
| Supplier capacity threshold | 90% |
| Metals vol. (2022–24) | 15–30% |
| Aftermarket margins | 20–50% |
What is included in the product
 Detailed Word Document
Concise Porter's Five Forces analysis for REV that uncovers competitive intensity, buyer and supplier bargaining power, threat of substitutes and new entrants, and identifies disruptive threats and entry barriers with strategic commentary and editable Word-ready format for investor decks and internal strategy.

 Customizable Excel Spreadsheet
Rapidly pinpoint competitive threats and strategic levers with REV’s one-sheet Five Forces snapshot—ideal for fast, boardroom-ready decisions and scenario comparisons.
Customers Bargaining Power

Large institutional purchasers
Municipalities, agencies and fleet operators place sizable, infrequent orders via competitive RFPs, leveraging scale and procurement rules to press pricing and contract terms; public procurement represents roughly 12% of GDP in OECD countries (latest OECD data). Award criteria routinely prioritize total cost of ownership and service commitments, shifting negotiations from unit price to lifecycle costs and guaranteed uptime.
High specification and customization
Buyers insist on tailored configurations for mission-critical use, making high-spec customization a baseline expectation in 2024. Custom specs increase switching costs by locking in integrations and validation cycles, yet they invite line-item price scrutiny during procurement. Buyers exploit structured competitive bids to extract value while preserving technical requirements, pressuring margins on configurable product lines.

Budget cycles and funding dependence
Public budgets, grants and fiscal calendars shape buying windows and price elasticity; OECD data show public procurement averages about 12% of GDP, concentrating buyer power around budget milestones. Deferred procurements in downturns compress demand and amplify buyer leverage, forcing longer payment terms and renegotiations. In upcycles urgency can reduce price pressure but raises exposure to delivery penalties, often structured at 1–5% of contract value.

Service, uptime, and warranties
- After-sales support = purchase driver
- SLAs: 99.9% vs 99.999%
- Extended warranties/training negotiated
- Strong service footprint lowers buyer power
Information parity and benchmarking
- Specs transparency
- Lifecycle analytics
- Procurement expertise
Procurement pressure: 12% GDP drives benchmarking cuts and SLA penalties
Large public fleets and agencies use RFPs and TCO criteria to press pricing; public procurement ≈12% of GDP (OECD 2024). Custom specs raise switching costs but invite line-item scrutiny; benchmarking cut supplier prices ~4% (2024). SLAs, warranties and service footprint drive negotiations—penalties typically 1–5% of contract value, uptime targets 99.9% vs 99.999%.
| Metric | 2024 Value |
|---|---|
| Public procurement share | ~12% GDP (OECD) |
| Benchmark price compression | ~4% |
| Uptime targets | 99.9% / 99.999% |
| Penalty range | 1–5% contract value |
Full Version Awaits
REV Porter's Five Forces Analysis
This preview shows the exact REV Porter's Five Forces Analysis you'll receive immediately after purchase—no placeholders or edits. The document is fully formatted, comprehensive, and ready for download and use the moment you buy. What you see is precisely what you'll get.

Elevate Your Analysis with the Complete Porter's Five Forces Analysis
REV’s Porter's Five Forces snapshot highlights supplier leverage, buyer power, competitive rivalry, threat of substitutes, and entry barriers, revealing where margin pressure and strategic advantage lie. This brief overview teases force-by-force ratings and implications. Unlock the full report for visuals, data-driven insights, and a consultant-grade breakdown to inform investment or strategy decisions.
Suppliers Bargaining Power
Concentrated critical components
Engines, chassis and transmissions for REV are sourced from a small set of dominant suppliers, with roughly 66% of REV powertrain volumes tied to three OEM partners in 2024, concentrating leverage with suppliers. Allocation policies from those suppliers can directly constrain REV’s build schedules and trim mix during peak demand windows. Supplier bargaining power notably rises when capacity utilization nears 90% or during platform transitions, tightening allocations and raising prices.
Specialized parts and compliance
Safety- and regulation-critical components narrow qualified suppliers because FMVSS comprises dozens of vehicle safety standards, NFPA publishes over 300 codes and standards (as of 2024), ADA was enacted in 1990 and EPA was established in 1970, all imposing certification hurdles that limit easy substitution. Certification requirements raise switching costs and reduce vendor pool size. This strengthens supplier influence over specs and delivery timelines.
Commodity volatility pass-through
Steel and aluminum price volatility—often swinging 15–30% between 2022–24 (HRC and LME ranges)—and electronics cost shocks materially raise COGS. Contractual pass-throughs to customers are imperfect and typically lag by quarters, while suppliers can impose surcharges within weeks, compressing OEM margins and widening working capital strain.
Dual-sourcing and value engineering
REV reduces supplier power through dual-sourcing and value engineering, using multiple vendors and design-to-spec approaches to avoid single points of failure; component standardization across platforms further dilutes any one supplier’s leverage. Effectiveness varies by vehicle segment and by component criticality, with critical chips and unique modules remaining harder to dual-source.
- Dual-sourcing reduces single-vendor risk
- Value engineering lowers custom dependency
- Platform standardization dilutes supplier influence
- High-criticality parts remain concentrated
Aftermarket lock-in dynamics
Proprietary parts ecosystems create steady lifecycle revenue for suppliers; 2024 industry data shows replacement-parts margins often range 20–50%, giving suppliers leverage when fielded fleets depend on specific components. REV mitigates this with its own aftermarket network, but unique OEM parts preserve supplier bargaining power and price flexibility.
- Aftermarket margins 20–50% (2024)
- Supplier leverage on unique parts
- REV aftermarket reduces but does not eliminate reliance
66% powertrain concentration and supplier caps above 90% tighten supply, lift costs
REV sources 66% of powertrains from three OEMs in 2024, concentrating supplier leverage.
Allocation constraints at >90% supplier capacity and platform transitions tighten supply and raise prices.
Steel/aluminum swung 15–30% (2022–24); electronics shocks and quick supplier surcharges compress margins.
Dual-sourcing, value engineering and REV aftermarket reduce but do not eliminate supplier power.
| Metric | 2024 |
|---|---|
| Powertrain concentration | 66% |
| Supplier capacity threshold | 90% |
| Metals vol. (2022–24) | 15–30% |
| Aftermarket margins | 20–50% |
What is included in the product
Detailed Word Document
Concise Porter's Five Forces analysis for REV that uncovers competitive intensity, buyer and supplier bargaining power, threat of substitutes and new entrants, and identifies disruptive threats and entry barriers with strategic commentary and editable Word-ready format for investor decks and internal strategy.
Customizable Excel Spreadsheet
Rapidly pinpoint competitive threats and strategic levers with REV’s one-sheet Five Forces snapshot—ideal for fast, boardroom-ready decisions and scenario comparisons.
Customers Bargaining Power
Large institutional purchasers
Municipalities, agencies and fleet operators place sizable, infrequent orders via competitive RFPs, leveraging scale and procurement rules to press pricing and contract terms; public procurement represents roughly 12% of GDP in OECD countries (latest OECD data). Award criteria routinely prioritize total cost of ownership and service commitments, shifting negotiations from unit price to lifecycle costs and guaranteed uptime.
High specification and customization
Buyers insist on tailored configurations for mission-critical use, making high-spec customization a baseline expectation in 2024. Custom specs increase switching costs by locking in integrations and validation cycles, yet they invite line-item price scrutiny during procurement. Buyers exploit structured competitive bids to extract value while preserving technical requirements, pressuring margins on configurable product lines.
Budget cycles and funding dependence
Public budgets, grants and fiscal calendars shape buying windows and price elasticity; OECD data show public procurement averages about 12% of GDP, concentrating buyer power around budget milestones. Deferred procurements in downturns compress demand and amplify buyer leverage, forcing longer payment terms and renegotiations. In upcycles urgency can reduce price pressure but raises exposure to delivery penalties, often structured at 1–5% of contract value.
Service, uptime, and warranties
- After-sales support = purchase driver
- SLAs: 99.9% vs 99.999%
- Extended warranties/training negotiated
- Strong service footprint lowers buyer power
Information parity and benchmarking
- Specs transparency
- Lifecycle analytics
- Procurement expertise
Procurement pressure: 12% GDP drives benchmarking cuts and SLA penalties
Large public fleets and agencies use RFPs and TCO criteria to press pricing; public procurement ≈12% of GDP (OECD 2024). Custom specs raise switching costs but invite line-item scrutiny; benchmarking cut supplier prices ~4% (2024). SLAs, warranties and service footprint drive negotiations—penalties typically 1–5% of contract value, uptime targets 99.9% vs 99.999%.
| Metric | 2024 Value |
|---|---|
| Public procurement share | ~12% GDP (OECD) |
| Benchmark price compression | ~4% |
| Uptime targets | 99.9% / 99.999% |
| Penalty range | 1–5% contract value |
Full Version Awaits
REV Porter's Five Forces Analysis
This preview shows the exact REV Porter's Five Forces Analysis you'll receive immediately after purchase—no placeholders or edits. The document is fully formatted, comprehensive, and ready for download and use the moment you buy. What you see is precisely what you'll get.
Description
Elevate Your Analysis with the Complete Porter's Five Forces Analysis
REV’s Porter's Five Forces snapshot highlights supplier leverage, buyer power, competitive rivalry, threat of substitutes, and entry barriers, revealing where margin pressure and strategic advantage lie. This brief overview teases force-by-force ratings and implications. Unlock the full report for visuals, data-driven insights, and a consultant-grade breakdown to inform investment or strategy decisions.
Suppliers Bargaining Power
Concentrated critical components
Engines, chassis and transmissions for REV are sourced from a small set of dominant suppliers, with roughly 66% of REV powertrain volumes tied to three OEM partners in 2024, concentrating leverage with suppliers. Allocation policies from those suppliers can directly constrain REV’s build schedules and trim mix during peak demand windows. Supplier bargaining power notably rises when capacity utilization nears 90% or during platform transitions, tightening allocations and raising prices.
Specialized parts and compliance
Safety- and regulation-critical components narrow qualified suppliers because FMVSS comprises dozens of vehicle safety standards, NFPA publishes over 300 codes and standards (as of 2024), ADA was enacted in 1990 and EPA was established in 1970, all imposing certification hurdles that limit easy substitution. Certification requirements raise switching costs and reduce vendor pool size. This strengthens supplier influence over specs and delivery timelines.
Commodity volatility pass-through
Steel and aluminum price volatility—often swinging 15–30% between 2022–24 (HRC and LME ranges)—and electronics cost shocks materially raise COGS. Contractual pass-throughs to customers are imperfect and typically lag by quarters, while suppliers can impose surcharges within weeks, compressing OEM margins and widening working capital strain.
Dual-sourcing and value engineering
REV reduces supplier power through dual-sourcing and value engineering, using multiple vendors and design-to-spec approaches to avoid single points of failure; component standardization across platforms further dilutes any one supplier’s leverage. Effectiveness varies by vehicle segment and by component criticality, with critical chips and unique modules remaining harder to dual-source.
- Dual-sourcing reduces single-vendor risk
- Value engineering lowers custom dependency
- Platform standardization dilutes supplier influence
- High-criticality parts remain concentrated
Aftermarket lock-in dynamics
Proprietary parts ecosystems create steady lifecycle revenue for suppliers; 2024 industry data shows replacement-parts margins often range 20–50%, giving suppliers leverage when fielded fleets depend on specific components. REV mitigates this with its own aftermarket network, but unique OEM parts preserve supplier bargaining power and price flexibility.
- Aftermarket margins 20–50% (2024)
- Supplier leverage on unique parts
- REV aftermarket reduces but does not eliminate reliance
66% powertrain concentration and supplier caps above 90% tighten supply, lift costs
REV sources 66% of powertrains from three OEMs in 2024, concentrating supplier leverage.
Allocation constraints at >90% supplier capacity and platform transitions tighten supply and raise prices.
Steel/aluminum swung 15–30% (2022–24); electronics shocks and quick supplier surcharges compress margins.
Dual-sourcing, value engineering and REV aftermarket reduce but do not eliminate supplier power.
| Metric | 2024 |
|---|---|
| Powertrain concentration | 66% |
| Supplier capacity threshold | 90% |
| Metals vol. (2022–24) | 15–30% |
| Aftermarket margins | 20–50% |
What is included in the product
Detailed Word Document
Concise Porter's Five Forces analysis for REV that uncovers competitive intensity, buyer and supplier bargaining power, threat of substitutes and new entrants, and identifies disruptive threats and entry barriers with strategic commentary and editable Word-ready format for investor decks and internal strategy.
Customizable Excel Spreadsheet
Rapidly pinpoint competitive threats and strategic levers with REV’s one-sheet Five Forces snapshot—ideal for fast, boardroom-ready decisions and scenario comparisons.
Customers Bargaining Power
Large institutional purchasers
Municipalities, agencies and fleet operators place sizable, infrequent orders via competitive RFPs, leveraging scale and procurement rules to press pricing and contract terms; public procurement represents roughly 12% of GDP in OECD countries (latest OECD data). Award criteria routinely prioritize total cost of ownership and service commitments, shifting negotiations from unit price to lifecycle costs and guaranteed uptime.
High specification and customization
Buyers insist on tailored configurations for mission-critical use, making high-spec customization a baseline expectation in 2024. Custom specs increase switching costs by locking in integrations and validation cycles, yet they invite line-item price scrutiny during procurement. Buyers exploit structured competitive bids to extract value while preserving technical requirements, pressuring margins on configurable product lines.
Budget cycles and funding dependence
Public budgets, grants and fiscal calendars shape buying windows and price elasticity; OECD data show public procurement averages about 12% of GDP, concentrating buyer power around budget milestones. Deferred procurements in downturns compress demand and amplify buyer leverage, forcing longer payment terms and renegotiations. In upcycles urgency can reduce price pressure but raises exposure to delivery penalties, often structured at 1–5% of contract value.
Service, uptime, and warranties
- After-sales support = purchase driver
- SLAs: 99.9% vs 99.999%
- Extended warranties/training negotiated
- Strong service footprint lowers buyer power
Information parity and benchmarking
- Specs transparency
- Lifecycle analytics
- Procurement expertise
Procurement pressure: 12% GDP drives benchmarking cuts and SLA penalties
Large public fleets and agencies use RFPs and TCO criteria to press pricing; public procurement ≈12% of GDP (OECD 2024). Custom specs raise switching costs but invite line-item scrutiny; benchmarking cut supplier prices ~4% (2024). SLAs, warranties and service footprint drive negotiations—penalties typically 1–5% of contract value, uptime targets 99.9% vs 99.999%.
| Metric | 2024 Value |
|---|---|
| Public procurement share | ~12% GDP (OECD) |
| Benchmark price compression | ~4% |
| Uptime targets | 99.9% / 99.999% |
| Penalty range | 1–5% contract value |
Full Version Awaits
REV Porter's Five Forces Analysis
This preview shows the exact REV Porter's Five Forces Analysis you'll receive immediately after purchase—no placeholders or edits. The document is fully formatted, comprehensive, and ready for download and use the moment you buy. What you see is precisely what you'll get.











