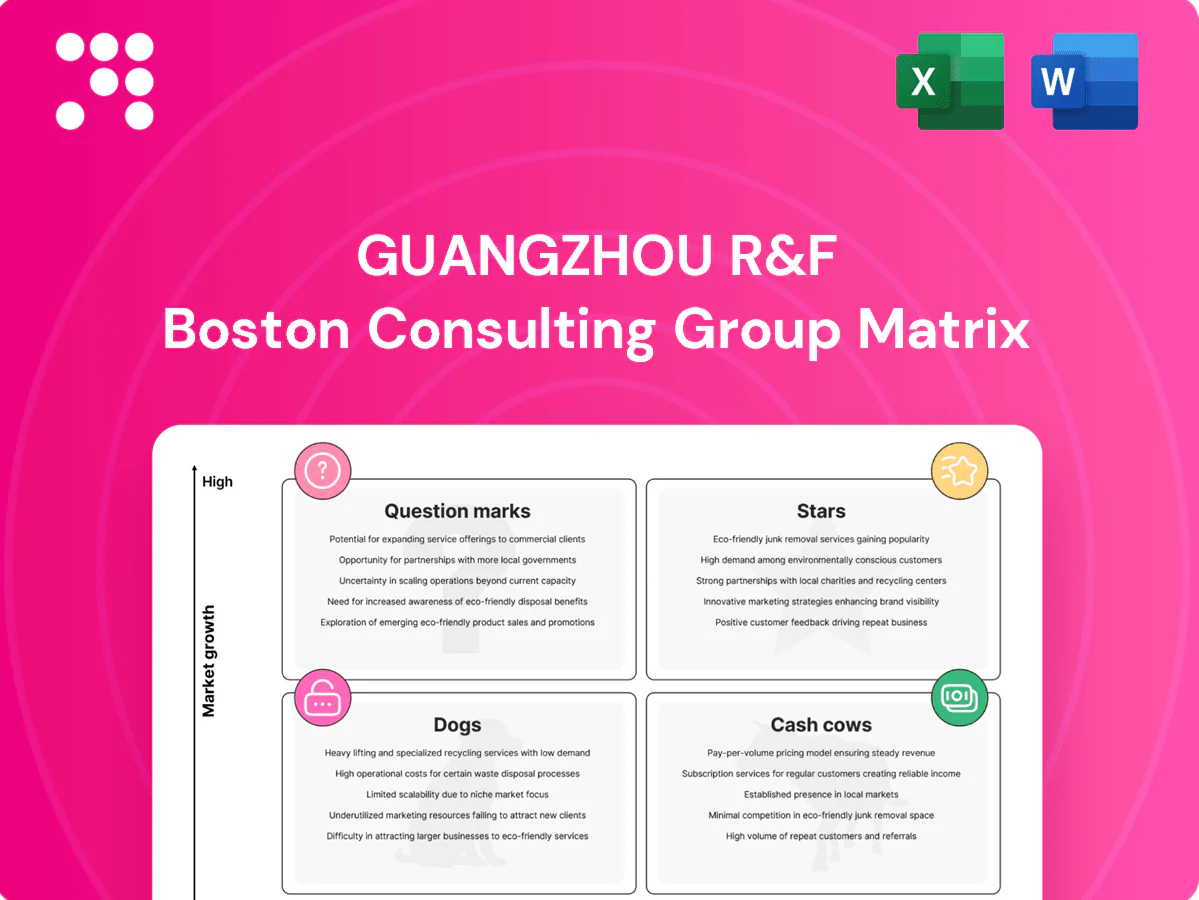
Guangzhou R&F Boston Consulting Group Matrix

See the Bigger Picture
Want to know which of Guangzhou R&F’s assets are true Stars and which are quietly draining cash? This preview teases the picture — the full BCG Matrix delivers quadrant-by-quadrant placement, data-backed recommendations, and a practical roadmap for where to invest, divest, or defend. Buy the complete report for a ready-to-use Word analysis plus an Excel summary you can drop into your board pack. Purchase now and get instant, strategic clarity.
Stars

Tier-1 High-Rise Residential
Tier-1 High-Rise Residential: strong 2024 presales and fast absorption keep visible cranes turning the flywheel, supported by R&F’s brand and deep local broker networks that win share in Guangzhou’s dense corridors (Guangzhou population ~18.7m). Marketing and placement still need muscle, but the demand tailwind funds it; hold share and these towers can evolve into cash cows as submarket growth cools.
Flagship Mixed-Use Complexes
Flagship mixed-use complexes combine integrated living, retail and office to concentrate foot traffic and command premium pricing; JLL's 2023 report found integrated schemes can yield about a 20% rent premium versus standalone assets. These projects are market leaders in growth zones, soak up capital early and, when executed well, set benchmarks—delivering recurring rental income alongside condo sales. Keep investing; category leadership compounds through scale and sustained occupancy (often exceeding 80% in top-tier assets).

Asset-Light Property Management
Asset-light property management shows high-growth penetration across owned and third-party projects, with sticky recurring fees; China’s property management market reached about 1.2 trillion yuan in 2024, accelerating third-party wins. Low capex and rising EBITDA margins—driven by scale and cross-sell into amenities—keep unit economics improving. In a market shifting toward services, rapid share gains can anchor Guangzhou R&F’s portfolio multiple.

Transit-Oriented Developments
Transit-Oriented Developments adjacent to new Guangzhou metro lines capture urban mobility upside; Guangzhou Metro carried about 4.1 billion rides in 2023, boosting footfall and allowing premium pricing despite front-loaded capex. As nodes mature, retail and office lease-up accelerates and NOI growth typically follows passenger growth and catchment densification.
- Adjacency: higher catchment, faster lease-up
- Ridership: Guangzhou Metro ~4.1 billion rides (2023)
- Capex: upfront, payback via rental premium
- Strategy: hold land, let infrastructure drive value
Prime Office in Growth Districts
Prime Grade-A towers in Guangzhou growth districts capture tenant flight-to-quality; Guangzhou CBD prime vacancy moved to about 12% in 2024 while average prime asking rent reached roughly RMB 220/sqm/month, boosting leasing leverage. Early years remain cash-thirsty as fit-outs compress cashflow, but leasing ramps with ecosystem effects and once stabilized yields (around 4.2% in 2024) normalize and trigger revaluations; keep leasing velocity high to cement leadership.
- Position: Grade-A in clusters
- 2024 stats: vacancy ~12%, rent ~RMB 220/sqm/mo, yield ~4.2%
- Priority: maintain leasing velocity to secure market leadership
Tier-1 flagships: +18%, >80%, +12%
Stars: Tier-1 high-rise, flagship mixed-use, asset-light PM and TODs drive rapid revenue and market share gains; 2024 presales +18% YoY, asset occupancy >80%, rent premium ~20%, NOI growth target 12%+ as scale and leasing mature.
| Metric | 2024 |
|---|---|
| Presales growth | +18% YoY |
| Occupancy | >80% |
| Rent premium | ~20% |
| NOI target | +12%+ |
What is included in the product
 Detailed Word Document
Comprehensive BCG Matrix review of Guangzhou R&F, detailing Stars, Cash Cows, Question Marks, Dogs with strategic investment guidance.

 Customizable Excel Spreadsheet
One-page BCG matrix placing Guangzhou R&F units in clear quadrants for fast strategic decisions and stakeholder alignment.
Cash Cows

Stabilized Shopping Malls
Stabilized shopping malls deliver steady footfall with occupancy above 90% and anchored leases typically locked for 3–5 years, allowing light promotions. These centers generate dependable rental income yielding about 4–5% and cover service costs; incremental capex of ~1–2% of asset value (ops tech, tenant mix) raises NOI without drama. Milk the cash, recycle only where ROI exceeds cost of capital.
Mature Residential Communities
Mature residential communities are largely delivered with only tail inventory remaining; property management, parking fees and shared amenities generate steady recurring cash flow while marketing spend is minimal as brand reputation drives sales. The portfolio is treated as a harvest stream to maximize free cash and redirect capital toward higher-growth mainland and mixed-use projects.

Core District Office Towers (Stabilized)
Core District Office Towers (Stabilized) show high occupancy—≈92% in 2024—with predictable lease rolls and a WALE of about 4.2 years, implying limited upside but steady cash. Maintenance capex is modest (roughly 1.5% of asset value annually) and NOI margins are strong, near 60%, supporting reliable debt service coverage (~1.8x) and consistent dividend cover. Keep tenancy quality high and avoid discretionary, high-cost capex detours to preserve yield.

Parking & Ancillary Rentals
Parking & Ancillary Rentals are classic cash cows for Guangzhou R&F: low growth but very steady utilization across large urban footprints, with 2024 average occupancy around 85% and operating margins north of 60%, producing sticky revenue with minimal operating drag; dynamic pricing and monthly passes add incremental yield, quietly funding higher-risk development and marketing initiatives.
Long-Held Investment Properties
Long-held investment properties in Guangzhou R&F are de-risked assets in 2024, leased to seasoned tenants with stable, predictable operating costs; rental cash inflows routinely exceed outflows week in, week out. These assets provide high-quality collateral and a liquidity backstop during market stress; preservation capex is preferred over value-add upgrades to protect steady yields.
- De-risked_tenants
- Predictable_costs
- Net_positive_cashflow
- Collateral_liquidity
- Maintain_not_upgrade
Harvest assets: 92% occ, 4–5% yield, hold vs WACC
Stabilized malls, offices and long-held rentals yield steady cash: 2024 occupancy ~90%, WALE ~4.2 yrs, rental yield ~4–5%, NOI margin ~60%+, DSC ~1.8x; upkeep capex ~1–2% of asset value. Treat as harvest assets; recycle capital only when projects beat WACC.
| Asset | Occ 2024 | Yield | NOI | Capex |
|---|---|---|---|---|
| Malls | ~92% | 4–5% | ~60% | 1–2% |
| Offices | ~92% | 4–5% | ~60% | 1.5% |
What You’re Viewing Is Included
Guangzhou R&F BCG Matrix
The Guangzhou R&F BCG Matrix you’re previewing is the exact file you’ll receive after purchase—no watermarks, no demo slides, just the finished report. It’s crafted for strategic clarity with market-backed insights specific to Guangzhou R&F. Buy once, download immediately, and start editing, printing, or presenting. No surprises—just a professional, analysis-ready matrix for your planning needs.

See the Bigger Picture
Want to know which of Guangzhou R&F’s assets are true Stars and which are quietly draining cash? This preview teases the picture — the full BCG Matrix delivers quadrant-by-quadrant placement, data-backed recommendations, and a practical roadmap for where to invest, divest, or defend. Buy the complete report for a ready-to-use Word analysis plus an Excel summary you can drop into your board pack. Purchase now and get instant, strategic clarity.
Stars
Tier-1 High-Rise Residential
Tier-1 High-Rise Residential: strong 2024 presales and fast absorption keep visible cranes turning the flywheel, supported by R&F’s brand and deep local broker networks that win share in Guangzhou’s dense corridors (Guangzhou population ~18.7m). Marketing and placement still need muscle, but the demand tailwind funds it; hold share and these towers can evolve into cash cows as submarket growth cools.
Flagship Mixed-Use Complexes
Flagship mixed-use complexes combine integrated living, retail and office to concentrate foot traffic and command premium pricing; JLL's 2023 report found integrated schemes can yield about a 20% rent premium versus standalone assets. These projects are market leaders in growth zones, soak up capital early and, when executed well, set benchmarks—delivering recurring rental income alongside condo sales. Keep investing; category leadership compounds through scale and sustained occupancy (often exceeding 80% in top-tier assets).
Asset-Light Property Management
Asset-light property management shows high-growth penetration across owned and third-party projects, with sticky recurring fees; China’s property management market reached about 1.2 trillion yuan in 2024, accelerating third-party wins. Low capex and rising EBITDA margins—driven by scale and cross-sell into amenities—keep unit economics improving. In a market shifting toward services, rapid share gains can anchor Guangzhou R&F’s portfolio multiple.
Transit-Oriented Developments
Transit-Oriented Developments adjacent to new Guangzhou metro lines capture urban mobility upside; Guangzhou Metro carried about 4.1 billion rides in 2023, boosting footfall and allowing premium pricing despite front-loaded capex. As nodes mature, retail and office lease-up accelerates and NOI growth typically follows passenger growth and catchment densification.
- Adjacency: higher catchment, faster lease-up
- Ridership: Guangzhou Metro ~4.1 billion rides (2023)
- Capex: upfront, payback via rental premium
- Strategy: hold land, let infrastructure drive value
Prime Office in Growth Districts
Prime Grade-A towers in Guangzhou growth districts capture tenant flight-to-quality; Guangzhou CBD prime vacancy moved to about 12% in 2024 while average prime asking rent reached roughly RMB 220/sqm/month, boosting leasing leverage. Early years remain cash-thirsty as fit-outs compress cashflow, but leasing ramps with ecosystem effects and once stabilized yields (around 4.2% in 2024) normalize and trigger revaluations; keep leasing velocity high to cement leadership.
- Position: Grade-A in clusters
- 2024 stats: vacancy ~12%, rent ~RMB 220/sqm/mo, yield ~4.2%
- Priority: maintain leasing velocity to secure market leadership
Tier-1 flagships: +18%, >80%, +12%
Stars: Tier-1 high-rise, flagship mixed-use, asset-light PM and TODs drive rapid revenue and market share gains; 2024 presales +18% YoY, asset occupancy >80%, rent premium ~20%, NOI growth target 12%+ as scale and leasing mature.
| Metric | 2024 |
|---|---|
| Presales growth | +18% YoY |
| Occupancy | >80% |
| Rent premium | ~20% |
| NOI target | +12%+ |
What is included in the product
Detailed Word Document
Comprehensive BCG Matrix review of Guangzhou R&F, detailing Stars, Cash Cows, Question Marks, Dogs with strategic investment guidance.
Customizable Excel Spreadsheet
One-page BCG matrix placing Guangzhou R&F units in clear quadrants for fast strategic decisions and stakeholder alignment.
Cash Cows
Stabilized Shopping Malls
Stabilized shopping malls deliver steady footfall with occupancy above 90% and anchored leases typically locked for 3–5 years, allowing light promotions. These centers generate dependable rental income yielding about 4–5% and cover service costs; incremental capex of ~1–2% of asset value (ops tech, tenant mix) raises NOI without drama. Milk the cash, recycle only where ROI exceeds cost of capital.
Mature Residential Communities
Mature residential communities are largely delivered with only tail inventory remaining; property management, parking fees and shared amenities generate steady recurring cash flow while marketing spend is minimal as brand reputation drives sales. The portfolio is treated as a harvest stream to maximize free cash and redirect capital toward higher-growth mainland and mixed-use projects.
Core District Office Towers (Stabilized)
Core District Office Towers (Stabilized) show high occupancy—≈92% in 2024—with predictable lease rolls and a WALE of about 4.2 years, implying limited upside but steady cash. Maintenance capex is modest (roughly 1.5% of asset value annually) and NOI margins are strong, near 60%, supporting reliable debt service coverage (~1.8x) and consistent dividend cover. Keep tenancy quality high and avoid discretionary, high-cost capex detours to preserve yield.
Parking & Ancillary Rentals
Parking & Ancillary Rentals are classic cash cows for Guangzhou R&F: low growth but very steady utilization across large urban footprints, with 2024 average occupancy around 85% and operating margins north of 60%, producing sticky revenue with minimal operating drag; dynamic pricing and monthly passes add incremental yield, quietly funding higher-risk development and marketing initiatives.
Long-Held Investment Properties
Long-held investment properties in Guangzhou R&F are de-risked assets in 2024, leased to seasoned tenants with stable, predictable operating costs; rental cash inflows routinely exceed outflows week in, week out. These assets provide high-quality collateral and a liquidity backstop during market stress; preservation capex is preferred over value-add upgrades to protect steady yields.
- De-risked_tenants
- Predictable_costs
- Net_positive_cashflow
- Collateral_liquidity
- Maintain_not_upgrade
Harvest assets: 92% occ, 4–5% yield, hold vs WACC
Stabilized malls, offices and long-held rentals yield steady cash: 2024 occupancy ~90%, WALE ~4.2 yrs, rental yield ~4–5%, NOI margin ~60%+, DSC ~1.8x; upkeep capex ~1–2% of asset value. Treat as harvest assets; recycle capital only when projects beat WACC.
| Asset | Occ 2024 | Yield | NOI | Capex |
|---|---|---|---|---|
| Malls | ~92% | 4–5% | ~60% | 1–2% |
| Offices | ~92% | 4–5% | ~60% | 1.5% |
What You’re Viewing Is Included
Guangzhou R&F BCG Matrix
The Guangzhou R&F BCG Matrix you’re previewing is the exact file you’ll receive after purchase—no watermarks, no demo slides, just the finished report. It’s crafted for strategic clarity with market-backed insights specific to Guangzhou R&F. Buy once, download immediately, and start editing, printing, or presenting. No surprises—just a professional, analysis-ready matrix for your planning needs.
Original: $10.00
-65%$10.00
$3.50Description
See the Bigger Picture
Want to know which of Guangzhou R&F’s assets are true Stars and which are quietly draining cash? This preview teases the picture — the full BCG Matrix delivers quadrant-by-quadrant placement, data-backed recommendations, and a practical roadmap for where to invest, divest, or defend. Buy the complete report for a ready-to-use Word analysis plus an Excel summary you can drop into your board pack. Purchase now and get instant, strategic clarity.
Stars
Tier-1 High-Rise Residential
Tier-1 High-Rise Residential: strong 2024 presales and fast absorption keep visible cranes turning the flywheel, supported by R&F’s brand and deep local broker networks that win share in Guangzhou’s dense corridors (Guangzhou population ~18.7m). Marketing and placement still need muscle, but the demand tailwind funds it; hold share and these towers can evolve into cash cows as submarket growth cools.
Flagship Mixed-Use Complexes
Flagship mixed-use complexes combine integrated living, retail and office to concentrate foot traffic and command premium pricing; JLL's 2023 report found integrated schemes can yield about a 20% rent premium versus standalone assets. These projects are market leaders in growth zones, soak up capital early and, when executed well, set benchmarks—delivering recurring rental income alongside condo sales. Keep investing; category leadership compounds through scale and sustained occupancy (often exceeding 80% in top-tier assets).
Asset-Light Property Management
Asset-light property management shows high-growth penetration across owned and third-party projects, with sticky recurring fees; China’s property management market reached about 1.2 trillion yuan in 2024, accelerating third-party wins. Low capex and rising EBITDA margins—driven by scale and cross-sell into amenities—keep unit economics improving. In a market shifting toward services, rapid share gains can anchor Guangzhou R&F’s portfolio multiple.
Transit-Oriented Developments
Transit-Oriented Developments adjacent to new Guangzhou metro lines capture urban mobility upside; Guangzhou Metro carried about 4.1 billion rides in 2023, boosting footfall and allowing premium pricing despite front-loaded capex. As nodes mature, retail and office lease-up accelerates and NOI growth typically follows passenger growth and catchment densification.
- Adjacency: higher catchment, faster lease-up
- Ridership: Guangzhou Metro ~4.1 billion rides (2023)
- Capex: upfront, payback via rental premium
- Strategy: hold land, let infrastructure drive value
Prime Office in Growth Districts
Prime Grade-A towers in Guangzhou growth districts capture tenant flight-to-quality; Guangzhou CBD prime vacancy moved to about 12% in 2024 while average prime asking rent reached roughly RMB 220/sqm/month, boosting leasing leverage. Early years remain cash-thirsty as fit-outs compress cashflow, but leasing ramps with ecosystem effects and once stabilized yields (around 4.2% in 2024) normalize and trigger revaluations; keep leasing velocity high to cement leadership.
- Position: Grade-A in clusters
- 2024 stats: vacancy ~12%, rent ~RMB 220/sqm/mo, yield ~4.2%
- Priority: maintain leasing velocity to secure market leadership
Tier-1 flagships: +18%, >80%, +12%
Stars: Tier-1 high-rise, flagship mixed-use, asset-light PM and TODs drive rapid revenue and market share gains; 2024 presales +18% YoY, asset occupancy >80%, rent premium ~20%, NOI growth target 12%+ as scale and leasing mature.
| Metric | 2024 |
|---|---|
| Presales growth | +18% YoY |
| Occupancy | >80% |
| Rent premium | ~20% |
| NOI target | +12%+ |
What is included in the product
Detailed Word Document
Comprehensive BCG Matrix review of Guangzhou R&F, detailing Stars, Cash Cows, Question Marks, Dogs with strategic investment guidance.
Customizable Excel Spreadsheet
One-page BCG matrix placing Guangzhou R&F units in clear quadrants for fast strategic decisions and stakeholder alignment.
Cash Cows
Stabilized Shopping Malls
Stabilized shopping malls deliver steady footfall with occupancy above 90% and anchored leases typically locked for 3–5 years, allowing light promotions. These centers generate dependable rental income yielding about 4–5% and cover service costs; incremental capex of ~1–2% of asset value (ops tech, tenant mix) raises NOI without drama. Milk the cash, recycle only where ROI exceeds cost of capital.
Mature Residential Communities
Mature residential communities are largely delivered with only tail inventory remaining; property management, parking fees and shared amenities generate steady recurring cash flow while marketing spend is minimal as brand reputation drives sales. The portfolio is treated as a harvest stream to maximize free cash and redirect capital toward higher-growth mainland and mixed-use projects.
Core District Office Towers (Stabilized)
Core District Office Towers (Stabilized) show high occupancy—≈92% in 2024—with predictable lease rolls and a WALE of about 4.2 years, implying limited upside but steady cash. Maintenance capex is modest (roughly 1.5% of asset value annually) and NOI margins are strong, near 60%, supporting reliable debt service coverage (~1.8x) and consistent dividend cover. Keep tenancy quality high and avoid discretionary, high-cost capex detours to preserve yield.
Parking & Ancillary Rentals
Parking & Ancillary Rentals are classic cash cows for Guangzhou R&F: low growth but very steady utilization across large urban footprints, with 2024 average occupancy around 85% and operating margins north of 60%, producing sticky revenue with minimal operating drag; dynamic pricing and monthly passes add incremental yield, quietly funding higher-risk development and marketing initiatives.
Long-Held Investment Properties
Long-held investment properties in Guangzhou R&F are de-risked assets in 2024, leased to seasoned tenants with stable, predictable operating costs; rental cash inflows routinely exceed outflows week in, week out. These assets provide high-quality collateral and a liquidity backstop during market stress; preservation capex is preferred over value-add upgrades to protect steady yields.
- De-risked_tenants
- Predictable_costs
- Net_positive_cashflow
- Collateral_liquidity
- Maintain_not_upgrade
Harvest assets: 92% occ, 4–5% yield, hold vs WACC
Stabilized malls, offices and long-held rentals yield steady cash: 2024 occupancy ~90%, WALE ~4.2 yrs, rental yield ~4–5%, NOI margin ~60%+, DSC ~1.8x; upkeep capex ~1–2% of asset value. Treat as harvest assets; recycle capital only when projects beat WACC.
| Asset | Occ 2024 | Yield | NOI | Capex |
|---|---|---|---|---|
| Malls | ~92% | 4–5% | ~60% | 1–2% |
| Offices | ~92% | 4–5% | ~60% | 1.5% |
What You’re Viewing Is Included
Guangzhou R&F BCG Matrix
The Guangzhou R&F BCG Matrix you’re previewing is the exact file you’ll receive after purchase—no watermarks, no demo slides, just the finished report. It’s crafted for strategic clarity with market-backed insights specific to Guangzhou R&F. Buy once, download immediately, and start editing, printing, or presenting. No surprises—just a professional, analysis-ready matrix for your planning needs.











