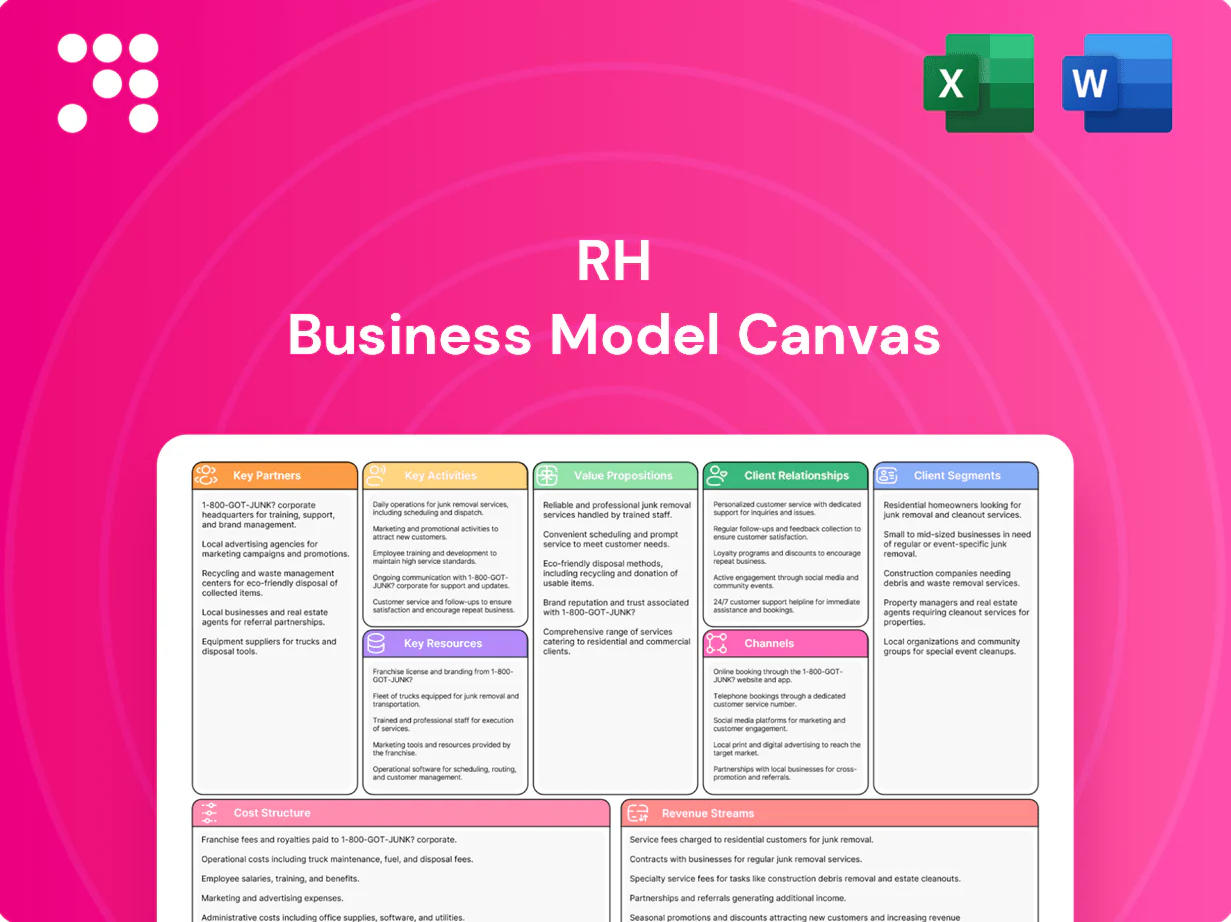
RH Business Model Canvas

Unlock premium-design retail playbook: Business Model Canvas, revenue & cost maps
Unlock the full strategic blueprint behind RH’s business model and discover how premium design, curated product ecosystems, and experiential retail drive value. This in-depth Business Model Canvas maps customer segments, revenue streams, and cost structure with actionable clarity. Download the complete Word and Excel files to benchmark, strategize, and apply RH’s playbook to your business or investment thesis.
Partnerships

Artisan manufacturers
Partnerships with premium furniture, lighting, and textile makers secure consistent quality and channel-exclusive assortments, supporting RH’s product mix that contributed to $3.35 billion in net revenue in FY2024. Co-development agreements yield proprietary designs and finishes, reducing time-to-market and protecting margins. Multi-year contracts stabilize pricing and lock capacity against commodity swings, while ethical sourcing partners enforce traceability and social compliance across supply chains.
Logistics and white-glove delivery
Specialized carriers enable careful handling of large, delicate RH pieces, reducing transit damage for high-ticket items; RH reported approximately $3.3 billion in net revenue in fiscal 2024, underscoring scale. White-glove teams provide in-room placement, assembly, and debris removal, improving customer satisfaction. Integrated tracking boosts transparency with real-time updates, and reverse logistics—handling returns and repairs—addresses the industry e-commerce return rate near 16%.

Designers and architects (trade)
Trade designers and architects shape specifications and drive project volume for RH, leveraging about 90 galleries in 2024 to convert briefs into orders; preferred pricing and dedicated trade support programs increase repeat business and loyalty; joint showroom collaborations boost foot traffic and portfolio visibility; targeted co-marketing in luxury segments amplifies brand reach and high-ticket conversion rates.

Real estate and hospitality developers
Developers and hotels demand turnkey furnishing at scale for model homes, residences and boutique properties; 2024 STR data shows the global hotel pipeline exceeded 100,000 rooms, driving steady volume needs. Contracted agreements streamline demand planning and reduce lead times, while on-site installations serve as living showrooms that convert developers and operators into new clients.
Print, digital, and tech vendors
Print, digital, and tech vendors supply book printers and creatives that deliver brand-defining content; digital platforms power e-commerce, personalization, and CRM while data partners improve targeting and measurement; photography and 3D vendors enrich product visualization and lift engagement and conversion.
- e-commerce > $6T global sales in 2024
- CRM market ~ $80B+ in 2024
- personalization boosts conversions 10–30%
- 3D/AR increases product engagement ~20–40%
Partners power scale: $3.35B; 90; >100k rooms; >$6T e-comm; ~$80B CRM
Strategic suppliers, logistics, trade partners, developers/hotels and tech vendors underpin RH’s margins and scale: $3.35B net rev FY2024; 90 galleries; hotel pipeline >100,000 rooms; e-comm >$6T (2024); CRM ~$80B (2024).
| Partner | Key metric (2024) |
|---|---|
| Suppliers | $3.35B rev |
| Galleries/Trade | 90 galleries |
| Hotels/Developers | >100,000 rooms |
| Tech/CRM | e-comm >$6T; CRM ~$80B |
What is included in the product
 Detailed Word Document
A comprehensive RH Business Model Canvas outlining the company’s strategy across customer segments, value propositions, channels, and revenue streams. Organized into the 9 classic BMC blocks with narrative, SWOT-linked insights, competitive advantages, and polished presentation for investor discussions and internal planning.

 Customizable Excel Spreadsheet
Condenses RH’s strategy into a digestible one-page canvas with editable cells, saving hours of formatting while helping teams quickly identify core components, collaborate, and adapt models for boardrooms or fast deliverables.
Activities

Design and curation
Concepting and selecting collections defines RHs brand aesthetic and drove product-led growth in fiscal 2024 when RH reported approximately $3.7 billion in net revenue, underscoring the payoff of curated assortments. Seasonal refreshes keep assortments relevant and support repeat purchase cycles. Material and finish development differentiates product quality and margin. Regular vendor audits ensure craftsmanship, regulatory compliance, and supply-chain resilience.
Gallery merchandising
Immersive room sets in RH galleries showcase complete looks to drive attachment and higher average order values; RH operates 100+ galleries as of 2024. Visual standards and regular floor changes create fresh inspiration and repeat visits. Staff training calibrates white‑glove service to luxury expectations. In‑gallery events boost foot traffic and conversion by creating timed urgency and social buzz.

Omnichannel operations
RH unifies e-commerce, mobile, and gallery systems for seamless shopping, supporting its $3.68B FY2024 revenue. Real-time inventory visibility enables ship-from-store and pickup across the gallery footprint. Payment, financing, and checkout are optimized for high-ticket transactions, and omnichannel customer service resolves inquiries across channels.

Supply chain and quality control
Demand-driven forecasting and procurement balance lead times and customer demand to cut stockouts; e-commerce return rates average about 16% (2023–24), so tighter forecasting reduces excess inventory. Rigorous quality inspections lower returns and protect brand equity, while consolidation and smarter routing can trim freight spend by up to 15%. Coordinated installation scheduling lifts first-time delivery and installation success toward 95%.
- Forecasting: reduces stockouts and excess inventory
- Quality inspections: lower returns vs ~16% e‑commerce baseline
- Consolidation/routing: freight cost savings up to 15%
- Installation scheduling: first‑time success ~95%
Interior design services
Consultations translate customer vision into cohesive plans, turning briefs into measurable deliverables; the global interior design market was estimated at $143.2 billion in 2024. Space planning, mood boards, and material guidance increase perceived value and can raise project margins by 15–25%. Project management coordinates orders, timelines, and installations to cut delays and cost overruns. Post-install follow-ups sustain satisfaction and referral rates.
- Consultations → scope, deliverables, KPIs
- Space planning → efficiency, flow, value uplift
- Project management → vendor coordination, timelines
- Follow-ups → retention, referrals
Curated collections and 100+ galleries drove $3.7B in FY2024
RH focuses on curated collections and seasonal refreshes that drove ~$3.7B net revenue in FY2024, immersive galleries (100+ in 2024) to lift AOV, and omnichannel tech for real-time inventory enabling ship‑from‑store. Demand‑driven procurement, quality inspections and routing reduce returns (~16% e‑commerce) and cut freight by up to 15%, with installation success near 95%.
| Metric | 2024 Value |
|---|---|
| Net revenue | $3.7B |
| Galleries | 100+ |
| E‑comm returns | ~16% |
| Installation success | ~95% |
| Freight savings | up to 15% |
Delivered as Displayed
Business Model Canvas
The RH Business Model Canvas previewed here is the exact deliverable, not a mockup or sample. When you purchase, you’ll receive this same complete, professionally formatted document—ready to edit and present. Files are provided in Word and Excel for immediate use.

Unlock premium-design retail playbook: Business Model Canvas, revenue & cost maps
Unlock the full strategic blueprint behind RH’s business model and discover how premium design, curated product ecosystems, and experiential retail drive value. This in-depth Business Model Canvas maps customer segments, revenue streams, and cost structure with actionable clarity. Download the complete Word and Excel files to benchmark, strategize, and apply RH’s playbook to your business or investment thesis.
Partnerships
Artisan manufacturers
Partnerships with premium furniture, lighting, and textile makers secure consistent quality and channel-exclusive assortments, supporting RH’s product mix that contributed to $3.35 billion in net revenue in FY2024. Co-development agreements yield proprietary designs and finishes, reducing time-to-market and protecting margins. Multi-year contracts stabilize pricing and lock capacity against commodity swings, while ethical sourcing partners enforce traceability and social compliance across supply chains.
Logistics and white-glove delivery
Specialized carriers enable careful handling of large, delicate RH pieces, reducing transit damage for high-ticket items; RH reported approximately $3.3 billion in net revenue in fiscal 2024, underscoring scale. White-glove teams provide in-room placement, assembly, and debris removal, improving customer satisfaction. Integrated tracking boosts transparency with real-time updates, and reverse logistics—handling returns and repairs—addresses the industry e-commerce return rate near 16%.
Designers and architects (trade)
Trade designers and architects shape specifications and drive project volume for RH, leveraging about 90 galleries in 2024 to convert briefs into orders; preferred pricing and dedicated trade support programs increase repeat business and loyalty; joint showroom collaborations boost foot traffic and portfolio visibility; targeted co-marketing in luxury segments amplifies brand reach and high-ticket conversion rates.
Real estate and hospitality developers
Developers and hotels demand turnkey furnishing at scale for model homes, residences and boutique properties; 2024 STR data shows the global hotel pipeline exceeded 100,000 rooms, driving steady volume needs. Contracted agreements streamline demand planning and reduce lead times, while on-site installations serve as living showrooms that convert developers and operators into new clients.
Print, digital, and tech vendors
Print, digital, and tech vendors supply book printers and creatives that deliver brand-defining content; digital platforms power e-commerce, personalization, and CRM while data partners improve targeting and measurement; photography and 3D vendors enrich product visualization and lift engagement and conversion.
- e-commerce > $6T global sales in 2024
- CRM market ~ $80B+ in 2024
- personalization boosts conversions 10–30%
- 3D/AR increases product engagement ~20–40%
Partners power scale: $3.35B; 90; >100k rooms; >$6T e-comm; ~$80B CRM
Strategic suppliers, logistics, trade partners, developers/hotels and tech vendors underpin RH’s margins and scale: $3.35B net rev FY2024; 90 galleries; hotel pipeline >100,000 rooms; e-comm >$6T (2024); CRM ~$80B (2024).
| Partner | Key metric (2024) |
|---|---|
| Suppliers | $3.35B rev |
| Galleries/Trade | 90 galleries |
| Hotels/Developers | >100,000 rooms |
| Tech/CRM | e-comm >$6T; CRM ~$80B |
What is included in the product
Detailed Word Document
A comprehensive RH Business Model Canvas outlining the company’s strategy across customer segments, value propositions, channels, and revenue streams. Organized into the 9 classic BMC blocks with narrative, SWOT-linked insights, competitive advantages, and polished presentation for investor discussions and internal planning.
Customizable Excel Spreadsheet
Condenses RH’s strategy into a digestible one-page canvas with editable cells, saving hours of formatting while helping teams quickly identify core components, collaborate, and adapt models for boardrooms or fast deliverables.
Activities
Design and curation
Concepting and selecting collections defines RHs brand aesthetic and drove product-led growth in fiscal 2024 when RH reported approximately $3.7 billion in net revenue, underscoring the payoff of curated assortments. Seasonal refreshes keep assortments relevant and support repeat purchase cycles. Material and finish development differentiates product quality and margin. Regular vendor audits ensure craftsmanship, regulatory compliance, and supply-chain resilience.
Gallery merchandising
Immersive room sets in RH galleries showcase complete looks to drive attachment and higher average order values; RH operates 100+ galleries as of 2024. Visual standards and regular floor changes create fresh inspiration and repeat visits. Staff training calibrates white‑glove service to luxury expectations. In‑gallery events boost foot traffic and conversion by creating timed urgency and social buzz.
Omnichannel operations
RH unifies e-commerce, mobile, and gallery systems for seamless shopping, supporting its $3.68B FY2024 revenue. Real-time inventory visibility enables ship-from-store and pickup across the gallery footprint. Payment, financing, and checkout are optimized for high-ticket transactions, and omnichannel customer service resolves inquiries across channels.
Supply chain and quality control
Demand-driven forecasting and procurement balance lead times and customer demand to cut stockouts; e-commerce return rates average about 16% (2023–24), so tighter forecasting reduces excess inventory. Rigorous quality inspections lower returns and protect brand equity, while consolidation and smarter routing can trim freight spend by up to 15%. Coordinated installation scheduling lifts first-time delivery and installation success toward 95%.
- Forecasting: reduces stockouts and excess inventory
- Quality inspections: lower returns vs ~16% e‑commerce baseline
- Consolidation/routing: freight cost savings up to 15%
- Installation scheduling: first‑time success ~95%
Interior design services
Consultations translate customer vision into cohesive plans, turning briefs into measurable deliverables; the global interior design market was estimated at $143.2 billion in 2024. Space planning, mood boards, and material guidance increase perceived value and can raise project margins by 15–25%. Project management coordinates orders, timelines, and installations to cut delays and cost overruns. Post-install follow-ups sustain satisfaction and referral rates.
- Consultations → scope, deliverables, KPIs
- Space planning → efficiency, flow, value uplift
- Project management → vendor coordination, timelines
- Follow-ups → retention, referrals
Curated collections and 100+ galleries drove $3.7B in FY2024
RH focuses on curated collections and seasonal refreshes that drove ~$3.7B net revenue in FY2024, immersive galleries (100+ in 2024) to lift AOV, and omnichannel tech for real-time inventory enabling ship‑from‑store. Demand‑driven procurement, quality inspections and routing reduce returns (~16% e‑commerce) and cut freight by up to 15%, with installation success near 95%.
| Metric | 2024 Value |
|---|---|
| Net revenue | $3.7B |
| Galleries | 100+ |
| E‑comm returns | ~16% |
| Installation success | ~95% |
| Freight savings | up to 15% |
Delivered as Displayed
Business Model Canvas
The RH Business Model Canvas previewed here is the exact deliverable, not a mockup or sample. When you purchase, you’ll receive this same complete, professionally formatted document—ready to edit and present. Files are provided in Word and Excel for immediate use.
Original: $10.00
-65%$10.00
$3.50Description
Unlock premium-design retail playbook: Business Model Canvas, revenue & cost maps
Unlock the full strategic blueprint behind RH’s business model and discover how premium design, curated product ecosystems, and experiential retail drive value. This in-depth Business Model Canvas maps customer segments, revenue streams, and cost structure with actionable clarity. Download the complete Word and Excel files to benchmark, strategize, and apply RH’s playbook to your business or investment thesis.
Partnerships
Artisan manufacturers
Partnerships with premium furniture, lighting, and textile makers secure consistent quality and channel-exclusive assortments, supporting RH’s product mix that contributed to $3.35 billion in net revenue in FY2024. Co-development agreements yield proprietary designs and finishes, reducing time-to-market and protecting margins. Multi-year contracts stabilize pricing and lock capacity against commodity swings, while ethical sourcing partners enforce traceability and social compliance across supply chains.
Logistics and white-glove delivery
Specialized carriers enable careful handling of large, delicate RH pieces, reducing transit damage for high-ticket items; RH reported approximately $3.3 billion in net revenue in fiscal 2024, underscoring scale. White-glove teams provide in-room placement, assembly, and debris removal, improving customer satisfaction. Integrated tracking boosts transparency with real-time updates, and reverse logistics—handling returns and repairs—addresses the industry e-commerce return rate near 16%.
Designers and architects (trade)
Trade designers and architects shape specifications and drive project volume for RH, leveraging about 90 galleries in 2024 to convert briefs into orders; preferred pricing and dedicated trade support programs increase repeat business and loyalty; joint showroom collaborations boost foot traffic and portfolio visibility; targeted co-marketing in luxury segments amplifies brand reach and high-ticket conversion rates.
Real estate and hospitality developers
Developers and hotels demand turnkey furnishing at scale for model homes, residences and boutique properties; 2024 STR data shows the global hotel pipeline exceeded 100,000 rooms, driving steady volume needs. Contracted agreements streamline demand planning and reduce lead times, while on-site installations serve as living showrooms that convert developers and operators into new clients.
Print, digital, and tech vendors
Print, digital, and tech vendors supply book printers and creatives that deliver brand-defining content; digital platforms power e-commerce, personalization, and CRM while data partners improve targeting and measurement; photography and 3D vendors enrich product visualization and lift engagement and conversion.
- e-commerce > $6T global sales in 2024
- CRM market ~ $80B+ in 2024
- personalization boosts conversions 10–30%
- 3D/AR increases product engagement ~20–40%
Partners power scale: $3.35B; 90; >100k rooms; >$6T e-comm; ~$80B CRM
Strategic suppliers, logistics, trade partners, developers/hotels and tech vendors underpin RH’s margins and scale: $3.35B net rev FY2024; 90 galleries; hotel pipeline >100,000 rooms; e-comm >$6T (2024); CRM ~$80B (2024).
| Partner | Key metric (2024) |
|---|---|
| Suppliers | $3.35B rev |
| Galleries/Trade | 90 galleries |
| Hotels/Developers | >100,000 rooms |
| Tech/CRM | e-comm >$6T; CRM ~$80B |
What is included in the product
Detailed Word Document
A comprehensive RH Business Model Canvas outlining the company’s strategy across customer segments, value propositions, channels, and revenue streams. Organized into the 9 classic BMC blocks with narrative, SWOT-linked insights, competitive advantages, and polished presentation for investor discussions and internal planning.
Customizable Excel Spreadsheet
Condenses RH’s strategy into a digestible one-page canvas with editable cells, saving hours of formatting while helping teams quickly identify core components, collaborate, and adapt models for boardrooms or fast deliverables.
Activities
Design and curation
Concepting and selecting collections defines RHs brand aesthetic and drove product-led growth in fiscal 2024 when RH reported approximately $3.7 billion in net revenue, underscoring the payoff of curated assortments. Seasonal refreshes keep assortments relevant and support repeat purchase cycles. Material and finish development differentiates product quality and margin. Regular vendor audits ensure craftsmanship, regulatory compliance, and supply-chain resilience.
Gallery merchandising
Immersive room sets in RH galleries showcase complete looks to drive attachment and higher average order values; RH operates 100+ galleries as of 2024. Visual standards and regular floor changes create fresh inspiration and repeat visits. Staff training calibrates white‑glove service to luxury expectations. In‑gallery events boost foot traffic and conversion by creating timed urgency and social buzz.
Omnichannel operations
RH unifies e-commerce, mobile, and gallery systems for seamless shopping, supporting its $3.68B FY2024 revenue. Real-time inventory visibility enables ship-from-store and pickup across the gallery footprint. Payment, financing, and checkout are optimized for high-ticket transactions, and omnichannel customer service resolves inquiries across channels.
Supply chain and quality control
Demand-driven forecasting and procurement balance lead times and customer demand to cut stockouts; e-commerce return rates average about 16% (2023–24), so tighter forecasting reduces excess inventory. Rigorous quality inspections lower returns and protect brand equity, while consolidation and smarter routing can trim freight spend by up to 15%. Coordinated installation scheduling lifts first-time delivery and installation success toward 95%.
- Forecasting: reduces stockouts and excess inventory
- Quality inspections: lower returns vs ~16% e‑commerce baseline
- Consolidation/routing: freight cost savings up to 15%
- Installation scheduling: first‑time success ~95%
Interior design services
Consultations translate customer vision into cohesive plans, turning briefs into measurable deliverables; the global interior design market was estimated at $143.2 billion in 2024. Space planning, mood boards, and material guidance increase perceived value and can raise project margins by 15–25%. Project management coordinates orders, timelines, and installations to cut delays and cost overruns. Post-install follow-ups sustain satisfaction and referral rates.
- Consultations → scope, deliverables, KPIs
- Space planning → efficiency, flow, value uplift
- Project management → vendor coordination, timelines
- Follow-ups → retention, referrals
Curated collections and 100+ galleries drove $3.7B in FY2024
RH focuses on curated collections and seasonal refreshes that drove ~$3.7B net revenue in FY2024, immersive galleries (100+ in 2024) to lift AOV, and omnichannel tech for real-time inventory enabling ship‑from‑store. Demand‑driven procurement, quality inspections and routing reduce returns (~16% e‑commerce) and cut freight by up to 15%, with installation success near 95%.
| Metric | 2024 Value |
|---|---|
| Net revenue | $3.7B |
| Galleries | 100+ |
| E‑comm returns | ~16% |
| Installation success | ~95% |
| Freight savings | up to 15% |
Delivered as Displayed
Business Model Canvas
The RH Business Model Canvas previewed here is the exact deliverable, not a mockup or sample. When you purchase, you’ll receive this same complete, professionally formatted document—ready to edit and present. Files are provided in Word and Excel for immediate use.











