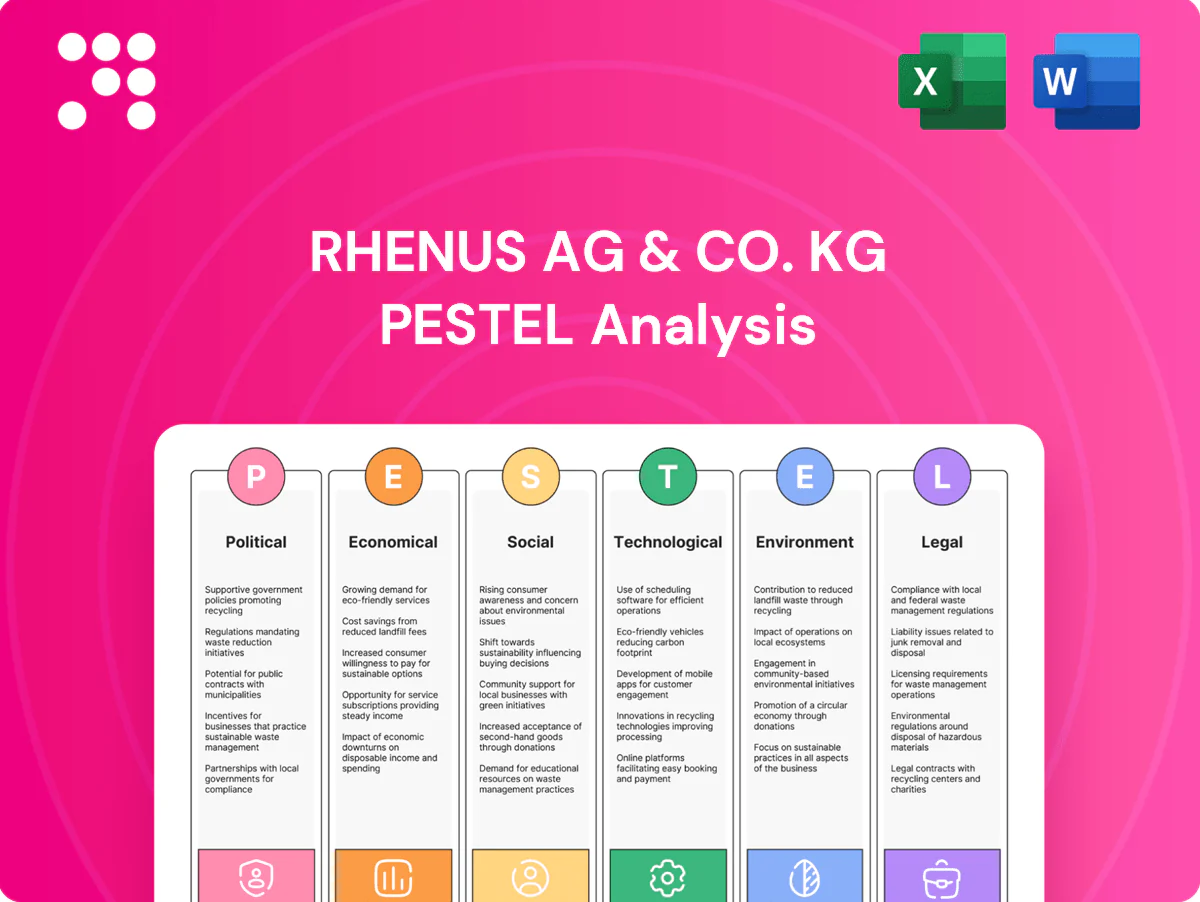
Rhenus AG & Co. KG PESTLE Analysis

Your Competitive Advantage Starts with This Report
Discover how political shifts, economic cycles, technological innovation, social trends, and regulatory changes are reshaping Rhenus AG & Co. KG’s strategic landscape in our concise PESTLE snapshot. Use these insights to anticipate risks and seize logistics opportunities. Purchase the full PESTLE analysis for an actionable, downloadable report you can apply instantly.
Political factors

Geopolitical route disruptions
Conflicts and chokepoint tensions in the Red Sea and Black Sea have forced carriers to reroute, increasing transit times by up to 14 days in 2023–24 and driving war-risk premiums and freight volatility. Rhenus must maintain contingency corridors and dynamic rerouting tools to protect on-time delivery and margin. Government escorts or security restrictions periodically reduce slot capacity and constrain schedules. Proactive stakeholder communication and SLA adjustments are critical to manage claims and customer expectations.
EU transport and logistics policy
Shifts in EU mobility — targeting a 30% modal shift of road freight over 300 km by 2030 and 50% by 2050 — plus TEN-T/CEF transport funding of €25.8bn (2021–27) and tighter state-aid rules affect Rhenus access to corridors and modal choices. Rail and inland waterway incentives can materially change network design and unit costs. Compliance unlocks grants but increases reporting and audit burdens, so targeted lobbying helps align forthcoming rules with operational realities.

Customs and trade policy volatility
Tariffs, FTAs and customs digitization (EU ICS2 launched March 2023) materially affect clearance speed and cost, with digital pre‑lodgement reducing border delays. Rhenus must upgrade brokerage and data quality to avoid fines and demurrage. Divergent regional standards demand localized compliance teams. Enrollment in Trusted Trader programs (AEO/C‑TPAT) yields preferential inspections and faster release.

Public transport concessions and subsidies
Public transport operations hinge on tenders, municipal budgets and service mandates; policy shifts can alter contract scope, pricing and KPI enforcement, affecting margins and renewal chances. The €49 Deutschlandticket and over 10 million users (2024) exemplify political budgeting and subsidy impacts on operator revenue and contract design.
- Dependence on tenders and budgets
- Policy shifts change contract scope/KPIs
- Municipal relationships reduce renewal risk
- Transparency in performance boosts bid success
Industrial policy and nearshoring incentives
US and EU reshoring and strategic-autonomy agendas are shifting production footprints toward regional supply chains; the US CHIPS and Science Act (≈52 billion USD for semiconductors) and the EU Net-Zero Industry Act (2023) accelerate onshoring, redistributing volumes across corridors and warehouses. Rhenus can win new contract-logistics sites adjacent to manufacturing clusters, while policy-driven capex timing compresses facility ramp-up and complicates labor planning.
- CHIPS Act ≈52 billion USD driving semiconductor nearshoring
- EU Net-Zero Industry Act (2023) boosts regional manufacturing
- Redistributed volumes increase corridor/warehouse demand
- Capex timing impacts facility ramp-up and workforce scheduling
Supply chain stress: chokepoints add 14 days, EU targets 30% shift by 2030
Geopolitical chokepoints raised transit times up to 14 days in 2023–24, pushing war‑risk premiums and forcing dynamic rerouting. EU targets a 30% modal shift by 2030 and TEN‑T/CEF funds €25.8bn (2021–27), reshaping modal choices and grant access. ICS2 (Mar 2023) and Trusted Trader programs speed clearance; CHIPS Act ≈$52bn and EU Net‑Zero Industry Act (2023) drive nearshoring and warehouse demand.
| Risk | Impact | 2024/25 metric |
|---|---|---|
| Chokepoints | Transit +14 days | 2023–24 |
| EU policy | Modal shift/Grants | 30% by 2030; €25.8bn |
| Onshoring | Volume relocation | CHIPS ≈$52bn |
What is included in the product
 Detailed Word Document
Explores how macro-environmental forces — Political (trade policy, EU regulations), Economic (GDP, freight demand, fuel costs), Social (urbanization, labor shortages), Technological (digital logistics, automation), Environmental (decarbonization, circular supply chains) and Legal (compliance, customs) — uniquely affect Rhenus AG & Co. KG, with data-backed trends and forward-looking insights to guide strategic decisions and risk mitigation.

 Customizable Excel Spreadsheet
A concise, visually segmented PESTLE summary for Rhenus AG & Co. KG that can be dropped into presentations, edited for local context, and easily shared across teams to streamline external risk discussions and strategic planning.
Economic factors

Global trade cycles and demand elasticity
Freight volumes closely follow global GDP and PMI cycles and inventory adjustments; IMF projected global GDP growth near 3.2% in 2024, so demand sensitivity remains high and PMIs under 50 typically presage falling volumes. Downturns compress yields while rapid rebounds strain vessel/warehouse capacity and drive spot-rate spikes. Rhenus needs flexible cost structures, variable fleet and space commitments, and sector diversification to smooth volatility.
Fuel and energy price swings
Diesel at about €1.70/L (EU avg 2024), Brent ~USD 86/bbl and VLSFO near USD 520/mt in 2024 drive Rhenus margins as diesel, marine fuel and electricity are major opex items. Fuel surcharges allow passthrough but create lag and margin risk during rapid swings. Active energy hedging and efficiency programs smooth unit economics, while modal shifts to rail/water (cutting fuel intensity roughly 20–30%) reduce exposure.

Inflation and interest rates
Cost inflation (Euro area CPI 2024: 2.4% per Eurostat) is lifting wages, leases and equipment prices for Rhenus, while higher ECB rates (deposit rate ~4.00% mid‑2025) increase financing costs. Contract indexation clauses help preserve margins; capex prioritization and lease‑vs‑buy analyses become pivotal for ROI. Tight working capital and stricter collections offset longer DSO in softer freight markets.

Capacity cycles and carrier pricing power
Capacity swings in ocean and air markets drive volatile spot rates—container spot rates plunged roughly 70% from 2021 peaks into 2023‑24, while airlines adjusted belly and freighter capacity to match demand recovery, restoring carrier pricing power on tight lanes. Rhenus leverages strategic partnerships and long‑term allocations to secure reliability and mitigate spot volatility. Multi‑carrier procurement and data‑led timing capture—using market indicators and contract windows—reduce single‑point risk and seize cost advantages.
- Strategic allocations: long‑term contracts for reliability
- Multi‑carrier: lowers single‑provider exposure
- Data‑led procurement: times buys to spot/capacity cycles
Nearshoring and regionalization of supply chains
Nearshoring and regionalization are shifting flows toward shorter cross-border routes, driving higher demand for cross-border trucking and warehousing; 37% of manufacturing leaders reported nearshoring plans in 2023, lifting regional freight volumes and last-mile activity (McKinsey 2023). Rhenus can expand regional hubs and value-added services to capture this, while inventory strategies moving from just-in-time to just-in-case boost storage needs and resilience premiums.
- Increased cross-border trucking demand — longer shelf of regional lanes
- Expand regional hubs & value-added services — capture higher-margin work
- Just-in-case inventory — higher warehouse occupancy and turnover
- Localization = resilience premium — customers tolerate higher logistics spend
Supply chain stress: chokepoints add 14 days, EU targets 30% shift by 2030
Global GDP ~3.2% (IMF 2024) keeps freight demand sensitive; PMIs <50 signal volume downside while inventory rebuilding and nearshoring lift regional flows. Energy: EU diesel ~€1.70/L, Brent ≈USD86/bbl (2024) pressures opex; hedging and modal shift reduce exposure. Euro area CPI 2024: 2.4%; ECB deposit ~4.0% (mid‑2025) raises financing costs.
| Indicator | 2024/2025 |
|---|---|
| Global GDP | ~3.2% (IMF 2024) |
| Diesel (EU) | €1.70/L (2024) |
| Brent | ~USD86/bbl (2024) |
| Euro CPI | 2.4% (2024) |
| ECB deposit | ~4.0% (mid‑2025) |
Preview the Actual Deliverable
Rhenus AG & Co. KG PESTLE Analysis
The Rhenus AG & Co. KG PESTLE analysis examines political, economic, social, technological, legal and environmental factors shaping its logistics operations and strategic outlook. It includes actionable implications and strategic recommendations. The preview shown here is the exact document you’ll receive after purchase—fully formatted and ready to use.

Your Competitive Advantage Starts with This Report
Discover how political shifts, economic cycles, technological innovation, social trends, and regulatory changes are reshaping Rhenus AG & Co. KG’s strategic landscape in our concise PESTLE snapshot. Use these insights to anticipate risks and seize logistics opportunities. Purchase the full PESTLE analysis for an actionable, downloadable report you can apply instantly.
Political factors
Geopolitical route disruptions
Conflicts and chokepoint tensions in the Red Sea and Black Sea have forced carriers to reroute, increasing transit times by up to 14 days in 2023–24 and driving war-risk premiums and freight volatility. Rhenus must maintain contingency corridors and dynamic rerouting tools to protect on-time delivery and margin. Government escorts or security restrictions periodically reduce slot capacity and constrain schedules. Proactive stakeholder communication and SLA adjustments are critical to manage claims and customer expectations.
EU transport and logistics policy
Shifts in EU mobility — targeting a 30% modal shift of road freight over 300 km by 2030 and 50% by 2050 — plus TEN-T/CEF transport funding of €25.8bn (2021–27) and tighter state-aid rules affect Rhenus access to corridors and modal choices. Rail and inland waterway incentives can materially change network design and unit costs. Compliance unlocks grants but increases reporting and audit burdens, so targeted lobbying helps align forthcoming rules with operational realities.
Customs and trade policy volatility
Tariffs, FTAs and customs digitization (EU ICS2 launched March 2023) materially affect clearance speed and cost, with digital pre‑lodgement reducing border delays. Rhenus must upgrade brokerage and data quality to avoid fines and demurrage. Divergent regional standards demand localized compliance teams. Enrollment in Trusted Trader programs (AEO/C‑TPAT) yields preferential inspections and faster release.
Public transport concessions and subsidies
Public transport operations hinge on tenders, municipal budgets and service mandates; policy shifts can alter contract scope, pricing and KPI enforcement, affecting margins and renewal chances. The €49 Deutschlandticket and over 10 million users (2024) exemplify political budgeting and subsidy impacts on operator revenue and contract design.
- Dependence on tenders and budgets
- Policy shifts change contract scope/KPIs
- Municipal relationships reduce renewal risk
- Transparency in performance boosts bid success
Industrial policy and nearshoring incentives
US and EU reshoring and strategic-autonomy agendas are shifting production footprints toward regional supply chains; the US CHIPS and Science Act (≈52 billion USD for semiconductors) and the EU Net-Zero Industry Act (2023) accelerate onshoring, redistributing volumes across corridors and warehouses. Rhenus can win new contract-logistics sites adjacent to manufacturing clusters, while policy-driven capex timing compresses facility ramp-up and complicates labor planning.
- CHIPS Act ≈52 billion USD driving semiconductor nearshoring
- EU Net-Zero Industry Act (2023) boosts regional manufacturing
- Redistributed volumes increase corridor/warehouse demand
- Capex timing impacts facility ramp-up and workforce scheduling
Supply chain stress: chokepoints add 14 days, EU targets 30% shift by 2030
Geopolitical chokepoints raised transit times up to 14 days in 2023–24, pushing war‑risk premiums and forcing dynamic rerouting. EU targets a 30% modal shift by 2030 and TEN‑T/CEF funds €25.8bn (2021–27), reshaping modal choices and grant access. ICS2 (Mar 2023) and Trusted Trader programs speed clearance; CHIPS Act ≈$52bn and EU Net‑Zero Industry Act (2023) drive nearshoring and warehouse demand.
| Risk | Impact | 2024/25 metric |
|---|---|---|
| Chokepoints | Transit +14 days | 2023–24 |
| EU policy | Modal shift/Grants | 30% by 2030; €25.8bn |
| Onshoring | Volume relocation | CHIPS ≈$52bn |
What is included in the product
Detailed Word Document
Explores how macro-environmental forces — Political (trade policy, EU regulations), Economic (GDP, freight demand, fuel costs), Social (urbanization, labor shortages), Technological (digital logistics, automation), Environmental (decarbonization, circular supply chains) and Legal (compliance, customs) — uniquely affect Rhenus AG & Co. KG, with data-backed trends and forward-looking insights to guide strategic decisions and risk mitigation.
Customizable Excel Spreadsheet
A concise, visually segmented PESTLE summary for Rhenus AG & Co. KG that can be dropped into presentations, edited for local context, and easily shared across teams to streamline external risk discussions and strategic planning.
Economic factors
Global trade cycles and demand elasticity
Freight volumes closely follow global GDP and PMI cycles and inventory adjustments; IMF projected global GDP growth near 3.2% in 2024, so demand sensitivity remains high and PMIs under 50 typically presage falling volumes. Downturns compress yields while rapid rebounds strain vessel/warehouse capacity and drive spot-rate spikes. Rhenus needs flexible cost structures, variable fleet and space commitments, and sector diversification to smooth volatility.
Fuel and energy price swings
Diesel at about €1.70/L (EU avg 2024), Brent ~USD 86/bbl and VLSFO near USD 520/mt in 2024 drive Rhenus margins as diesel, marine fuel and electricity are major opex items. Fuel surcharges allow passthrough but create lag and margin risk during rapid swings. Active energy hedging and efficiency programs smooth unit economics, while modal shifts to rail/water (cutting fuel intensity roughly 20–30%) reduce exposure.
Inflation and interest rates
Cost inflation (Euro area CPI 2024: 2.4% per Eurostat) is lifting wages, leases and equipment prices for Rhenus, while higher ECB rates (deposit rate ~4.00% mid‑2025) increase financing costs. Contract indexation clauses help preserve margins; capex prioritization and lease‑vs‑buy analyses become pivotal for ROI. Tight working capital and stricter collections offset longer DSO in softer freight markets.
Capacity cycles and carrier pricing power
Capacity swings in ocean and air markets drive volatile spot rates—container spot rates plunged roughly 70% from 2021 peaks into 2023‑24, while airlines adjusted belly and freighter capacity to match demand recovery, restoring carrier pricing power on tight lanes. Rhenus leverages strategic partnerships and long‑term allocations to secure reliability and mitigate spot volatility. Multi‑carrier procurement and data‑led timing capture—using market indicators and contract windows—reduce single‑point risk and seize cost advantages.
- Strategic allocations: long‑term contracts for reliability
- Multi‑carrier: lowers single‑provider exposure
- Data‑led procurement: times buys to spot/capacity cycles
Nearshoring and regionalization of supply chains
Nearshoring and regionalization are shifting flows toward shorter cross-border routes, driving higher demand for cross-border trucking and warehousing; 37% of manufacturing leaders reported nearshoring plans in 2023, lifting regional freight volumes and last-mile activity (McKinsey 2023). Rhenus can expand regional hubs and value-added services to capture this, while inventory strategies moving from just-in-time to just-in-case boost storage needs and resilience premiums.
- Increased cross-border trucking demand — longer shelf of regional lanes
- Expand regional hubs & value-added services — capture higher-margin work
- Just-in-case inventory — higher warehouse occupancy and turnover
- Localization = resilience premium — customers tolerate higher logistics spend
Supply chain stress: chokepoints add 14 days, EU targets 30% shift by 2030
Global GDP ~3.2% (IMF 2024) keeps freight demand sensitive; PMIs <50 signal volume downside while inventory rebuilding and nearshoring lift regional flows. Energy: EU diesel ~€1.70/L, Brent ≈USD86/bbl (2024) pressures opex; hedging and modal shift reduce exposure. Euro area CPI 2024: 2.4%; ECB deposit ~4.0% (mid‑2025) raises financing costs.
| Indicator | 2024/2025 |
|---|---|
| Global GDP | ~3.2% (IMF 2024) |
| Diesel (EU) | €1.70/L (2024) |
| Brent | ~USD86/bbl (2024) |
| Euro CPI | 2.4% (2024) |
| ECB deposit | ~4.0% (mid‑2025) |
Preview the Actual Deliverable
Rhenus AG & Co. KG PESTLE Analysis
The Rhenus AG & Co. KG PESTLE analysis examines political, economic, social, technological, legal and environmental factors shaping its logistics operations and strategic outlook. It includes actionable implications and strategic recommendations. The preview shown here is the exact document you’ll receive after purchase—fully formatted and ready to use.
Original: $10.00
-65%$10.00
$3.50Description
Your Competitive Advantage Starts with This Report
Discover how political shifts, economic cycles, technological innovation, social trends, and regulatory changes are reshaping Rhenus AG & Co. KG’s strategic landscape in our concise PESTLE snapshot. Use these insights to anticipate risks and seize logistics opportunities. Purchase the full PESTLE analysis for an actionable, downloadable report you can apply instantly.
Political factors
Geopolitical route disruptions
Conflicts and chokepoint tensions in the Red Sea and Black Sea have forced carriers to reroute, increasing transit times by up to 14 days in 2023–24 and driving war-risk premiums and freight volatility. Rhenus must maintain contingency corridors and dynamic rerouting tools to protect on-time delivery and margin. Government escorts or security restrictions periodically reduce slot capacity and constrain schedules. Proactive stakeholder communication and SLA adjustments are critical to manage claims and customer expectations.
EU transport and logistics policy
Shifts in EU mobility — targeting a 30% modal shift of road freight over 300 km by 2030 and 50% by 2050 — plus TEN-T/CEF transport funding of €25.8bn (2021–27) and tighter state-aid rules affect Rhenus access to corridors and modal choices. Rail and inland waterway incentives can materially change network design and unit costs. Compliance unlocks grants but increases reporting and audit burdens, so targeted lobbying helps align forthcoming rules with operational realities.
Customs and trade policy volatility
Tariffs, FTAs and customs digitization (EU ICS2 launched March 2023) materially affect clearance speed and cost, with digital pre‑lodgement reducing border delays. Rhenus must upgrade brokerage and data quality to avoid fines and demurrage. Divergent regional standards demand localized compliance teams. Enrollment in Trusted Trader programs (AEO/C‑TPAT) yields preferential inspections and faster release.
Public transport concessions and subsidies
Public transport operations hinge on tenders, municipal budgets and service mandates; policy shifts can alter contract scope, pricing and KPI enforcement, affecting margins and renewal chances. The €49 Deutschlandticket and over 10 million users (2024) exemplify political budgeting and subsidy impacts on operator revenue and contract design.
- Dependence on tenders and budgets
- Policy shifts change contract scope/KPIs
- Municipal relationships reduce renewal risk
- Transparency in performance boosts bid success
Industrial policy and nearshoring incentives
US and EU reshoring and strategic-autonomy agendas are shifting production footprints toward regional supply chains; the US CHIPS and Science Act (≈52 billion USD for semiconductors) and the EU Net-Zero Industry Act (2023) accelerate onshoring, redistributing volumes across corridors and warehouses. Rhenus can win new contract-logistics sites adjacent to manufacturing clusters, while policy-driven capex timing compresses facility ramp-up and complicates labor planning.
- CHIPS Act ≈52 billion USD driving semiconductor nearshoring
- EU Net-Zero Industry Act (2023) boosts regional manufacturing
- Redistributed volumes increase corridor/warehouse demand
- Capex timing impacts facility ramp-up and workforce scheduling
Supply chain stress: chokepoints add 14 days, EU targets 30% shift by 2030
Geopolitical chokepoints raised transit times up to 14 days in 2023–24, pushing war‑risk premiums and forcing dynamic rerouting. EU targets a 30% modal shift by 2030 and TEN‑T/CEF funds €25.8bn (2021–27), reshaping modal choices and grant access. ICS2 (Mar 2023) and Trusted Trader programs speed clearance; CHIPS Act ≈$52bn and EU Net‑Zero Industry Act (2023) drive nearshoring and warehouse demand.
| Risk | Impact | 2024/25 metric |
|---|---|---|
| Chokepoints | Transit +14 days | 2023–24 |
| EU policy | Modal shift/Grants | 30% by 2030; €25.8bn |
| Onshoring | Volume relocation | CHIPS ≈$52bn |
What is included in the product
Detailed Word Document
Explores how macro-environmental forces — Political (trade policy, EU regulations), Economic (GDP, freight demand, fuel costs), Social (urbanization, labor shortages), Technological (digital logistics, automation), Environmental (decarbonization, circular supply chains) and Legal (compliance, customs) — uniquely affect Rhenus AG & Co. KG, with data-backed trends and forward-looking insights to guide strategic decisions and risk mitigation.
Customizable Excel Spreadsheet
A concise, visually segmented PESTLE summary for Rhenus AG & Co. KG that can be dropped into presentations, edited for local context, and easily shared across teams to streamline external risk discussions and strategic planning.
Economic factors
Global trade cycles and demand elasticity
Freight volumes closely follow global GDP and PMI cycles and inventory adjustments; IMF projected global GDP growth near 3.2% in 2024, so demand sensitivity remains high and PMIs under 50 typically presage falling volumes. Downturns compress yields while rapid rebounds strain vessel/warehouse capacity and drive spot-rate spikes. Rhenus needs flexible cost structures, variable fleet and space commitments, and sector diversification to smooth volatility.
Fuel and energy price swings
Diesel at about €1.70/L (EU avg 2024), Brent ~USD 86/bbl and VLSFO near USD 520/mt in 2024 drive Rhenus margins as diesel, marine fuel and electricity are major opex items. Fuel surcharges allow passthrough but create lag and margin risk during rapid swings. Active energy hedging and efficiency programs smooth unit economics, while modal shifts to rail/water (cutting fuel intensity roughly 20–30%) reduce exposure.
Inflation and interest rates
Cost inflation (Euro area CPI 2024: 2.4% per Eurostat) is lifting wages, leases and equipment prices for Rhenus, while higher ECB rates (deposit rate ~4.00% mid‑2025) increase financing costs. Contract indexation clauses help preserve margins; capex prioritization and lease‑vs‑buy analyses become pivotal for ROI. Tight working capital and stricter collections offset longer DSO in softer freight markets.
Capacity cycles and carrier pricing power
Capacity swings in ocean and air markets drive volatile spot rates—container spot rates plunged roughly 70% from 2021 peaks into 2023‑24, while airlines adjusted belly and freighter capacity to match demand recovery, restoring carrier pricing power on tight lanes. Rhenus leverages strategic partnerships and long‑term allocations to secure reliability and mitigate spot volatility. Multi‑carrier procurement and data‑led timing capture—using market indicators and contract windows—reduce single‑point risk and seize cost advantages.
- Strategic allocations: long‑term contracts for reliability
- Multi‑carrier: lowers single‑provider exposure
- Data‑led procurement: times buys to spot/capacity cycles
Nearshoring and regionalization of supply chains
Nearshoring and regionalization are shifting flows toward shorter cross-border routes, driving higher demand for cross-border trucking and warehousing; 37% of manufacturing leaders reported nearshoring plans in 2023, lifting regional freight volumes and last-mile activity (McKinsey 2023). Rhenus can expand regional hubs and value-added services to capture this, while inventory strategies moving from just-in-time to just-in-case boost storage needs and resilience premiums.
- Increased cross-border trucking demand — longer shelf of regional lanes
- Expand regional hubs & value-added services — capture higher-margin work
- Just-in-case inventory — higher warehouse occupancy and turnover
- Localization = resilience premium — customers tolerate higher logistics spend
Supply chain stress: chokepoints add 14 days, EU targets 30% shift by 2030
Global GDP ~3.2% (IMF 2024) keeps freight demand sensitive; PMIs <50 signal volume downside while inventory rebuilding and nearshoring lift regional flows. Energy: EU diesel ~€1.70/L, Brent ≈USD86/bbl (2024) pressures opex; hedging and modal shift reduce exposure. Euro area CPI 2024: 2.4%; ECB deposit ~4.0% (mid‑2025) raises financing costs.
| Indicator | 2024/2025 |
|---|---|
| Global GDP | ~3.2% (IMF 2024) |
| Diesel (EU) | €1.70/L (2024) |
| Brent | ~USD86/bbl (2024) |
| Euro CPI | 2.4% (2024) |
| ECB deposit | ~4.0% (mid‑2025) |
Preview the Actual Deliverable
Rhenus AG & Co. KG PESTLE Analysis
The Rhenus AG & Co. KG PESTLE analysis examines political, economic, social, technological, legal and environmental factors shaping its logistics operations and strategic outlook. It includes actionable implications and strategic recommendations. The preview shown here is the exact document you’ll receive after purchase—fully formatted and ready to use.











