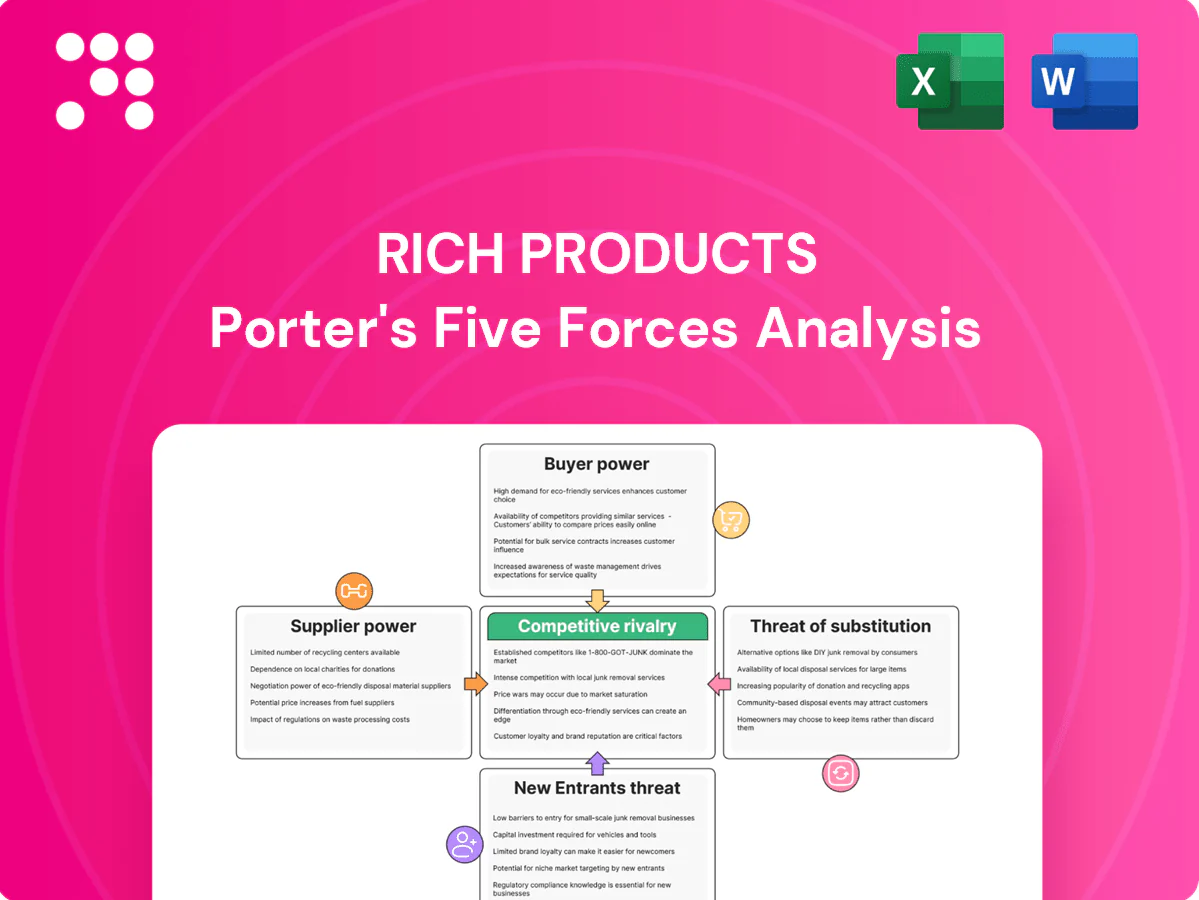
Rich Products Porter's Five Forces Analysis

Elevate Your Analysis with the Complete Porter's Five Forces Analysis
Rich Products faces moderate supplier power, intense buyer scrutiny, and steady substitute threats amid rising private-label competition; emerging entrants are constrained by scale and distribution needs. This snapshot highlights key pressures but only scratches the surface. Unlock the full Porter's Five Forces Analysis for force-by-force ratings, visuals, and actionable strategy insights.
Suppliers Bargaining Power

Commodity inputs, moderate leverage
Rich Products buys widely available inputs—flour, sugar, dairy, oils—so individual supplier power remains moderate; commodity markets, however, can produce sudden price spikes that raise input costs. The firm uses hedging and multi-sourcing alongside global sourcing and approved-vendor lists to dilute supplier influence and manage volatility. Long-term contracts stabilize pricing but constrain short-term procurement flexibility.
Specialty ingredients, higher power
Non-dairy toppings, emulsifiers, stabilizers and clean-label inputs are sourced from a concentrated set of qualified suppliers, giving those vendors elevated bargaining power. Strict food-safety, performance specs and certification requirements further narrow the supplier pool. Switching suppliers often forces reformulation, validation and shelf-life testing, raising costs and timelines for Rich Products. Suppliers owning proprietary technologies can command price premiums and longer contract tenors.

Packaging and cold-chain dependencies
Specialized packaging films, corrugate and refrigerated cases are essential to product quality, and resin price swings of up to 20% in 2024 squeezed packaging margins. Tight capacity in packaging plants and fewer high-quality refrigerated carriers in some US regions increased supplier leverage and spot-rate volatility. Rich Products mitigates risk through dual-sourcing and inventory buffers, lowering disruption exposure.

Switching costs via qualification
Switching costs via qualification remain high in 2024 as QA audits, SQF/BRC certification and customer co-approvals slow supplier changes and raise onboarding costs, creating strong stickiness for incumbent suppliers; however, Rich’s global scale and purchasing power can compel suppliers to meet standards to win or retain business.
- QA audits: multi-stage approvals raise time-to-contract
- SQF/BRC: GFSI-recognized standards required
- Customer co-approvals: add commercial friction
- Vendor scorecards: sustain performance pressure
Scale offsets supplier power
Scale offsets supplier power: Rich Products leverages global volume across 100+ countries (as of 2024) to secure allocation in tight markets, aggregate demand for stronger rebates and payment terms, and form strategic partnerships that enable co-innovation while limiting margin leakage.
- 100+ countries: global reach
- Aggregated demand: stronger rebates/payment terms
- Partnerships: co-innovation, margin protection
- Consolidated spend: increased transparency/leverage
Moderate supplier power: resin ±20% swings, high specialty concentration, global scale.
Rich’s supplier power is moderate: widely available commodities limit leverage but 2024 resin swings up 20% and concentrated specialty-ingredient suppliers raise prices. Long-term contracts, hedging and multi-sourcing reduce volatility; QA/SQF requirements and reformulation costs keep switching costs high. Global scale (100+ countries in 2024) secures rebates and allocation in tight markets.
| Metric | 2024 |
|---|---|
| Countries | 100+ |
| Resin price swing | ±20% |
| Specialty supplier concentration | High |
What is included in the product
 Detailed Word Document
Tailored Porter's Five Forces analysis for Rich Products that uncovers competitive drivers, supplier and buyer power, entry barriers, substitutes and rivalry, highlighting disruptive threats and strategic levers to protect market share and inform investor, internal strategy, and academic materials.

 Customizable Excel Spreadsheet
A concise one-sheet Porter's Five Forces for Rich Products that visualizes competitive pressure with an interactive spider chart—easy to customize, copy into decks, and integrate into dashboards to quickly relieve decision-making pain points.
Customers Bargaining Power

Consolidated retail and foodservice buyers
Large retailers and distributors (top 4 grocers account for roughly 50% of US supermarket sales in 2024) and major QSR chains exert strong price and slotting leverage, able to shift volume quickly to competing SKUs. Compliance fees and OTIF penalties (commonly 1–3% of invoice value) plus rising private label penetration (~17% of grocery sales) intensify margin pressure. Strategic account management and differentiated product value are essential for Rich to defend placement and pricing.
Private label intensifies pressure
Many major retailers increasingly promote private-label frozen bakery and dessert lines, with private label capturing roughly 18% of US grocery dollar share in 2024, creating direct price benchmarks for Rich’s branded and co-manufactured SKUs. Buyers can threaten insourcing or switch suppliers to shave margins, forcing Rich to protect branded equity while expanding private-label partnerships and optimizing cost-to-serve.

Low switching costs on standard SKUs
Commodity-like SKUs such as basic breads and crusts are easily comparable, so switching is straightforward and buyers prioritize price and specs. Specification parity reduces friction, making service reliability and industry fill-rate targets above 95% the typical tie-breaker. Value-added features (e.g., premade fillings) increase stickiness but do not eliminate switching when standard SKUs and private-label penetration (~20% US grocery, 2024) compete on cost.

Customization can reduce buyer power
Co-developed recipes, bespoke formats, and ready-to-finish solutions increase customer embeddedness by aligning product design with operator workflows, shifting negotiations from price to performance. Operational training and equipment support create sticky, non-price value propositions; performance guarantees and menu integration raise practical exit costs and convert buyers into long-term partners. These levers change buyer conversations to outcomes and ROI rather than unit cost.
- Co-development: deep integration
- Training/equipment: service lock-in
- Guarantees: higher exit cost
- Menu integration: outcome-focused talks
Fragmented international mix tempers power
Outside top markets Rich Products faces fragmented customer bases that dilute any single buyer’s leverage; regional distributors and independents prioritize reliability and breadth, and localized tastes make direct substitution less seamless, though currency shifts and import dynamics can reintroduce pricing strain.
- Fragmentation reduces single-buyer power
- Distributors value reliability/breadth
- Local tastes limit substitution
- Currency/imports can pressure pricing
Top-4 grocers control ~50% sales; private-label ~18%
Top-4 grocers hold ~50% of US supermarket sales (2024), giving retailers strong slotting and price leverage. Private-label share ~18% (2024) and OTIF/chargeback penalties (commonly 1–3% of invoice) compress margins. Rich relies on co‑development, service reliability (fill-rate >95%) and equipment/training to raise exit costs.
| Metric | 2024 Value |
|---|---|
| Top-4 grocers share | ~50% |
| Private-label grocery dollar share | ~18% |
| OTIF/chargeback penalties | 1–3% invoice |
| Industry fill-rate target | >95% |
Preview Before You Purchase
Rich Products Porter's Five Forces Analysis
This Porter’s Five Forces analysis of Rich Products is the complete, professionally written document you’re previewing now—what you see is exactly what you’ll receive after purchase. The file covers competitive rivalry, supplier and buyer power, threat of substitutes, and barriers to entry in clear, actionable detail. You’ll get immediate access to this fully formatted, ready-to-use report with no placeholders or surprises.

Elevate Your Analysis with the Complete Porter's Five Forces Analysis
Rich Products faces moderate supplier power, intense buyer scrutiny, and steady substitute threats amid rising private-label competition; emerging entrants are constrained by scale and distribution needs. This snapshot highlights key pressures but only scratches the surface. Unlock the full Porter's Five Forces Analysis for force-by-force ratings, visuals, and actionable strategy insights.
Suppliers Bargaining Power
Commodity inputs, moderate leverage
Rich Products buys widely available inputs—flour, sugar, dairy, oils—so individual supplier power remains moderate; commodity markets, however, can produce sudden price spikes that raise input costs. The firm uses hedging and multi-sourcing alongside global sourcing and approved-vendor lists to dilute supplier influence and manage volatility. Long-term contracts stabilize pricing but constrain short-term procurement flexibility.
Specialty ingredients, higher power
Non-dairy toppings, emulsifiers, stabilizers and clean-label inputs are sourced from a concentrated set of qualified suppliers, giving those vendors elevated bargaining power. Strict food-safety, performance specs and certification requirements further narrow the supplier pool. Switching suppliers often forces reformulation, validation and shelf-life testing, raising costs and timelines for Rich Products. Suppliers owning proprietary technologies can command price premiums and longer contract tenors.
Packaging and cold-chain dependencies
Specialized packaging films, corrugate and refrigerated cases are essential to product quality, and resin price swings of up to 20% in 2024 squeezed packaging margins. Tight capacity in packaging plants and fewer high-quality refrigerated carriers in some US regions increased supplier leverage and spot-rate volatility. Rich Products mitigates risk through dual-sourcing and inventory buffers, lowering disruption exposure.
Switching costs via qualification
Switching costs via qualification remain high in 2024 as QA audits, SQF/BRC certification and customer co-approvals slow supplier changes and raise onboarding costs, creating strong stickiness for incumbent suppliers; however, Rich’s global scale and purchasing power can compel suppliers to meet standards to win or retain business.
- QA audits: multi-stage approvals raise time-to-contract
- SQF/BRC: GFSI-recognized standards required
- Customer co-approvals: add commercial friction
- Vendor scorecards: sustain performance pressure
Scale offsets supplier power
Scale offsets supplier power: Rich Products leverages global volume across 100+ countries (as of 2024) to secure allocation in tight markets, aggregate demand for stronger rebates and payment terms, and form strategic partnerships that enable co-innovation while limiting margin leakage.
- 100+ countries: global reach
- Aggregated demand: stronger rebates/payment terms
- Partnerships: co-innovation, margin protection
- Consolidated spend: increased transparency/leverage
Moderate supplier power: resin ±20% swings, high specialty concentration, global scale.
Rich’s supplier power is moderate: widely available commodities limit leverage but 2024 resin swings up 20% and concentrated specialty-ingredient suppliers raise prices. Long-term contracts, hedging and multi-sourcing reduce volatility; QA/SQF requirements and reformulation costs keep switching costs high. Global scale (100+ countries in 2024) secures rebates and allocation in tight markets.
| Metric | 2024 |
|---|---|
| Countries | 100+ |
| Resin price swing | ±20% |
| Specialty supplier concentration | High |
What is included in the product
Detailed Word Document
Tailored Porter's Five Forces analysis for Rich Products that uncovers competitive drivers, supplier and buyer power, entry barriers, substitutes and rivalry, highlighting disruptive threats and strategic levers to protect market share and inform investor, internal strategy, and academic materials.
Customizable Excel Spreadsheet
A concise one-sheet Porter's Five Forces for Rich Products that visualizes competitive pressure with an interactive spider chart—easy to customize, copy into decks, and integrate into dashboards to quickly relieve decision-making pain points.
Customers Bargaining Power
Consolidated retail and foodservice buyers
Large retailers and distributors (top 4 grocers account for roughly 50% of US supermarket sales in 2024) and major QSR chains exert strong price and slotting leverage, able to shift volume quickly to competing SKUs. Compliance fees and OTIF penalties (commonly 1–3% of invoice value) plus rising private label penetration (~17% of grocery sales) intensify margin pressure. Strategic account management and differentiated product value are essential for Rich to defend placement and pricing.
Private label intensifies pressure
Many major retailers increasingly promote private-label frozen bakery and dessert lines, with private label capturing roughly 18% of US grocery dollar share in 2024, creating direct price benchmarks for Rich’s branded and co-manufactured SKUs. Buyers can threaten insourcing or switch suppliers to shave margins, forcing Rich to protect branded equity while expanding private-label partnerships and optimizing cost-to-serve.
Low switching costs on standard SKUs
Commodity-like SKUs such as basic breads and crusts are easily comparable, so switching is straightforward and buyers prioritize price and specs. Specification parity reduces friction, making service reliability and industry fill-rate targets above 95% the typical tie-breaker. Value-added features (e.g., premade fillings) increase stickiness but do not eliminate switching when standard SKUs and private-label penetration (~20% US grocery, 2024) compete on cost.
Customization can reduce buyer power
Co-developed recipes, bespoke formats, and ready-to-finish solutions increase customer embeddedness by aligning product design with operator workflows, shifting negotiations from price to performance. Operational training and equipment support create sticky, non-price value propositions; performance guarantees and menu integration raise practical exit costs and convert buyers into long-term partners. These levers change buyer conversations to outcomes and ROI rather than unit cost.
- Co-development: deep integration
- Training/equipment: service lock-in
- Guarantees: higher exit cost
- Menu integration: outcome-focused talks
Fragmented international mix tempers power
Outside top markets Rich Products faces fragmented customer bases that dilute any single buyer’s leverage; regional distributors and independents prioritize reliability and breadth, and localized tastes make direct substitution less seamless, though currency shifts and import dynamics can reintroduce pricing strain.
- Fragmentation reduces single-buyer power
- Distributors value reliability/breadth
- Local tastes limit substitution
- Currency/imports can pressure pricing
Top-4 grocers control ~50% sales; private-label ~18%
Top-4 grocers hold ~50% of US supermarket sales (2024), giving retailers strong slotting and price leverage. Private-label share ~18% (2024) and OTIF/chargeback penalties (commonly 1–3% of invoice) compress margins. Rich relies on co‑development, service reliability (fill-rate >95%) and equipment/training to raise exit costs.
| Metric | 2024 Value |
|---|---|
| Top-4 grocers share | ~50% |
| Private-label grocery dollar share | ~18% |
| OTIF/chargeback penalties | 1–3% invoice |
| Industry fill-rate target | >95% |
Preview Before You Purchase
Rich Products Porter's Five Forces Analysis
This Porter’s Five Forces analysis of Rich Products is the complete, professionally written document you’re previewing now—what you see is exactly what you’ll receive after purchase. The file covers competitive rivalry, supplier and buyer power, threat of substitutes, and barriers to entry in clear, actionable detail. You’ll get immediate access to this fully formatted, ready-to-use report with no placeholders or surprises.
Original: $10.00
-65%$10.00
$3.50Description
Elevate Your Analysis with the Complete Porter's Five Forces Analysis
Rich Products faces moderate supplier power, intense buyer scrutiny, and steady substitute threats amid rising private-label competition; emerging entrants are constrained by scale and distribution needs. This snapshot highlights key pressures but only scratches the surface. Unlock the full Porter's Five Forces Analysis for force-by-force ratings, visuals, and actionable strategy insights.
Suppliers Bargaining Power
Commodity inputs, moderate leverage
Rich Products buys widely available inputs—flour, sugar, dairy, oils—so individual supplier power remains moderate; commodity markets, however, can produce sudden price spikes that raise input costs. The firm uses hedging and multi-sourcing alongside global sourcing and approved-vendor lists to dilute supplier influence and manage volatility. Long-term contracts stabilize pricing but constrain short-term procurement flexibility.
Specialty ingredients, higher power
Non-dairy toppings, emulsifiers, stabilizers and clean-label inputs are sourced from a concentrated set of qualified suppliers, giving those vendors elevated bargaining power. Strict food-safety, performance specs and certification requirements further narrow the supplier pool. Switching suppliers often forces reformulation, validation and shelf-life testing, raising costs and timelines for Rich Products. Suppliers owning proprietary technologies can command price premiums and longer contract tenors.
Packaging and cold-chain dependencies
Specialized packaging films, corrugate and refrigerated cases are essential to product quality, and resin price swings of up to 20% in 2024 squeezed packaging margins. Tight capacity in packaging plants and fewer high-quality refrigerated carriers in some US regions increased supplier leverage and spot-rate volatility. Rich Products mitigates risk through dual-sourcing and inventory buffers, lowering disruption exposure.
Switching costs via qualification
Switching costs via qualification remain high in 2024 as QA audits, SQF/BRC certification and customer co-approvals slow supplier changes and raise onboarding costs, creating strong stickiness for incumbent suppliers; however, Rich’s global scale and purchasing power can compel suppliers to meet standards to win or retain business.
- QA audits: multi-stage approvals raise time-to-contract
- SQF/BRC: GFSI-recognized standards required
- Customer co-approvals: add commercial friction
- Vendor scorecards: sustain performance pressure
Scale offsets supplier power
Scale offsets supplier power: Rich Products leverages global volume across 100+ countries (as of 2024) to secure allocation in tight markets, aggregate demand for stronger rebates and payment terms, and form strategic partnerships that enable co-innovation while limiting margin leakage.
- 100+ countries: global reach
- Aggregated demand: stronger rebates/payment terms
- Partnerships: co-innovation, margin protection
- Consolidated spend: increased transparency/leverage
Moderate supplier power: resin ±20% swings, high specialty concentration, global scale.
Rich’s supplier power is moderate: widely available commodities limit leverage but 2024 resin swings up 20% and concentrated specialty-ingredient suppliers raise prices. Long-term contracts, hedging and multi-sourcing reduce volatility; QA/SQF requirements and reformulation costs keep switching costs high. Global scale (100+ countries in 2024) secures rebates and allocation in tight markets.
| Metric | 2024 |
|---|---|
| Countries | 100+ |
| Resin price swing | ±20% |
| Specialty supplier concentration | High |
What is included in the product
Detailed Word Document
Tailored Porter's Five Forces analysis for Rich Products that uncovers competitive drivers, supplier and buyer power, entry barriers, substitutes and rivalry, highlighting disruptive threats and strategic levers to protect market share and inform investor, internal strategy, and academic materials.
Customizable Excel Spreadsheet
A concise one-sheet Porter's Five Forces for Rich Products that visualizes competitive pressure with an interactive spider chart—easy to customize, copy into decks, and integrate into dashboards to quickly relieve decision-making pain points.
Customers Bargaining Power
Consolidated retail and foodservice buyers
Large retailers and distributors (top 4 grocers account for roughly 50% of US supermarket sales in 2024) and major QSR chains exert strong price and slotting leverage, able to shift volume quickly to competing SKUs. Compliance fees and OTIF penalties (commonly 1–3% of invoice value) plus rising private label penetration (~17% of grocery sales) intensify margin pressure. Strategic account management and differentiated product value are essential for Rich to defend placement and pricing.
Private label intensifies pressure
Many major retailers increasingly promote private-label frozen bakery and dessert lines, with private label capturing roughly 18% of US grocery dollar share in 2024, creating direct price benchmarks for Rich’s branded and co-manufactured SKUs. Buyers can threaten insourcing or switch suppliers to shave margins, forcing Rich to protect branded equity while expanding private-label partnerships and optimizing cost-to-serve.
Low switching costs on standard SKUs
Commodity-like SKUs such as basic breads and crusts are easily comparable, so switching is straightforward and buyers prioritize price and specs. Specification parity reduces friction, making service reliability and industry fill-rate targets above 95% the typical tie-breaker. Value-added features (e.g., premade fillings) increase stickiness but do not eliminate switching when standard SKUs and private-label penetration (~20% US grocery, 2024) compete on cost.
Customization can reduce buyer power
Co-developed recipes, bespoke formats, and ready-to-finish solutions increase customer embeddedness by aligning product design with operator workflows, shifting negotiations from price to performance. Operational training and equipment support create sticky, non-price value propositions; performance guarantees and menu integration raise practical exit costs and convert buyers into long-term partners. These levers change buyer conversations to outcomes and ROI rather than unit cost.
- Co-development: deep integration
- Training/equipment: service lock-in
- Guarantees: higher exit cost
- Menu integration: outcome-focused talks
Fragmented international mix tempers power
Outside top markets Rich Products faces fragmented customer bases that dilute any single buyer’s leverage; regional distributors and independents prioritize reliability and breadth, and localized tastes make direct substitution less seamless, though currency shifts and import dynamics can reintroduce pricing strain.
- Fragmentation reduces single-buyer power
- Distributors value reliability/breadth
- Local tastes limit substitution
- Currency/imports can pressure pricing
Top-4 grocers control ~50% sales; private-label ~18%
Top-4 grocers hold ~50% of US supermarket sales (2024), giving retailers strong slotting and price leverage. Private-label share ~18% (2024) and OTIF/chargeback penalties (commonly 1–3% of invoice) compress margins. Rich relies on co‑development, service reliability (fill-rate >95%) and equipment/training to raise exit costs.
| Metric | 2024 Value |
|---|---|
| Top-4 grocers share | ~50% |
| Private-label grocery dollar share | ~18% |
| OTIF/chargeback penalties | 1–3% invoice |
| Industry fill-rate target | >95% |
Preview Before You Purchase
Rich Products Porter's Five Forces Analysis
This Porter’s Five Forces analysis of Rich Products is the complete, professionally written document you’re previewing now—what you see is exactly what you’ll receive after purchase. The file covers competitive rivalry, supplier and buyer power, threat of substitutes, and barriers to entry in clear, actionable detail. You’ll get immediate access to this fully formatted, ready-to-use report with no placeholders or surprises.











