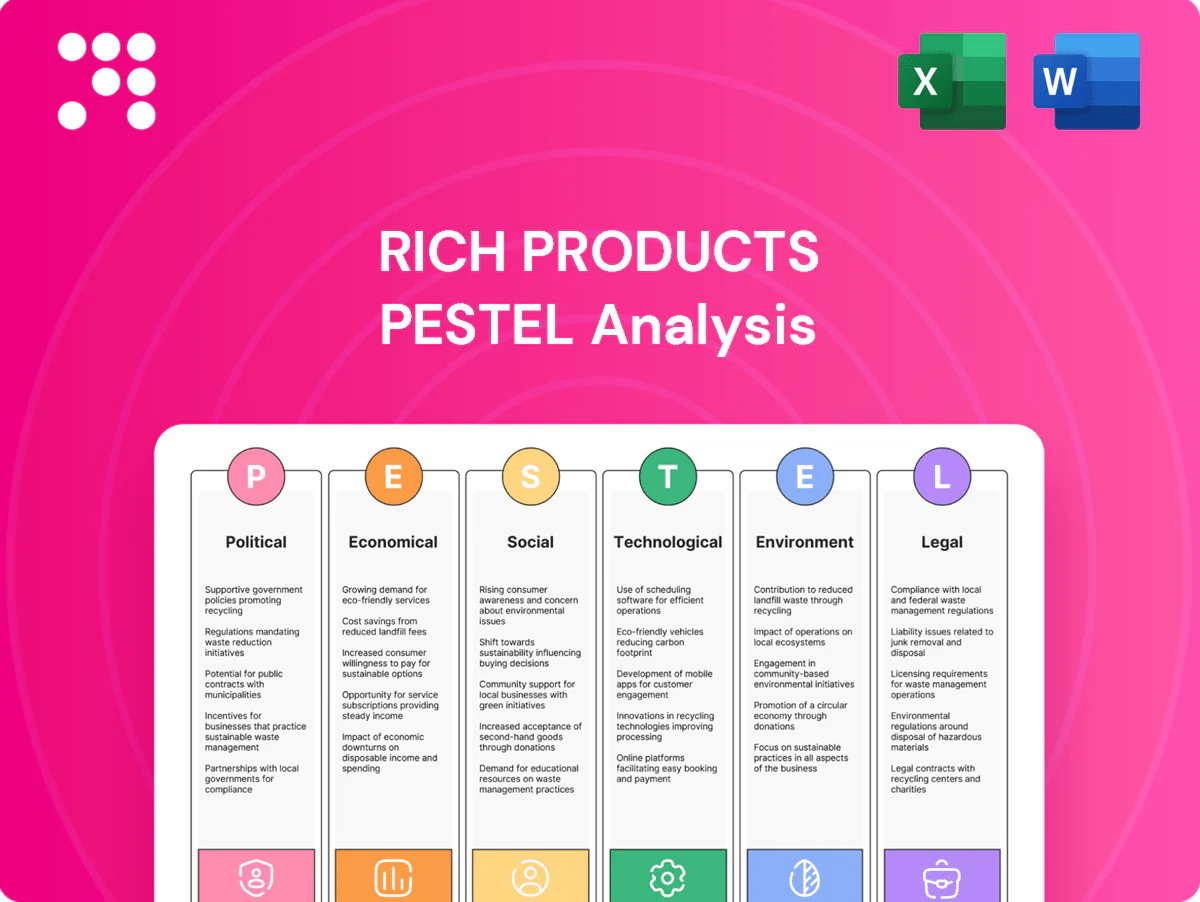
Rich Products PESTLE Analysis

Make Smarter Strategic Decisions with a Complete PESTEL View
Gain a competitive edge with our PESTLE Analysis of Rich Products—concise, actionable insight into political, economic, social, technological, legal, and environmental drivers. Understand risks and growth levers shaping strategy. Ideal for investors and planners. Purchase the full report to access the complete, ready-to-use analysis now.
Political factors

Trade policies and tariffs
As a multinational shipper of frozen and refrigerated foods serving 100+ countries, Rich Products is exposed to shifting tariffs on dairy, sugar, wheat and processed goods that can materially change landed costs. New trade agreements or retaliatory duties can force price adjustments and margin pressure across regions. Proactive sourcing diversification and tariff engineering mitigate volatility, while close monitoring of customs classifications and rules of origin is essential for cost control.
Food policy and nutrition agendas
Government public-health priorities reshape Rich Products' school-meal and institutional pipelines—US schools serve ~4.8 billion lunches/year (USDA 2022–23)—while policies on sugar, sodium and trans fats (WHO: eliminating industrial trans fats could prevent ~500,000 deaths/year) force reformulation. Over 45 jurisdictions now levy sugar taxes (WHO/2024), and subsidies/dietary guidelines shift demand; active regulator and industry engagement defines feasible standards.

Geopolitical stability and supply continuity
Conflicts and sanctions—notably the Russia-Ukraine disruption to Black Sea grain exports in 2022–23—can interrupt ingredient flows and sea/land logistics, a major risk given that about 90% of global trade by volume moves by sea (UNCTAD). Frozen products rely on predictable corridors and port access plus uninterrupted cold chain infrastructure. Political risk insurance and multi-region suppliers reduce exposure and were increasingly adopted after 2022. Scenario planning preserves service levels for key customers.

Import inspections and border controls
Heightened food-safety inspections at borders lengthen lead times and inflate compliance costs for Rich Products, with authorized economic operator programs reported by the World Customs Organization to cut clearance dwell time by up to 50%. Cold-chain integrity must be documented at crossings to avoid product rejections and spoilage claims; GS1 pilots (2022–24) showed digital traceability cut inspection time and non-compliance rates by about 30%. Pre-clearance and trusted-trader status accelerate movement and lower detention risk, supporting leaner inventory and reduced working-capital needs.
- WCO: AEO can reduce dwell time up to 50%
- GS1 pilots 2022–24: ~30% lower inspection time/non-compliance
- Documented cold-chain data reduces spoilage-related losses
Local content and industrial policies
Local content and industrial policies push Rich Products toward domestic manufacturing and sourcing in target markets, where regional plants lower import duties and strengthen government and customer goodwill. Shifting policy landscapes can compress ROI and necessitate asset reallocation, so scenario-led capex planning is essential. Maintaining balanced global-capacity planning preserves flexibility to re-route production as rules evolve.
- Regional plants: lower duties, build goodwill
- Policy shifts: impact ROI and asset mix
- Action: scenario-based, flexible capacity planning
Tariff volatility, sugar-tax risk and school-meal exposure heighten supply-chain compliance urgency
Rich Products faces tariff swings across 100+ markets, sugar-tax exposure in 45 jurisdictions (WHO/2024) and school-meal policy effects (US schools ~4.8B lunches/yr USDA 2022–23). Supply shocks (90% trade by sea; UNCTAD) and rising border inspections raise compliance costs; AEO/traceability can cut delays ~50%/30% (WCO; GS1 2022–24).
| Risk | Metric |
|---|---|
| Markets | 100+ countries |
| School meals | 4.8B lunches/yr |
| Sugar taxes | 45 jurisdictions (2024) |
What is included in the product
 Detailed Word Document
Explores how Political, Economic, Social, Technological, Environmental and Legal forces uniquely affect Rich Products, using data-backed trends and region/industry specifics to identify threats and opportunities; formatted for executives, investors and strategists with forward-looking insights for scenario planning.

 Customizable Excel Spreadsheet
A clean, summarized PESTLE for Rich Products that removes information overload, visually segmented by PESTEL categories for quick interpretation and easily dropped into presentations or shared across teams for fast alignment.
Economic factors

Commodity price volatility
Input costs for dairy, cocoa, sugar, oils and wheat swing with global cycles — FAO food price volatility remained elevated through 2023–24 (index swings ~15–25%), with cocoa futures up roughly 25% in 2023 and vegetable oil swings exceeding 30% intrayear, compressing margins in fixed-price contracts.
Active hedging and formula pricing have proven to stabilize earnings by locking input costs and smoothing P&L exposure.
R&D reformulation (trial reductions in commodity content of 5–15%) lets Rich Products flex around cost surges and protect margins.
Consumer spending cycles
Consumer discretionary cycles shift spend from indulgent desserts to value bakery staples; USDA ERS data shows food-away-from-home comprised about 51% of US food expenditures in 2023, highlighting sensitivity to dine-out budgets. In downturns retail and private-label lines often outpace foodservice, and active channel-mix management cushions revenue volatility. Pack-size and price-pack architecture (smaller SKUs, value multipacks) sustain affordability and share gains.

Foreign exchange fluctuations
Multi-currency revenues and inputs expose Rich Products to translation and transaction risk across its 100+ markets, with FX swings impacting reported margins. Local-currency depreciations can raise costs for imported ingredients or, conversely, boost export competitiveness for US-priced products. The company uses natural hedges (local sourcing/pricing) and financial hedging to damp volatility. Pricing governance is aligned to FX realities through regional price adjustments and contractual FX clauses.

Labor markets and wage inflation
Tight labor conditions raise manufacturing and logistics costs for Rich Products as U.S. unemployment remained around 3.7% in late 2024, sustaining upward pressure on wages and shift premiums. Strategic automation and targeted upskilling improve throughput and retention, reducing reliance on overtime. Locating sites near talent pools and using collaborative scheduling stabilizes 24/7 cold-chain continuity and lowers vacancy risk.
- Labor tightness: U.S. unemployment ~3.7% (Dec 2024)
- Automation/upskilling: higher throughput, lower turnover
- Site selection: proximity to labor pools ensures continuity
- Collaborative scheduling: stabilizes 24/7 cold-chain ops
Energy and logistics costs
Refrigeration and frozen transport are highly energy intensive, with refrigerated fleets using roughly 1.5–3× the energy of dry vans; fuel and electricity volatility (diesel swings ±20% YoY recently) materially drives total delivered cost. Efficiency upgrades and renewable PPAs can cut energy spend 10–25%, while network optimization typically trims miles 10–20% and dwell times up to 30%.
- Refrigerated energy intensity: 1.5–3× dry vans
- Fuel volatility: ±20% YoY impact
- Efficiency/PPAs savings: 10–25%
- Network cuts: miles 10–20%, dwell times up to 30%
Tariff volatility, sugar-tax risk and school-meal exposure heighten supply-chain compliance urgency
Input-cost volatility (FAO food index swings 15–25% in 2023–24; cocoa +25% in 2023; veg oil ±30% intrayear) compresses margins. Hedging, formula pricing and reformulation (5–15% commodity cuts) stabilize earnings. Channel mix and pack-size shifts protect volume in downturns. Energy, fuel and tight labor (US unemployment ~3.7% Dec 2024) raise OPEX.
| Metric | Value |
|---|---|
| FAO volatility | 15–25% |
| Cocoa 2023 | +25% |
| Veg oil swings | ±30% |
| US unemployment | 3.7% (Dec 2024) |
Preview the Actual Deliverable
Rich Products PESTLE Analysis
The preview shown here is the exact Rich Products PESTLE Analysis document you’ll receive after purchase—fully formatted and ready to use. This is the real file delivered exactly as shown, with no placeholders or teasers. The content, structure, and layout visible here are what you’ll download immediately after payment.

Make Smarter Strategic Decisions with a Complete PESTEL View
Gain a competitive edge with our PESTLE Analysis of Rich Products—concise, actionable insight into political, economic, social, technological, legal, and environmental drivers. Understand risks and growth levers shaping strategy. Ideal for investors and planners. Purchase the full report to access the complete, ready-to-use analysis now.
Political factors
Trade policies and tariffs
As a multinational shipper of frozen and refrigerated foods serving 100+ countries, Rich Products is exposed to shifting tariffs on dairy, sugar, wheat and processed goods that can materially change landed costs. New trade agreements or retaliatory duties can force price adjustments and margin pressure across regions. Proactive sourcing diversification and tariff engineering mitigate volatility, while close monitoring of customs classifications and rules of origin is essential for cost control.
Food policy and nutrition agendas
Government public-health priorities reshape Rich Products' school-meal and institutional pipelines—US schools serve ~4.8 billion lunches/year (USDA 2022–23)—while policies on sugar, sodium and trans fats (WHO: eliminating industrial trans fats could prevent ~500,000 deaths/year) force reformulation. Over 45 jurisdictions now levy sugar taxes (WHO/2024), and subsidies/dietary guidelines shift demand; active regulator and industry engagement defines feasible standards.
Geopolitical stability and supply continuity
Conflicts and sanctions—notably the Russia-Ukraine disruption to Black Sea grain exports in 2022–23—can interrupt ingredient flows and sea/land logistics, a major risk given that about 90% of global trade by volume moves by sea (UNCTAD). Frozen products rely on predictable corridors and port access plus uninterrupted cold chain infrastructure. Political risk insurance and multi-region suppliers reduce exposure and were increasingly adopted after 2022. Scenario planning preserves service levels for key customers.
Import inspections and border controls
Heightened food-safety inspections at borders lengthen lead times and inflate compliance costs for Rich Products, with authorized economic operator programs reported by the World Customs Organization to cut clearance dwell time by up to 50%. Cold-chain integrity must be documented at crossings to avoid product rejections and spoilage claims; GS1 pilots (2022–24) showed digital traceability cut inspection time and non-compliance rates by about 30%. Pre-clearance and trusted-trader status accelerate movement and lower detention risk, supporting leaner inventory and reduced working-capital needs.
- WCO: AEO can reduce dwell time up to 50%
- GS1 pilots 2022–24: ~30% lower inspection time/non-compliance
- Documented cold-chain data reduces spoilage-related losses
Local content and industrial policies
Local content and industrial policies push Rich Products toward domestic manufacturing and sourcing in target markets, where regional plants lower import duties and strengthen government and customer goodwill. Shifting policy landscapes can compress ROI and necessitate asset reallocation, so scenario-led capex planning is essential. Maintaining balanced global-capacity planning preserves flexibility to re-route production as rules evolve.
- Regional plants: lower duties, build goodwill
- Policy shifts: impact ROI and asset mix
- Action: scenario-based, flexible capacity planning
Tariff volatility, sugar-tax risk and school-meal exposure heighten supply-chain compliance urgency
Rich Products faces tariff swings across 100+ markets, sugar-tax exposure in 45 jurisdictions (WHO/2024) and school-meal policy effects (US schools ~4.8B lunches/yr USDA 2022–23). Supply shocks (90% trade by sea; UNCTAD) and rising border inspections raise compliance costs; AEO/traceability can cut delays ~50%/30% (WCO; GS1 2022–24).
| Risk | Metric |
|---|---|
| Markets | 100+ countries |
| School meals | 4.8B lunches/yr |
| Sugar taxes | 45 jurisdictions (2024) |
What is included in the product
Detailed Word Document
Explores how Political, Economic, Social, Technological, Environmental and Legal forces uniquely affect Rich Products, using data-backed trends and region/industry specifics to identify threats and opportunities; formatted for executives, investors and strategists with forward-looking insights for scenario planning.
Customizable Excel Spreadsheet
A clean, summarized PESTLE for Rich Products that removes information overload, visually segmented by PESTEL categories for quick interpretation and easily dropped into presentations or shared across teams for fast alignment.
Economic factors
Commodity price volatility
Input costs for dairy, cocoa, sugar, oils and wheat swing with global cycles — FAO food price volatility remained elevated through 2023–24 (index swings ~15–25%), with cocoa futures up roughly 25% in 2023 and vegetable oil swings exceeding 30% intrayear, compressing margins in fixed-price contracts.
Active hedging and formula pricing have proven to stabilize earnings by locking input costs and smoothing P&L exposure.
R&D reformulation (trial reductions in commodity content of 5–15%) lets Rich Products flex around cost surges and protect margins.
Consumer spending cycles
Consumer discretionary cycles shift spend from indulgent desserts to value bakery staples; USDA ERS data shows food-away-from-home comprised about 51% of US food expenditures in 2023, highlighting sensitivity to dine-out budgets. In downturns retail and private-label lines often outpace foodservice, and active channel-mix management cushions revenue volatility. Pack-size and price-pack architecture (smaller SKUs, value multipacks) sustain affordability and share gains.
Foreign exchange fluctuations
Multi-currency revenues and inputs expose Rich Products to translation and transaction risk across its 100+ markets, with FX swings impacting reported margins. Local-currency depreciations can raise costs for imported ingredients or, conversely, boost export competitiveness for US-priced products. The company uses natural hedges (local sourcing/pricing) and financial hedging to damp volatility. Pricing governance is aligned to FX realities through regional price adjustments and contractual FX clauses.
Labor markets and wage inflation
Tight labor conditions raise manufacturing and logistics costs for Rich Products as U.S. unemployment remained around 3.7% in late 2024, sustaining upward pressure on wages and shift premiums. Strategic automation and targeted upskilling improve throughput and retention, reducing reliance on overtime. Locating sites near talent pools and using collaborative scheduling stabilizes 24/7 cold-chain continuity and lowers vacancy risk.
- Labor tightness: U.S. unemployment ~3.7% (Dec 2024)
- Automation/upskilling: higher throughput, lower turnover
- Site selection: proximity to labor pools ensures continuity
- Collaborative scheduling: stabilizes 24/7 cold-chain ops
Energy and logistics costs
Refrigeration and frozen transport are highly energy intensive, with refrigerated fleets using roughly 1.5–3× the energy of dry vans; fuel and electricity volatility (diesel swings ±20% YoY recently) materially drives total delivered cost. Efficiency upgrades and renewable PPAs can cut energy spend 10–25%, while network optimization typically trims miles 10–20% and dwell times up to 30%.
- Refrigerated energy intensity: 1.5–3× dry vans
- Fuel volatility: ±20% YoY impact
- Efficiency/PPAs savings: 10–25%
- Network cuts: miles 10–20%, dwell times up to 30%
Tariff volatility, sugar-tax risk and school-meal exposure heighten supply-chain compliance urgency
Input-cost volatility (FAO food index swings 15–25% in 2023–24; cocoa +25% in 2023; veg oil ±30% intrayear) compresses margins. Hedging, formula pricing and reformulation (5–15% commodity cuts) stabilize earnings. Channel mix and pack-size shifts protect volume in downturns. Energy, fuel and tight labor (US unemployment ~3.7% Dec 2024) raise OPEX.
| Metric | Value |
|---|---|
| FAO volatility | 15–25% |
| Cocoa 2023 | +25% |
| Veg oil swings | ±30% |
| US unemployment | 3.7% (Dec 2024) |
Preview the Actual Deliverable
Rich Products PESTLE Analysis
The preview shown here is the exact Rich Products PESTLE Analysis document you’ll receive after purchase—fully formatted and ready to use. This is the real file delivered exactly as shown, with no placeholders or teasers. The content, structure, and layout visible here are what you’ll download immediately after payment.
Description
Make Smarter Strategic Decisions with a Complete PESTEL View
Gain a competitive edge with our PESTLE Analysis of Rich Products—concise, actionable insight into political, economic, social, technological, legal, and environmental drivers. Understand risks and growth levers shaping strategy. Ideal for investors and planners. Purchase the full report to access the complete, ready-to-use analysis now.
Political factors
Trade policies and tariffs
As a multinational shipper of frozen and refrigerated foods serving 100+ countries, Rich Products is exposed to shifting tariffs on dairy, sugar, wheat and processed goods that can materially change landed costs. New trade agreements or retaliatory duties can force price adjustments and margin pressure across regions. Proactive sourcing diversification and tariff engineering mitigate volatility, while close monitoring of customs classifications and rules of origin is essential for cost control.
Food policy and nutrition agendas
Government public-health priorities reshape Rich Products' school-meal and institutional pipelines—US schools serve ~4.8 billion lunches/year (USDA 2022–23)—while policies on sugar, sodium and trans fats (WHO: eliminating industrial trans fats could prevent ~500,000 deaths/year) force reformulation. Over 45 jurisdictions now levy sugar taxes (WHO/2024), and subsidies/dietary guidelines shift demand; active regulator and industry engagement defines feasible standards.
Geopolitical stability and supply continuity
Conflicts and sanctions—notably the Russia-Ukraine disruption to Black Sea grain exports in 2022–23—can interrupt ingredient flows and sea/land logistics, a major risk given that about 90% of global trade by volume moves by sea (UNCTAD). Frozen products rely on predictable corridors and port access plus uninterrupted cold chain infrastructure. Political risk insurance and multi-region suppliers reduce exposure and were increasingly adopted after 2022. Scenario planning preserves service levels for key customers.
Import inspections and border controls
Heightened food-safety inspections at borders lengthen lead times and inflate compliance costs for Rich Products, with authorized economic operator programs reported by the World Customs Organization to cut clearance dwell time by up to 50%. Cold-chain integrity must be documented at crossings to avoid product rejections and spoilage claims; GS1 pilots (2022–24) showed digital traceability cut inspection time and non-compliance rates by about 30%. Pre-clearance and trusted-trader status accelerate movement and lower detention risk, supporting leaner inventory and reduced working-capital needs.
- WCO: AEO can reduce dwell time up to 50%
- GS1 pilots 2022–24: ~30% lower inspection time/non-compliance
- Documented cold-chain data reduces spoilage-related losses
Local content and industrial policies
Local content and industrial policies push Rich Products toward domestic manufacturing and sourcing in target markets, where regional plants lower import duties and strengthen government and customer goodwill. Shifting policy landscapes can compress ROI and necessitate asset reallocation, so scenario-led capex planning is essential. Maintaining balanced global-capacity planning preserves flexibility to re-route production as rules evolve.
- Regional plants: lower duties, build goodwill
- Policy shifts: impact ROI and asset mix
- Action: scenario-based, flexible capacity planning
Tariff volatility, sugar-tax risk and school-meal exposure heighten supply-chain compliance urgency
Rich Products faces tariff swings across 100+ markets, sugar-tax exposure in 45 jurisdictions (WHO/2024) and school-meal policy effects (US schools ~4.8B lunches/yr USDA 2022–23). Supply shocks (90% trade by sea; UNCTAD) and rising border inspections raise compliance costs; AEO/traceability can cut delays ~50%/30% (WCO; GS1 2022–24).
| Risk | Metric |
|---|---|
| Markets | 100+ countries |
| School meals | 4.8B lunches/yr |
| Sugar taxes | 45 jurisdictions (2024) |
What is included in the product
Detailed Word Document
Explores how Political, Economic, Social, Technological, Environmental and Legal forces uniquely affect Rich Products, using data-backed trends and region/industry specifics to identify threats and opportunities; formatted for executives, investors and strategists with forward-looking insights for scenario planning.
Customizable Excel Spreadsheet
A clean, summarized PESTLE for Rich Products that removes information overload, visually segmented by PESTEL categories for quick interpretation and easily dropped into presentations or shared across teams for fast alignment.
Economic factors
Commodity price volatility
Input costs for dairy, cocoa, sugar, oils and wheat swing with global cycles — FAO food price volatility remained elevated through 2023–24 (index swings ~15–25%), with cocoa futures up roughly 25% in 2023 and vegetable oil swings exceeding 30% intrayear, compressing margins in fixed-price contracts.
Active hedging and formula pricing have proven to stabilize earnings by locking input costs and smoothing P&L exposure.
R&D reformulation (trial reductions in commodity content of 5–15%) lets Rich Products flex around cost surges and protect margins.
Consumer spending cycles
Consumer discretionary cycles shift spend from indulgent desserts to value bakery staples; USDA ERS data shows food-away-from-home comprised about 51% of US food expenditures in 2023, highlighting sensitivity to dine-out budgets. In downturns retail and private-label lines often outpace foodservice, and active channel-mix management cushions revenue volatility. Pack-size and price-pack architecture (smaller SKUs, value multipacks) sustain affordability and share gains.
Foreign exchange fluctuations
Multi-currency revenues and inputs expose Rich Products to translation and transaction risk across its 100+ markets, with FX swings impacting reported margins. Local-currency depreciations can raise costs for imported ingredients or, conversely, boost export competitiveness for US-priced products. The company uses natural hedges (local sourcing/pricing) and financial hedging to damp volatility. Pricing governance is aligned to FX realities through regional price adjustments and contractual FX clauses.
Labor markets and wage inflation
Tight labor conditions raise manufacturing and logistics costs for Rich Products as U.S. unemployment remained around 3.7% in late 2024, sustaining upward pressure on wages and shift premiums. Strategic automation and targeted upskilling improve throughput and retention, reducing reliance on overtime. Locating sites near talent pools and using collaborative scheduling stabilizes 24/7 cold-chain continuity and lowers vacancy risk.
- Labor tightness: U.S. unemployment ~3.7% (Dec 2024)
- Automation/upskilling: higher throughput, lower turnover
- Site selection: proximity to labor pools ensures continuity
- Collaborative scheduling: stabilizes 24/7 cold-chain ops
Energy and logistics costs
Refrigeration and frozen transport are highly energy intensive, with refrigerated fleets using roughly 1.5–3× the energy of dry vans; fuel and electricity volatility (diesel swings ±20% YoY recently) materially drives total delivered cost. Efficiency upgrades and renewable PPAs can cut energy spend 10–25%, while network optimization typically trims miles 10–20% and dwell times up to 30%.
- Refrigerated energy intensity: 1.5–3× dry vans
- Fuel volatility: ±20% YoY impact
- Efficiency/PPAs savings: 10–25%
- Network cuts: miles 10–20%, dwell times up to 30%
Tariff volatility, sugar-tax risk and school-meal exposure heighten supply-chain compliance urgency
Input-cost volatility (FAO food index swings 15–25% in 2023–24; cocoa +25% in 2023; veg oil ±30% intrayear) compresses margins. Hedging, formula pricing and reformulation (5–15% commodity cuts) stabilize earnings. Channel mix and pack-size shifts protect volume in downturns. Energy, fuel and tight labor (US unemployment ~3.7% Dec 2024) raise OPEX.
| Metric | Value |
|---|---|
| FAO volatility | 15–25% |
| Cocoa 2023 | +25% |
| Veg oil swings | ±30% |
| US unemployment | 3.7% (Dec 2024) |
Preview the Actual Deliverable
Rich Products PESTLE Analysis
The preview shown here is the exact Rich Products PESTLE Analysis document you’ll receive after purchase—fully formatted and ready to use. This is the real file delivered exactly as shown, with no placeholders or teasers. The content, structure, and layout visible here are what you’ll download immediately after payment.











