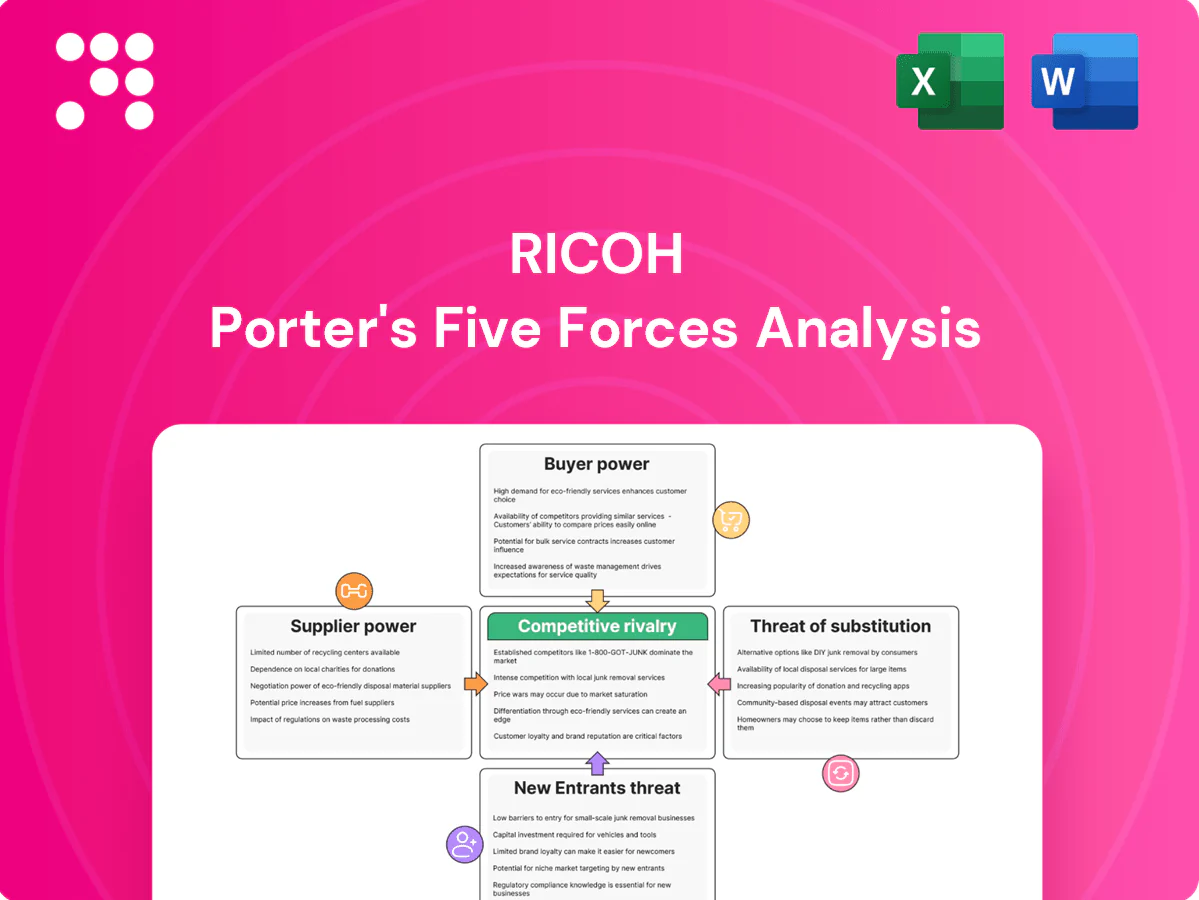
Ricoh Porter's Five Forces Analysis

Go Beyond the Preview—Access the Full Strategic Report
Ricoh’s Porter's Five Forces snapshot highlights moderate supplier and buyer power, intense digital-era rivalry, manageable threats from new entrants, and rising substitute risks from cloud services; strategic moves must balance cost, innovation, and partnerships. This brief overview only scratches the surface—unlock the full analysis to access force-by-force ratings, visuals, and actionable recommendations.
Suppliers Bargaining Power

Specialized imaging components
Core parts like print engines, precision optics and controller ASICs come from a limited pool of specialists, concentrating supply and raising Ricoh’s dependency. This concentration can push lead times beyond 12 weeks and give suppliers pricing power. Technical qualification cycles commonly take 6–18 months, limiting rapid supplier switches. Any disruption can cascade across production and service SLAs, increasing downtime risk.
Commodity inputs and multi-sourcing
Ricoh dilutes supplier power by dual-sourcing standard components such as plastics, sheet metal and power supplies, supported by competitive bidding and global procurement offices established in 2024. Volume aggregation across product lines secures better pricing and improved lead times. Long‑term framework agreements stabilize costs and availability, reducing spot exposure. These measures collectively strengthen negotiating leverage versus commodity suppliers.

Supply chain volatility and logistics
Semiconductor cycles (lead times >20 weeks in 2021–22, averaging ~12 weeks in 2024), freight constraints (container rates down from 2021 peaks near $10,300/FEU to roughly $2,000–3,000/FEU in 2024) and currency swings shift bargaining power upstream. Elevated logistics costs have compressed manufacturing margins by ~1–2 ppt; Ricoh uses buffer inventories and regional manufacturing, yet suppliers still imposed surcharges up to mid-single-digit percent in tight months.

Software and cloud dependencies
Ricoh’s partnerships for embedded software, security modules and cloud connectors create vendor stickiness that raises integration and support costs; API or license changes can materially increase switching costs amid a 2024 public cloud market exceeding 600 billion USD. Open standards and selective in-house development reduce lock-in, while co-innovation agreements help rebalance vendor influence and preserve service continuity.
- Partnerships: stickiness with key vendors
- Risk: API/license changes ↑ switching costs
- Mitigation: open standards + in-house dev
- Balance: co-innovation agreements
ESG, materials, and compliance
Restrictions like RoHS/REACH (ECHA lists ~23,000 registered substances in 2024) and concentration of rare‑earth supply (China ~60% of global production in 2024) shrink qualified supplier pools, while rigorous compliance and audit demands strengthen the negotiating power of approved vendors. Ricoh’s supplier development programs can expand compliant capacity, and long‑term ESG alignment supports steadier, more favorable terms.
- Supply concentration: China ~60% of rare earths (2024)
- Regulatory scope: ~23,000 REACH-registered substances (2024)
- Effect: fewer approved suppliers, higher supplier leverage
- Mitigation: Ricoh supplier development and ESG alignment
Supplier leverage rises as rare-earth and semiconductor concentration extend lead times
Specialist parts concentration (print engines, ASICs) and long qualification cycles give suppliers strong leverage, with disruptions extending lead times and SLAs. Ricoh reduced exposure in 2024 via dual‑sourcing, global procurement and framework agreements. Regulatory and raw‑material concentration (China ~60% rare earths; REACH ~23,000 substances) keep supplier power elevated.
| Metric | 2024 | Impact |
|---|---|---|
| Rare earths | ~60% | Supply concentration |
| REACH substances | ~23,000 | Fewer approved suppliers |
| Semiconductor lead time | ~12 weeks | Switching cost |
| Freight rate (FEU) | $2–3k | Logistics cost |
What is included in the product
 Detailed Word Document
Tailored Porter's Five Forces analysis for Ricoh that uncovers competitive rivalry, buyer/supplier power, threat of substitutes and new entrants, highlighting disruptive forces and pricing pressures to inform strategic decisions.

 Customizable Excel Spreadsheet
A clear one-sheet Porter's Five Forces for Ricoh that distills supplier, buyer, entrant, substitute, and rivalry pressures into actionable insights for faster strategic decisions. Customizable scores and a radar visual make updates for new market shifts quick and slide-ready for decks or reports.
Customers Bargaining Power

Enterprise and public RFP leverage
Large enterprises and public agencies procure via competitive tenders, forcing price concessions typically in the mid-teens to mid-30s percentage range on equipment and services during RFPs.
Multi-year managed print services contracts — a global MPS market of roughly $30–35 billion in 2024 — increase buyer leverage as suppliers bid on predictable recurring revenue.
Buyers standardize SLAs, embed financial penalties for downtime and performance misses, and trade committed volumes for aggressive volume discounts and rebate structures.
Switching costs and embedded workflows
Fleet management tools, driver stacks, security policies and user training create tangible switching frictions for Ricoh customers, especially where integration with document workflows and DMS is deep; DMS adoption exceeded 70% among enterprises in 2024, raising replacement hurdles. Rivals now offer migration utilities and professional services that lower migration hours and costs, so net switching costs remain meaningful but not prohibitive.

TCO and outcome-based pricing
Buyers now scrutinize total cost of ownership—device price, consumables, service and energy—demanding clear TCO models; in 2024 pay-per-use and outcome SLAs accounted for about 30% of new managed print contracts, shifting uptime and consumption risk to vendors. Ricoh must justify value with measurable uptime, automation and analytics to protect margins. Transparent benchmarking and published SLAs compress pricing power and limit margin expansion.

Abundant alternatives
Hybrid work and volume variability
Hybrid work has cut office print volumes, with IDC reporting global hardcopy peripherals shipments fell about 8% year-on-year in 2023, giving buyers leverage to renegotiate contracts and defer refresh cycles, pressuring Ricoh pricing; customers favor flexible, scalable contracts over fixed fleets, forcing vendors to bundle IT and managed-services to defend recurring revenue.
- Buyer leverage: lower volumes, contract renegotiation
- Preference: scalable/consumption pricing over fixed fleets
- Pressure: deferred refresh cycles hit ARPU and pricing
- Defense: bundling IT/MPS to protect service revenue
Buyers squeeze MPS vendors as pay-per-use hits ~30%, DMS >70%, shipments -8%
Customers hold strong bargaining power: competitive RFPs force mid-teens to mid-30s% concessions and split awards among HP, Canon and others.
MPS market ~$30–35B (2024); pay-per-use/outcome SLAs ~30% of new MPS deals (2024), shifting risk to vendors.
DMS adoption >70% (2024) and an 8% global hardcopy shipment decline (2023) raise switching frictions but increase renegotiation leverage.
| Metric | Value |
|---|---|
| MPS market (2024) | $30–35B |
| Pay-per-use share (2024) | ~30% |
| DMS adoption (2024) | >70% |
| Hardcopy shipments YoY (2023) | -8% |
Same Document Delivered
Ricoh Porter's Five Forces Analysis
This preview shows the exact Ricoh Porter's Five Forces analysis you'll receive immediately after purchase—no surprises, no placeholders. The full document is professionally formatted and ready to download, delivering a concise assessment of competitive rivalry, supplier and buyer power, and threats of new entrants and substitutes with clear strategic implications.

Go Beyond the Preview—Access the Full Strategic Report
Ricoh’s Porter's Five Forces snapshot highlights moderate supplier and buyer power, intense digital-era rivalry, manageable threats from new entrants, and rising substitute risks from cloud services; strategic moves must balance cost, innovation, and partnerships. This brief overview only scratches the surface—unlock the full analysis to access force-by-force ratings, visuals, and actionable recommendations.
Suppliers Bargaining Power
Specialized imaging components
Core parts like print engines, precision optics and controller ASICs come from a limited pool of specialists, concentrating supply and raising Ricoh’s dependency. This concentration can push lead times beyond 12 weeks and give suppliers pricing power. Technical qualification cycles commonly take 6–18 months, limiting rapid supplier switches. Any disruption can cascade across production and service SLAs, increasing downtime risk.
Commodity inputs and multi-sourcing
Ricoh dilutes supplier power by dual-sourcing standard components such as plastics, sheet metal and power supplies, supported by competitive bidding and global procurement offices established in 2024. Volume aggregation across product lines secures better pricing and improved lead times. Long‑term framework agreements stabilize costs and availability, reducing spot exposure. These measures collectively strengthen negotiating leverage versus commodity suppliers.
Supply chain volatility and logistics
Semiconductor cycles (lead times >20 weeks in 2021–22, averaging ~12 weeks in 2024), freight constraints (container rates down from 2021 peaks near $10,300/FEU to roughly $2,000–3,000/FEU in 2024) and currency swings shift bargaining power upstream. Elevated logistics costs have compressed manufacturing margins by ~1–2 ppt; Ricoh uses buffer inventories and regional manufacturing, yet suppliers still imposed surcharges up to mid-single-digit percent in tight months.
Software and cloud dependencies
Ricoh’s partnerships for embedded software, security modules and cloud connectors create vendor stickiness that raises integration and support costs; API or license changes can materially increase switching costs amid a 2024 public cloud market exceeding 600 billion USD. Open standards and selective in-house development reduce lock-in, while co-innovation agreements help rebalance vendor influence and preserve service continuity.
- Partnerships: stickiness with key vendors
- Risk: API/license changes ↑ switching costs
- Mitigation: open standards + in-house dev
- Balance: co-innovation agreements
ESG, materials, and compliance
Restrictions like RoHS/REACH (ECHA lists ~23,000 registered substances in 2024) and concentration of rare‑earth supply (China ~60% of global production in 2024) shrink qualified supplier pools, while rigorous compliance and audit demands strengthen the negotiating power of approved vendors. Ricoh’s supplier development programs can expand compliant capacity, and long‑term ESG alignment supports steadier, more favorable terms.
- Supply concentration: China ~60% of rare earths (2024)
- Regulatory scope: ~23,000 REACH-registered substances (2024)
- Effect: fewer approved suppliers, higher supplier leverage
- Mitigation: Ricoh supplier development and ESG alignment
Supplier leverage rises as rare-earth and semiconductor concentration extend lead times
Specialist parts concentration (print engines, ASICs) and long qualification cycles give suppliers strong leverage, with disruptions extending lead times and SLAs. Ricoh reduced exposure in 2024 via dual‑sourcing, global procurement and framework agreements. Regulatory and raw‑material concentration (China ~60% rare earths; REACH ~23,000 substances) keep supplier power elevated.
| Metric | 2024 | Impact |
|---|---|---|
| Rare earths | ~60% | Supply concentration |
| REACH substances | ~23,000 | Fewer approved suppliers |
| Semiconductor lead time | ~12 weeks | Switching cost |
| Freight rate (FEU) | $2–3k | Logistics cost |
What is included in the product
Detailed Word Document
Tailored Porter's Five Forces analysis for Ricoh that uncovers competitive rivalry, buyer/supplier power, threat of substitutes and new entrants, highlighting disruptive forces and pricing pressures to inform strategic decisions.
Customizable Excel Spreadsheet
A clear one-sheet Porter's Five Forces for Ricoh that distills supplier, buyer, entrant, substitute, and rivalry pressures into actionable insights for faster strategic decisions. Customizable scores and a radar visual make updates for new market shifts quick and slide-ready for decks or reports.
Customers Bargaining Power
Enterprise and public RFP leverage
Large enterprises and public agencies procure via competitive tenders, forcing price concessions typically in the mid-teens to mid-30s percentage range on equipment and services during RFPs.
Multi-year managed print services contracts — a global MPS market of roughly $30–35 billion in 2024 — increase buyer leverage as suppliers bid on predictable recurring revenue.
Buyers standardize SLAs, embed financial penalties for downtime and performance misses, and trade committed volumes for aggressive volume discounts and rebate structures.
Switching costs and embedded workflows
Fleet management tools, driver stacks, security policies and user training create tangible switching frictions for Ricoh customers, especially where integration with document workflows and DMS is deep; DMS adoption exceeded 70% among enterprises in 2024, raising replacement hurdles. Rivals now offer migration utilities and professional services that lower migration hours and costs, so net switching costs remain meaningful but not prohibitive.
TCO and outcome-based pricing
Buyers now scrutinize total cost of ownership—device price, consumables, service and energy—demanding clear TCO models; in 2024 pay-per-use and outcome SLAs accounted for about 30% of new managed print contracts, shifting uptime and consumption risk to vendors. Ricoh must justify value with measurable uptime, automation and analytics to protect margins. Transparent benchmarking and published SLAs compress pricing power and limit margin expansion.
Abundant alternatives
Hybrid work and volume variability
Hybrid work has cut office print volumes, with IDC reporting global hardcopy peripherals shipments fell about 8% year-on-year in 2023, giving buyers leverage to renegotiate contracts and defer refresh cycles, pressuring Ricoh pricing; customers favor flexible, scalable contracts over fixed fleets, forcing vendors to bundle IT and managed-services to defend recurring revenue.
- Buyer leverage: lower volumes, contract renegotiation
- Preference: scalable/consumption pricing over fixed fleets
- Pressure: deferred refresh cycles hit ARPU and pricing
- Defense: bundling IT/MPS to protect service revenue
Buyers squeeze MPS vendors as pay-per-use hits ~30%, DMS >70%, shipments -8%
Customers hold strong bargaining power: competitive RFPs force mid-teens to mid-30s% concessions and split awards among HP, Canon and others.
MPS market ~$30–35B (2024); pay-per-use/outcome SLAs ~30% of new MPS deals (2024), shifting risk to vendors.
DMS adoption >70% (2024) and an 8% global hardcopy shipment decline (2023) raise switching frictions but increase renegotiation leverage.
| Metric | Value |
|---|---|
| MPS market (2024) | $30–35B |
| Pay-per-use share (2024) | ~30% |
| DMS adoption (2024) | >70% |
| Hardcopy shipments YoY (2023) | -8% |
Same Document Delivered
Ricoh Porter's Five Forces Analysis
This preview shows the exact Ricoh Porter's Five Forces analysis you'll receive immediately after purchase—no surprises, no placeholders. The full document is professionally formatted and ready to download, delivering a concise assessment of competitive rivalry, supplier and buyer power, and threats of new entrants and substitutes with clear strategic implications.
Description
Go Beyond the Preview—Access the Full Strategic Report
Ricoh’s Porter's Five Forces snapshot highlights moderate supplier and buyer power, intense digital-era rivalry, manageable threats from new entrants, and rising substitute risks from cloud services; strategic moves must balance cost, innovation, and partnerships. This brief overview only scratches the surface—unlock the full analysis to access force-by-force ratings, visuals, and actionable recommendations.
Suppliers Bargaining Power
Specialized imaging components
Core parts like print engines, precision optics and controller ASICs come from a limited pool of specialists, concentrating supply and raising Ricoh’s dependency. This concentration can push lead times beyond 12 weeks and give suppliers pricing power. Technical qualification cycles commonly take 6–18 months, limiting rapid supplier switches. Any disruption can cascade across production and service SLAs, increasing downtime risk.
Commodity inputs and multi-sourcing
Ricoh dilutes supplier power by dual-sourcing standard components such as plastics, sheet metal and power supplies, supported by competitive bidding and global procurement offices established in 2024. Volume aggregation across product lines secures better pricing and improved lead times. Long‑term framework agreements stabilize costs and availability, reducing spot exposure. These measures collectively strengthen negotiating leverage versus commodity suppliers.
Supply chain volatility and logistics
Semiconductor cycles (lead times >20 weeks in 2021–22, averaging ~12 weeks in 2024), freight constraints (container rates down from 2021 peaks near $10,300/FEU to roughly $2,000–3,000/FEU in 2024) and currency swings shift bargaining power upstream. Elevated logistics costs have compressed manufacturing margins by ~1–2 ppt; Ricoh uses buffer inventories and regional manufacturing, yet suppliers still imposed surcharges up to mid-single-digit percent in tight months.
Software and cloud dependencies
Ricoh’s partnerships for embedded software, security modules and cloud connectors create vendor stickiness that raises integration and support costs; API or license changes can materially increase switching costs amid a 2024 public cloud market exceeding 600 billion USD. Open standards and selective in-house development reduce lock-in, while co-innovation agreements help rebalance vendor influence and preserve service continuity.
- Partnerships: stickiness with key vendors
- Risk: API/license changes ↑ switching costs
- Mitigation: open standards + in-house dev
- Balance: co-innovation agreements
ESG, materials, and compliance
Restrictions like RoHS/REACH (ECHA lists ~23,000 registered substances in 2024) and concentration of rare‑earth supply (China ~60% of global production in 2024) shrink qualified supplier pools, while rigorous compliance and audit demands strengthen the negotiating power of approved vendors. Ricoh’s supplier development programs can expand compliant capacity, and long‑term ESG alignment supports steadier, more favorable terms.
- Supply concentration: China ~60% of rare earths (2024)
- Regulatory scope: ~23,000 REACH-registered substances (2024)
- Effect: fewer approved suppliers, higher supplier leverage
- Mitigation: Ricoh supplier development and ESG alignment
Supplier leverage rises as rare-earth and semiconductor concentration extend lead times
Specialist parts concentration (print engines, ASICs) and long qualification cycles give suppliers strong leverage, with disruptions extending lead times and SLAs. Ricoh reduced exposure in 2024 via dual‑sourcing, global procurement and framework agreements. Regulatory and raw‑material concentration (China ~60% rare earths; REACH ~23,000 substances) keep supplier power elevated.
| Metric | 2024 | Impact |
|---|---|---|
| Rare earths | ~60% | Supply concentration |
| REACH substances | ~23,000 | Fewer approved suppliers |
| Semiconductor lead time | ~12 weeks | Switching cost |
| Freight rate (FEU) | $2–3k | Logistics cost |
What is included in the product
Detailed Word Document
Tailored Porter's Five Forces analysis for Ricoh that uncovers competitive rivalry, buyer/supplier power, threat of substitutes and new entrants, highlighting disruptive forces and pricing pressures to inform strategic decisions.
Customizable Excel Spreadsheet
A clear one-sheet Porter's Five Forces for Ricoh that distills supplier, buyer, entrant, substitute, and rivalry pressures into actionable insights for faster strategic decisions. Customizable scores and a radar visual make updates for new market shifts quick and slide-ready for decks or reports.
Customers Bargaining Power
Enterprise and public RFP leverage
Large enterprises and public agencies procure via competitive tenders, forcing price concessions typically in the mid-teens to mid-30s percentage range on equipment and services during RFPs.
Multi-year managed print services contracts — a global MPS market of roughly $30–35 billion in 2024 — increase buyer leverage as suppliers bid on predictable recurring revenue.
Buyers standardize SLAs, embed financial penalties for downtime and performance misses, and trade committed volumes for aggressive volume discounts and rebate structures.
Switching costs and embedded workflows
Fleet management tools, driver stacks, security policies and user training create tangible switching frictions for Ricoh customers, especially where integration with document workflows and DMS is deep; DMS adoption exceeded 70% among enterprises in 2024, raising replacement hurdles. Rivals now offer migration utilities and professional services that lower migration hours and costs, so net switching costs remain meaningful but not prohibitive.
TCO and outcome-based pricing
Buyers now scrutinize total cost of ownership—device price, consumables, service and energy—demanding clear TCO models; in 2024 pay-per-use and outcome SLAs accounted for about 30% of new managed print contracts, shifting uptime and consumption risk to vendors. Ricoh must justify value with measurable uptime, automation and analytics to protect margins. Transparent benchmarking and published SLAs compress pricing power and limit margin expansion.
Abundant alternatives
Hybrid work and volume variability
Hybrid work has cut office print volumes, with IDC reporting global hardcopy peripherals shipments fell about 8% year-on-year in 2023, giving buyers leverage to renegotiate contracts and defer refresh cycles, pressuring Ricoh pricing; customers favor flexible, scalable contracts over fixed fleets, forcing vendors to bundle IT and managed-services to defend recurring revenue.
- Buyer leverage: lower volumes, contract renegotiation
- Preference: scalable/consumption pricing over fixed fleets
- Pressure: deferred refresh cycles hit ARPU and pricing
- Defense: bundling IT/MPS to protect service revenue
Buyers squeeze MPS vendors as pay-per-use hits ~30%, DMS >70%, shipments -8%
Customers hold strong bargaining power: competitive RFPs force mid-teens to mid-30s% concessions and split awards among HP, Canon and others.
MPS market ~$30–35B (2024); pay-per-use/outcome SLAs ~30% of new MPS deals (2024), shifting risk to vendors.
DMS adoption >70% (2024) and an 8% global hardcopy shipment decline (2023) raise switching frictions but increase renegotiation leverage.
| Metric | Value |
|---|---|
| MPS market (2024) | $30–35B |
| Pay-per-use share (2024) | ~30% |
| DMS adoption (2024) | >70% |
| Hardcopy shipments YoY (2023) | -8% |
Same Document Delivered
Ricoh Porter's Five Forces Analysis
This preview shows the exact Ricoh Porter's Five Forces analysis you'll receive immediately after purchase—no surprises, no placeholders. The full document is professionally formatted and ready to download, delivering a concise assessment of competitive rivalry, supplier and buyer power, and threats of new entrants and substitutes with clear strategic implications.











