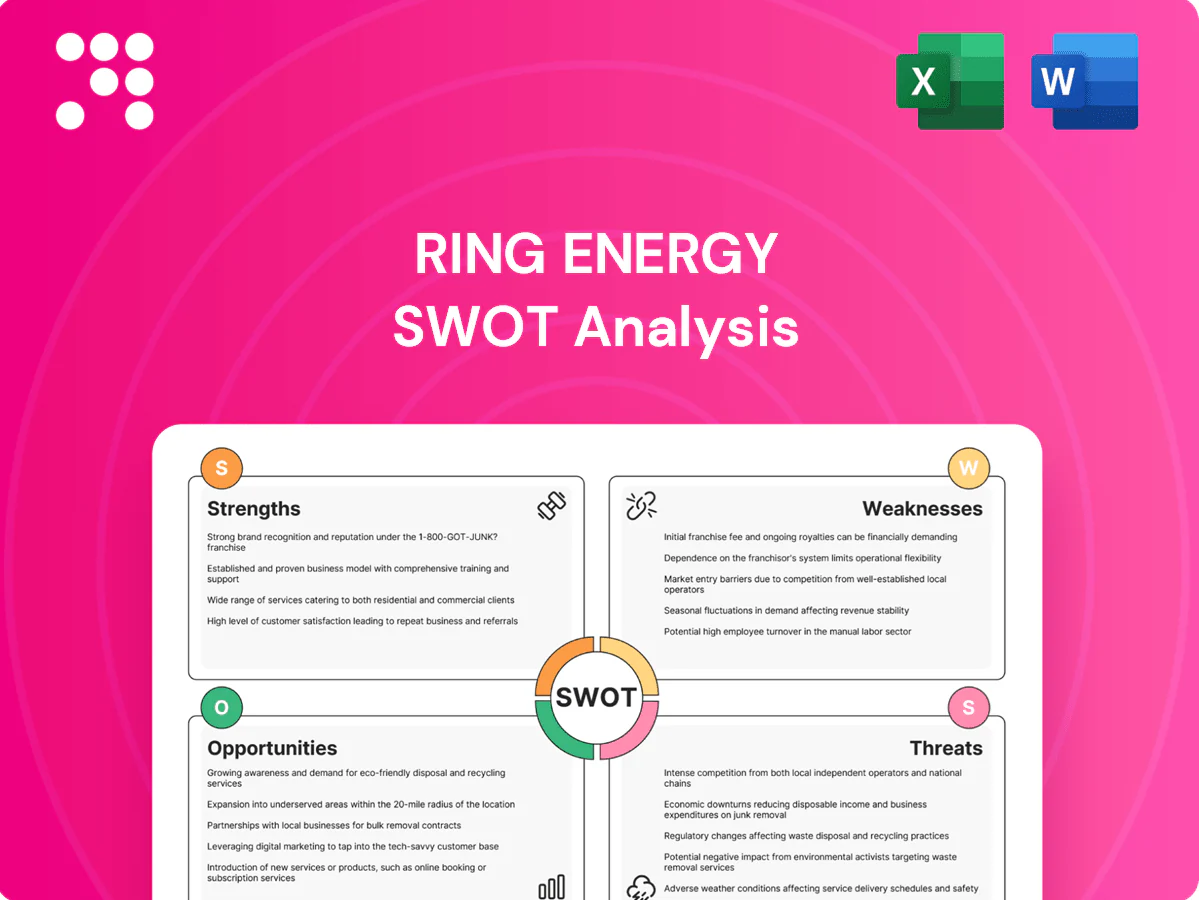
Ring Energy SWOT Analysis

Go Beyond the Preview—Access the Full Strategic Report
Ring Energy’s SWOT highlights resilient low-cost oil exposure, asset concentration risks, regulatory and commodity volatility, and potential upside from efficiency gains and acreage optimization. Want actionable depth and financial context? Purchase the full SWOT for a professionally written, editable Word report and bonus Excel model to support investment, planning, and presentations.
Strengths

Permian Basin footprint
Operating in the Permian Basin gives Ring Energy access to prolific reservoirs and established midstream and service infrastructure; the Permian produced over 5 million b/d of crude in recent years. Well-understood geology in the region improves drilling predictability and cycle times. Proximity to multiple takeaway routes helps compress basis differentials, and concentrating activity in one core area drives operational scale and cost efficiencies.
Focused development strategy
Concentrating capital on targeted development within Ring Energy’s existing acreage lifts recovery and reserves efficiently by enabling delineated inventory and repeatable well designs that drive cost control. Pad drilling and optimization cut non-productive time, improving cycle times and uptime. This disciplined, repeatable program supports capital efficiency across commodity cycles.

Operational flexibility
As an independent, Ring Energy can quickly adjust drilling pace to commodity prices, enabling faster capex modulation and preserving margins. Its relatively compact asset base allows prioritization of highest-return locations and well-by-well tailoring of vendor and completion designs. This operational agility supports cash flow stability and resilience during price volatility.

Existing infrastructure
Existing infrastructure in West Texas/New Mexico gives Ring Energy quicker, lower‑cost tie‑ins through legacy facilities and gathering lines, shortening time‑to‑sales and improving project paybacks versus greenfield builds.
Shared midstream lowers per‑barrel lifting and transport costs and cuts execution risk compared with frontier basins, enabling faster cash flow realization.
Reservoir and spacing know-how
Localized reservoir and spacing know-how improves Ring Energy well placement, with field-level optimization historically delivering EUR uplifts in the mid-teens and decline-rate reductions in the high-single digits per industry studies through 2024.
Prior campaign data directly informs completion and spacing design, enabling continuous learning loops that compound EUR gains and lower decline, supporting higher repeatable returns over time.
- EUR uplift: mid-teens%
- Decline cut: high-single digits%
- Data-driven spacing → higher repeatability
Permian access to >5M b/d, repeatable designs drive mid‑teens EUR gains
Operating in the Permian (over 5 million b/d crude) gives Ring Energy access to prolific reservoirs, established midstream and lower execution risk. Localized reservoir know-how and repeatable designs have driven EUR uplifts in the mid-teens and decline reductions in the high-single digits. Compact asset base and legacy gathering enable faster tie‑ins, shorter time‑to‑sales and agile capex modulation.
| Metric | Value |
|---|---|
| Permian crude | >5 million b/d |
| EUR uplift | mid-teens % |
| Decline reduction | high-single digits % |
What is included in the product
 Detailed Word Document
Provides a clear SWOT framework analyzing Ring Energy’s internal strengths and weaknesses and its external opportunities and threats, mapping competitive position, growth drivers, operational gaps, and key risks shaping the company’s strategic outlook.

 Customizable Excel Spreadsheet
Provides a concise Ring Energy SWOT matrix for fast, visual strategy alignment and quick stakeholder briefings.
Weaknesses

Single-basin concentration
Heavy exposure to one basin concentrates geological and operational risk: weather, service bottlenecks, or regional regulatory shifts can materially impact results; lack of geographic diversification reduces resilience to local disruptions and can limit access to varied crude markets.
Commodity price sensitivity
Revenue and cash flow at Ring Energy track oil and gas prices, with WTI swinging roughly $60–$90/bbl during 2024, compressing margins when prices dip. Downturns can cut drilling inventory that meets internal hurdle rates (commonly $50–60/bbl), shrinking funded development. Hedging reduces but does not remove price volatility risk. Frequent pace adjustments to capex hurt scale and operational efficiency.

Scale constraints
Ring Energy’s smaller scale drives higher cost of capital versus majors, reflected in lending spreads and equity volatility; the company’s market cap was roughly $800M mid‑2025, limiting access to cheaper capital pools. Limited scale reduces negotiating leverage with service providers, pressuring per‑well costs. G&A burden per barrel can rise materially in downturns, and finite balance sheet capacity constrains development tempo and acreage conversion.

Inventory depth uncertainty
Future drilling locations and quality at Ring Energy carry inventory depth uncertainty without continuous delineation, reducing clarity on sustainable supply.
Parent-child interference and spacing limits can restrict infill potential, particularly in stacked benches where well interaction is material.
Variable performance across benches and sections complicates long-term growth visibility and capital allocation decisions.
- inventory uncertainty
- parent-child interference
- bench variability
Decline management
Unconventional wells commonly show 60–80% first-year declines, forcing Ring Energy into continuous reinvestment to arrest output drops. Sustaining flat production requires a steady drilling cadence and recurring capital, and capital intensity can rise 10–20% if service costs inflate or well results normalize. This dynamic tightens the trade-off between growth and free cash flow.
- 60–80% first-year decline
- 10–20% potential capital-cost inflation
- Ongoing drilling needed to sustain production
Delaware Basin concentration, WTI sensitivity, steep 60–80% declines raise cost of capital $800M
Concentrated Delaware Basin exposure raises geological, service and regulatory risk and limits market optionality; mid‑2025 market cap ≈ $800M increases cost of capital. Revenue and cash flow remain WTI‑sensitive (WTI swung ~$60–$90/bbl in 2024); 60–80% 1st‑year declines force continuous drilling. Capital intensity can rise 10–20% with cost inflation.
| Metric | Value |
|---|---|
| Market cap (mid‑2025) | $800M |
| WTI 2024 range | $60–$90/bbl |
| 1st‑yr decline | 60–80% |
| Capex inflation risk | 10–20% |
Same Document Delivered
Ring Energy SWOT Analysis
This is the actual SWOT analysis document you’ll receive upon purchase—no surprises, just professional quality. The preview below is taken directly from the full report you'll get, covering Ring Energy's strengths, weaknesses, opportunities, and threats. Buy now to unlock the complete, editable version ready for immediate download and use.

Go Beyond the Preview—Access the Full Strategic Report
Ring Energy’s SWOT highlights resilient low-cost oil exposure, asset concentration risks, regulatory and commodity volatility, and potential upside from efficiency gains and acreage optimization. Want actionable depth and financial context? Purchase the full SWOT for a professionally written, editable Word report and bonus Excel model to support investment, planning, and presentations.
Strengths
Permian Basin footprint
Operating in the Permian Basin gives Ring Energy access to prolific reservoirs and established midstream and service infrastructure; the Permian produced over 5 million b/d of crude in recent years. Well-understood geology in the region improves drilling predictability and cycle times. Proximity to multiple takeaway routes helps compress basis differentials, and concentrating activity in one core area drives operational scale and cost efficiencies.
Focused development strategy
Concentrating capital on targeted development within Ring Energy’s existing acreage lifts recovery and reserves efficiently by enabling delineated inventory and repeatable well designs that drive cost control. Pad drilling and optimization cut non-productive time, improving cycle times and uptime. This disciplined, repeatable program supports capital efficiency across commodity cycles.
Operational flexibility
As an independent, Ring Energy can quickly adjust drilling pace to commodity prices, enabling faster capex modulation and preserving margins. Its relatively compact asset base allows prioritization of highest-return locations and well-by-well tailoring of vendor and completion designs. This operational agility supports cash flow stability and resilience during price volatility.
Existing infrastructure
Existing infrastructure in West Texas/New Mexico gives Ring Energy quicker, lower‑cost tie‑ins through legacy facilities and gathering lines, shortening time‑to‑sales and improving project paybacks versus greenfield builds.
Shared midstream lowers per‑barrel lifting and transport costs and cuts execution risk compared with frontier basins, enabling faster cash flow realization.
Reservoir and spacing know-how
Localized reservoir and spacing know-how improves Ring Energy well placement, with field-level optimization historically delivering EUR uplifts in the mid-teens and decline-rate reductions in the high-single digits per industry studies through 2024.
Prior campaign data directly informs completion and spacing design, enabling continuous learning loops that compound EUR gains and lower decline, supporting higher repeatable returns over time.
- EUR uplift: mid-teens%
- Decline cut: high-single digits%
- Data-driven spacing → higher repeatability
Permian access to >5M b/d, repeatable designs drive mid‑teens EUR gains
Operating in the Permian (over 5 million b/d crude) gives Ring Energy access to prolific reservoirs, established midstream and lower execution risk. Localized reservoir know-how and repeatable designs have driven EUR uplifts in the mid-teens and decline reductions in the high-single digits. Compact asset base and legacy gathering enable faster tie‑ins, shorter time‑to‑sales and agile capex modulation.
| Metric | Value |
|---|---|
| Permian crude | >5 million b/d |
| EUR uplift | mid-teens % |
| Decline reduction | high-single digits % |
What is included in the product
Detailed Word Document
Provides a clear SWOT framework analyzing Ring Energy’s internal strengths and weaknesses and its external opportunities and threats, mapping competitive position, growth drivers, operational gaps, and key risks shaping the company’s strategic outlook.
Customizable Excel Spreadsheet
Provides a concise Ring Energy SWOT matrix for fast, visual strategy alignment and quick stakeholder briefings.
Weaknesses
Single-basin concentration
Heavy exposure to one basin concentrates geological and operational risk: weather, service bottlenecks, or regional regulatory shifts can materially impact results; lack of geographic diversification reduces resilience to local disruptions and can limit access to varied crude markets.
Commodity price sensitivity
Revenue and cash flow at Ring Energy track oil and gas prices, with WTI swinging roughly $60–$90/bbl during 2024, compressing margins when prices dip. Downturns can cut drilling inventory that meets internal hurdle rates (commonly $50–60/bbl), shrinking funded development. Hedging reduces but does not remove price volatility risk. Frequent pace adjustments to capex hurt scale and operational efficiency.
Scale constraints
Ring Energy’s smaller scale drives higher cost of capital versus majors, reflected in lending spreads and equity volatility; the company’s market cap was roughly $800M mid‑2025, limiting access to cheaper capital pools. Limited scale reduces negotiating leverage with service providers, pressuring per‑well costs. G&A burden per barrel can rise materially in downturns, and finite balance sheet capacity constrains development tempo and acreage conversion.
Inventory depth uncertainty
Future drilling locations and quality at Ring Energy carry inventory depth uncertainty without continuous delineation, reducing clarity on sustainable supply.
Parent-child interference and spacing limits can restrict infill potential, particularly in stacked benches where well interaction is material.
Variable performance across benches and sections complicates long-term growth visibility and capital allocation decisions.
- inventory uncertainty
- parent-child interference
- bench variability
Decline management
Unconventional wells commonly show 60–80% first-year declines, forcing Ring Energy into continuous reinvestment to arrest output drops. Sustaining flat production requires a steady drilling cadence and recurring capital, and capital intensity can rise 10–20% if service costs inflate or well results normalize. This dynamic tightens the trade-off between growth and free cash flow.
- 60–80% first-year decline
- 10–20% potential capital-cost inflation
- Ongoing drilling needed to sustain production
Delaware Basin concentration, WTI sensitivity, steep 60–80% declines raise cost of capital $800M
Concentrated Delaware Basin exposure raises geological, service and regulatory risk and limits market optionality; mid‑2025 market cap ≈ $800M increases cost of capital. Revenue and cash flow remain WTI‑sensitive (WTI swung ~$60–$90/bbl in 2024); 60–80% 1st‑year declines force continuous drilling. Capital intensity can rise 10–20% with cost inflation.
| Metric | Value |
|---|---|
| Market cap (mid‑2025) | $800M |
| WTI 2024 range | $60–$90/bbl |
| 1st‑yr decline | 60–80% |
| Capex inflation risk | 10–20% |
Same Document Delivered
Ring Energy SWOT Analysis
This is the actual SWOT analysis document you’ll receive upon purchase—no surprises, just professional quality. The preview below is taken directly from the full report you'll get, covering Ring Energy's strengths, weaknesses, opportunities, and threats. Buy now to unlock the complete, editable version ready for immediate download and use.
Description
Go Beyond the Preview—Access the Full Strategic Report
Ring Energy’s SWOT highlights resilient low-cost oil exposure, asset concentration risks, regulatory and commodity volatility, and potential upside from efficiency gains and acreage optimization. Want actionable depth and financial context? Purchase the full SWOT for a professionally written, editable Word report and bonus Excel model to support investment, planning, and presentations.
Strengths
Permian Basin footprint
Operating in the Permian Basin gives Ring Energy access to prolific reservoirs and established midstream and service infrastructure; the Permian produced over 5 million b/d of crude in recent years. Well-understood geology in the region improves drilling predictability and cycle times. Proximity to multiple takeaway routes helps compress basis differentials, and concentrating activity in one core area drives operational scale and cost efficiencies.
Focused development strategy
Concentrating capital on targeted development within Ring Energy’s existing acreage lifts recovery and reserves efficiently by enabling delineated inventory and repeatable well designs that drive cost control. Pad drilling and optimization cut non-productive time, improving cycle times and uptime. This disciplined, repeatable program supports capital efficiency across commodity cycles.
Operational flexibility
As an independent, Ring Energy can quickly adjust drilling pace to commodity prices, enabling faster capex modulation and preserving margins. Its relatively compact asset base allows prioritization of highest-return locations and well-by-well tailoring of vendor and completion designs. This operational agility supports cash flow stability and resilience during price volatility.
Existing infrastructure
Existing infrastructure in West Texas/New Mexico gives Ring Energy quicker, lower‑cost tie‑ins through legacy facilities and gathering lines, shortening time‑to‑sales and improving project paybacks versus greenfield builds.
Shared midstream lowers per‑barrel lifting and transport costs and cuts execution risk compared with frontier basins, enabling faster cash flow realization.
Reservoir and spacing know-how
Localized reservoir and spacing know-how improves Ring Energy well placement, with field-level optimization historically delivering EUR uplifts in the mid-teens and decline-rate reductions in the high-single digits per industry studies through 2024.
Prior campaign data directly informs completion and spacing design, enabling continuous learning loops that compound EUR gains and lower decline, supporting higher repeatable returns over time.
- EUR uplift: mid-teens%
- Decline cut: high-single digits%
- Data-driven spacing → higher repeatability
Permian access to >5M b/d, repeatable designs drive mid‑teens EUR gains
Operating in the Permian (over 5 million b/d crude) gives Ring Energy access to prolific reservoirs, established midstream and lower execution risk. Localized reservoir know-how and repeatable designs have driven EUR uplifts in the mid-teens and decline reductions in the high-single digits. Compact asset base and legacy gathering enable faster tie‑ins, shorter time‑to‑sales and agile capex modulation.
| Metric | Value |
|---|---|
| Permian crude | >5 million b/d |
| EUR uplift | mid-teens % |
| Decline reduction | high-single digits % |
What is included in the product
Detailed Word Document
Provides a clear SWOT framework analyzing Ring Energy’s internal strengths and weaknesses and its external opportunities and threats, mapping competitive position, growth drivers, operational gaps, and key risks shaping the company’s strategic outlook.
Customizable Excel Spreadsheet
Provides a concise Ring Energy SWOT matrix for fast, visual strategy alignment and quick stakeholder briefings.
Weaknesses
Single-basin concentration
Heavy exposure to one basin concentrates geological and operational risk: weather, service bottlenecks, or regional regulatory shifts can materially impact results; lack of geographic diversification reduces resilience to local disruptions and can limit access to varied crude markets.
Commodity price sensitivity
Revenue and cash flow at Ring Energy track oil and gas prices, with WTI swinging roughly $60–$90/bbl during 2024, compressing margins when prices dip. Downturns can cut drilling inventory that meets internal hurdle rates (commonly $50–60/bbl), shrinking funded development. Hedging reduces but does not remove price volatility risk. Frequent pace adjustments to capex hurt scale and operational efficiency.
Scale constraints
Ring Energy’s smaller scale drives higher cost of capital versus majors, reflected in lending spreads and equity volatility; the company’s market cap was roughly $800M mid‑2025, limiting access to cheaper capital pools. Limited scale reduces negotiating leverage with service providers, pressuring per‑well costs. G&A burden per barrel can rise materially in downturns, and finite balance sheet capacity constrains development tempo and acreage conversion.
Inventory depth uncertainty
Future drilling locations and quality at Ring Energy carry inventory depth uncertainty without continuous delineation, reducing clarity on sustainable supply.
Parent-child interference and spacing limits can restrict infill potential, particularly in stacked benches where well interaction is material.
Variable performance across benches and sections complicates long-term growth visibility and capital allocation decisions.
- inventory uncertainty
- parent-child interference
- bench variability
Decline management
Unconventional wells commonly show 60–80% first-year declines, forcing Ring Energy into continuous reinvestment to arrest output drops. Sustaining flat production requires a steady drilling cadence and recurring capital, and capital intensity can rise 10–20% if service costs inflate or well results normalize. This dynamic tightens the trade-off between growth and free cash flow.
- 60–80% first-year decline
- 10–20% potential capital-cost inflation
- Ongoing drilling needed to sustain production
Delaware Basin concentration, WTI sensitivity, steep 60–80% declines raise cost of capital $800M
Concentrated Delaware Basin exposure raises geological, service and regulatory risk and limits market optionality; mid‑2025 market cap ≈ $800M increases cost of capital. Revenue and cash flow remain WTI‑sensitive (WTI swung ~$60–$90/bbl in 2024); 60–80% 1st‑year declines force continuous drilling. Capital intensity can rise 10–20% with cost inflation.
| Metric | Value |
|---|---|
| Market cap (mid‑2025) | $800M |
| WTI 2024 range | $60–$90/bbl |
| 1st‑yr decline | 60–80% |
| Capex inflation risk | 10–20% |
Same Document Delivered
Ring Energy SWOT Analysis
This is the actual SWOT analysis document you’ll receive upon purchase—no surprises, just professional quality. The preview below is taken directly from the full report you'll get, covering Ring Energy's strengths, weaknesses, opportunities, and threats. Buy now to unlock the complete, editable version ready for immediate download and use.











