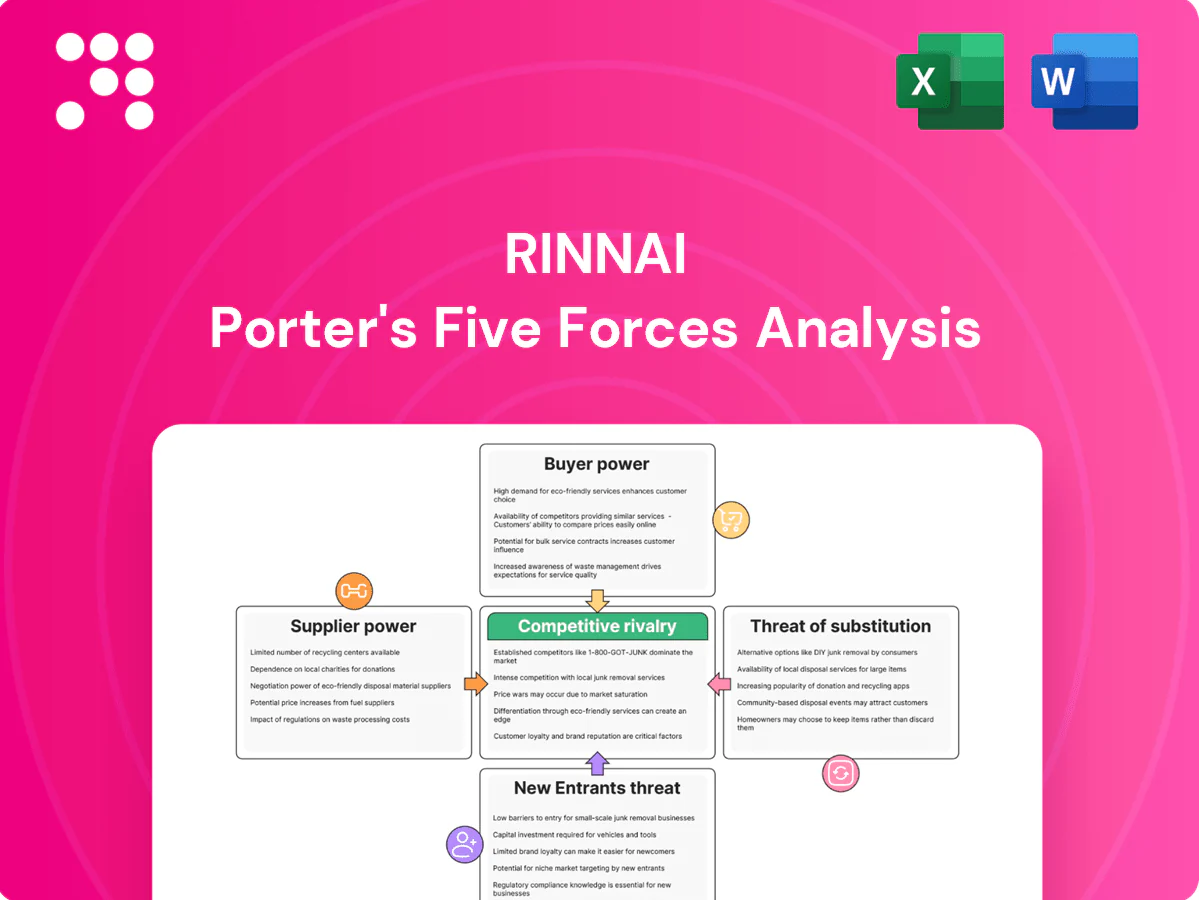
Rinnai Porter's Five Forces Analysis

Don't Miss the Bigger Picture
Rinnai’s Porter's Five Forces snapshot highlights moderate supplier power, strong buyer expectations, and competitive rivalry driven by innovation in heating and water systems. Substitutes and barriers to entry shape margins and growth prospects. This brief preview only scratches the surface—unlock the full Porter's Five Forces Analysis for force-by-force ratings, visuals, and strategic recommendations.
Suppliers Bargaining Power

Specialized component dependence
Rinnai depends on certified suppliers for burners, heat exchangers, valves and control electronics where 2024 safety and precision standards require lengthy validation; qualification cycles commonly exceed 12 months, increasing switching costs. Limited numbers of qualified vendors raise supplier leverage, especially for proprietary components. Dual-sourcing and in-house engineering reduce exposure but do not eliminate supplier power.
Commodity input volatility
Commodity input volatility—notably steel, copper, aluminum and rare metals—moves Rinnai’s bill-of-materials costs; in 2024 LME copper averaged ≈$9,500/t, aluminum ≈$2,400/t and HRC steel ≈$800/t, while NdPr rare-earths traded in the tens of $/kg, creating double-digit YoY swings that suppliers often pass through and squeeze margins unless hedged. Long-term contracts and design-to-cost reduce exposure, but persistent volatility can shift value capture upstream to raw-material providers.

Electronics and IoT modules
Microcontrollers, sensors and connectivity chips continued to face cycle shortages in 2024, with lead times often exceeding 20 weeks and allocation risks concentrated among Tier-1 suppliers. Tier-1 vendors prioritized high-volume customers, raising Rinnai’s exposure in tight markets and increasing procurement costs. Firmware integration in modules raises switching costs and lengthens qualification cycles. Strategic partnerships and buffer inventories mitigate but do not eliminate supplier power.

Certification and compliance constraints
Gas safety certifications JIS, UL and CE narrow Rinnai’s supplier pool; mandated compliance in 2024 keeps many vendors out. Requalification after a supplier change is costly and often takes months, with validation expenses frequently reaching six-figure levels, giving approved suppliers clear bargaining room. Advanced QA systems and inline testing partially rebalance negotiations by reducing switching risk and shortening qualification timelines.
- Certifications: JIS, UL, CE limit suppliers
- Requalification: typically months
- Costs: validation often six-figure
- QA systems: lower switching risk, shorten lead times
Logistics and regionalization
Global supply chains expose Rinnai to volatile freight rates (spot container rates fell roughly 60% from 2021 peaks by mid‑2024), geopolitical risks, and tighter export controls; regionalized sourcing reduces those risks but limits supplier choice, strengthening local suppliers. Nearshoring boosts resilience at an estimated 10–25% higher unit cost while cutting lead times ~20–40%, and multi‑hub procurement helps preserve bargaining leverage.
- Freight volatility: ≈60% drop from 2021 peak to mid‑2024
- Nearshoring: +10–25% unit cost, −20–40% lead time
- Regionalization: fewer suppliers, higher local leverage
- Multi‑hub: balances risk and supplier bargaining power
Supplier concentration and commodity swings squeeze margins; regionalization raises unit costs
Rinnai faces elevated supplier power from certified, limited vendors, long requalification (months) and six‑figure validation costs; commodity and component volatility in 2024 squeezed margins despite hedges. Dual‑sourcing, in‑house design and buffer stock mitigate but do not eliminate leverage. Regionalization raises resilience at higher unit cost.
| Metric | 2024 value |
|---|---|
| Copper (LME) | $9,500/t |
| Chip lead time | ≥20 weeks |
| Validation cost | Six‑figure (USD) |
| Freight vs 2021 peak | −60% |
| Nearshore impact | +10–25% cost, −20–40% lead time |
What is included in the product
 Detailed Word Document
Tailored Porter's Five Forces analysis for Rinnai that uncovers competitive intensity, supplier and buyer leverage, substitute threats, and entry barriers, highlighting disruptive forces and strategic levers to protect market share and profitability.

 Customizable Excel Spreadsheet
A compact one-sheet Porter's Five Forces for Rinnai that visualizes competitive pressure with a spider chart and lets you toggle scenarios, swap in company data, and export clean slides—no macros or finance jargon required.
Customers Bargaining Power

Channel concentration
Distributors, big-box retailers and large contractors concentrate Rinnai demand; Home Depot alone reported $157.4B in FY2024, giving these channels strong price and slotting leverage. Losing a key account can sharply reduce plant utilization and margins. Co-op marketing funds and exclusive SKUs help preserve placement and soften pure price pressure.
Installation-driven switching costs
Vent configurations, gas lines, and control systems create moderate switching frictions for installers, but compatible SKUs let installers substitute brands when site plumbing/electrical align. Rinnai's product training and rebates introduced through 2024 increased installer stickiness, while warranty and service responsiveness remain the top loyalty drivers. Installers cite warranty terms (commonly multi-year limited warranties) and local service speed as decisive factors.

End-user price sensitivity
Homeowners and SMBs weigh upfront premiums against efficiency and reliability, with payback periods commonly cited at 3–5 years for high-efficiency tankless systems; incentives and regional energy prices can shift willingness to pay. Over three quarters of buyers consult online reviews and comparison tools, increasing price transparency and negotiation leverage. Financing options and total cost-of-ownership messaging narrow perceived price gaps.

Commercial specification power
Hospitality, multifamily and industrial buyers issue RFPs with tight performance specs and increasingly require uptime guarantees and service SLAs; in 2024 many commercial SLAs target 99.9% uptime. Buyers push for volume discounts and post-sale parts availability is often decisive to win or retain accounts. Bundled solutions shift evaluation from unit price to total lifecycle value.
- RFP-driven specs
- 99.9% SLA expectations
- Volume discount pressure
- Parts availability = retention
- Bundled lifecycle pricing
Electrification preferences
- Market trend: heat pump sales +20% (2023)
- Customer leverage: preference for low-carbon options
- Mitigation: hybrid and high-efficiency models
- Retention: education plus compliance docs
Concentrated channels boost buyer leverage; review-driven installers face margin pressure
Concentrated channels (Home Depot $157.4B FY2024) and large contractors give buyers strong price/slotting leverage; losing a key account can cut utilization and margins. Installers face moderate switching costs but increased transparency (75% consult reviews) raises negotiation power; warranties, rebates and training boost stickiness. Commercial RFPs demand 99.9% SLAs and volume discounts; heat-pump sales +20% (2023) raise low-carbon preference.
| Metric | Value |
|---|---|
| Home Depot revenue (FY2024) | $157.4B |
| Buyer review usage | 75% |
| Heat pump sales change (2023) | +20% |
| Common payback (tankless) | 3–5 yrs |
| Commercial SLA expectation | 99.9% |
Full Version Awaits
Rinnai Porter's Five Forces Analysis
This preview shows the exact Rinnai Porter’s Five Forces Analysis you’ll receive immediately after purchase—no placeholders or mockups. The document displayed is the full, professionally formatted file, ready for download and use the moment you buy. You’re previewing the final deliverable, the same analysis that will be available to you instantly after payment.

Don't Miss the Bigger Picture
Rinnai’s Porter's Five Forces snapshot highlights moderate supplier power, strong buyer expectations, and competitive rivalry driven by innovation in heating and water systems. Substitutes and barriers to entry shape margins and growth prospects. This brief preview only scratches the surface—unlock the full Porter's Five Forces Analysis for force-by-force ratings, visuals, and strategic recommendations.
Suppliers Bargaining Power
Specialized component dependence
Rinnai depends on certified suppliers for burners, heat exchangers, valves and control electronics where 2024 safety and precision standards require lengthy validation; qualification cycles commonly exceed 12 months, increasing switching costs. Limited numbers of qualified vendors raise supplier leverage, especially for proprietary components. Dual-sourcing and in-house engineering reduce exposure but do not eliminate supplier power.
Commodity input volatility
Commodity input volatility—notably steel, copper, aluminum and rare metals—moves Rinnai’s bill-of-materials costs; in 2024 LME copper averaged ≈$9,500/t, aluminum ≈$2,400/t and HRC steel ≈$800/t, while NdPr rare-earths traded in the tens of $/kg, creating double-digit YoY swings that suppliers often pass through and squeeze margins unless hedged. Long-term contracts and design-to-cost reduce exposure, but persistent volatility can shift value capture upstream to raw-material providers.
Electronics and IoT modules
Microcontrollers, sensors and connectivity chips continued to face cycle shortages in 2024, with lead times often exceeding 20 weeks and allocation risks concentrated among Tier-1 suppliers. Tier-1 vendors prioritized high-volume customers, raising Rinnai’s exposure in tight markets and increasing procurement costs. Firmware integration in modules raises switching costs and lengthens qualification cycles. Strategic partnerships and buffer inventories mitigate but do not eliminate supplier power.
Certification and compliance constraints
Gas safety certifications JIS, UL and CE narrow Rinnai’s supplier pool; mandated compliance in 2024 keeps many vendors out. Requalification after a supplier change is costly and often takes months, with validation expenses frequently reaching six-figure levels, giving approved suppliers clear bargaining room. Advanced QA systems and inline testing partially rebalance negotiations by reducing switching risk and shortening qualification timelines.
- Certifications: JIS, UL, CE limit suppliers
- Requalification: typically months
- Costs: validation often six-figure
- QA systems: lower switching risk, shorten lead times
Logistics and regionalization
Global supply chains expose Rinnai to volatile freight rates (spot container rates fell roughly 60% from 2021 peaks by mid‑2024), geopolitical risks, and tighter export controls; regionalized sourcing reduces those risks but limits supplier choice, strengthening local suppliers. Nearshoring boosts resilience at an estimated 10–25% higher unit cost while cutting lead times ~20–40%, and multi‑hub procurement helps preserve bargaining leverage.
- Freight volatility: ≈60% drop from 2021 peak to mid‑2024
- Nearshoring: +10–25% unit cost, −20–40% lead time
- Regionalization: fewer suppliers, higher local leverage
- Multi‑hub: balances risk and supplier bargaining power
Supplier concentration and commodity swings squeeze margins; regionalization raises unit costs
Rinnai faces elevated supplier power from certified, limited vendors, long requalification (months) and six‑figure validation costs; commodity and component volatility in 2024 squeezed margins despite hedges. Dual‑sourcing, in‑house design and buffer stock mitigate but do not eliminate leverage. Regionalization raises resilience at higher unit cost.
| Metric | 2024 value |
|---|---|
| Copper (LME) | $9,500/t |
| Chip lead time | ≥20 weeks |
| Validation cost | Six‑figure (USD) |
| Freight vs 2021 peak | −60% |
| Nearshore impact | +10–25% cost, −20–40% lead time |
What is included in the product
Detailed Word Document
Tailored Porter's Five Forces analysis for Rinnai that uncovers competitive intensity, supplier and buyer leverage, substitute threats, and entry barriers, highlighting disruptive forces and strategic levers to protect market share and profitability.
Customizable Excel Spreadsheet
A compact one-sheet Porter's Five Forces for Rinnai that visualizes competitive pressure with a spider chart and lets you toggle scenarios, swap in company data, and export clean slides—no macros or finance jargon required.
Customers Bargaining Power
Channel concentration
Distributors, big-box retailers and large contractors concentrate Rinnai demand; Home Depot alone reported $157.4B in FY2024, giving these channels strong price and slotting leverage. Losing a key account can sharply reduce plant utilization and margins. Co-op marketing funds and exclusive SKUs help preserve placement and soften pure price pressure.
Installation-driven switching costs
Vent configurations, gas lines, and control systems create moderate switching frictions for installers, but compatible SKUs let installers substitute brands when site plumbing/electrical align. Rinnai's product training and rebates introduced through 2024 increased installer stickiness, while warranty and service responsiveness remain the top loyalty drivers. Installers cite warranty terms (commonly multi-year limited warranties) and local service speed as decisive factors.
End-user price sensitivity
Homeowners and SMBs weigh upfront premiums against efficiency and reliability, with payback periods commonly cited at 3–5 years for high-efficiency tankless systems; incentives and regional energy prices can shift willingness to pay. Over three quarters of buyers consult online reviews and comparison tools, increasing price transparency and negotiation leverage. Financing options and total cost-of-ownership messaging narrow perceived price gaps.
Commercial specification power
Hospitality, multifamily and industrial buyers issue RFPs with tight performance specs and increasingly require uptime guarantees and service SLAs; in 2024 many commercial SLAs target 99.9% uptime. Buyers push for volume discounts and post-sale parts availability is often decisive to win or retain accounts. Bundled solutions shift evaluation from unit price to total lifecycle value.
- RFP-driven specs
- 99.9% SLA expectations
- Volume discount pressure
- Parts availability = retention
- Bundled lifecycle pricing
Electrification preferences
- Market trend: heat pump sales +20% (2023)
- Customer leverage: preference for low-carbon options
- Mitigation: hybrid and high-efficiency models
- Retention: education plus compliance docs
Concentrated channels boost buyer leverage; review-driven installers face margin pressure
Concentrated channels (Home Depot $157.4B FY2024) and large contractors give buyers strong price/slotting leverage; losing a key account can cut utilization and margins. Installers face moderate switching costs but increased transparency (75% consult reviews) raises negotiation power; warranties, rebates and training boost stickiness. Commercial RFPs demand 99.9% SLAs and volume discounts; heat-pump sales +20% (2023) raise low-carbon preference.
| Metric | Value |
|---|---|
| Home Depot revenue (FY2024) | $157.4B |
| Buyer review usage | 75% |
| Heat pump sales change (2023) | +20% |
| Common payback (tankless) | 3–5 yrs |
| Commercial SLA expectation | 99.9% |
Full Version Awaits
Rinnai Porter's Five Forces Analysis
This preview shows the exact Rinnai Porter’s Five Forces Analysis you’ll receive immediately after purchase—no placeholders or mockups. The document displayed is the full, professionally formatted file, ready for download and use the moment you buy. You’re previewing the final deliverable, the same analysis that will be available to you instantly after payment.
Original: $10.00
-65%$10.00
$3.50Description
Don't Miss the Bigger Picture
Rinnai’s Porter's Five Forces snapshot highlights moderate supplier power, strong buyer expectations, and competitive rivalry driven by innovation in heating and water systems. Substitutes and barriers to entry shape margins and growth prospects. This brief preview only scratches the surface—unlock the full Porter's Five Forces Analysis for force-by-force ratings, visuals, and strategic recommendations.
Suppliers Bargaining Power
Specialized component dependence
Rinnai depends on certified suppliers for burners, heat exchangers, valves and control electronics where 2024 safety and precision standards require lengthy validation; qualification cycles commonly exceed 12 months, increasing switching costs. Limited numbers of qualified vendors raise supplier leverage, especially for proprietary components. Dual-sourcing and in-house engineering reduce exposure but do not eliminate supplier power.
Commodity input volatility
Commodity input volatility—notably steel, copper, aluminum and rare metals—moves Rinnai’s bill-of-materials costs; in 2024 LME copper averaged ≈$9,500/t, aluminum ≈$2,400/t and HRC steel ≈$800/t, while NdPr rare-earths traded in the tens of $/kg, creating double-digit YoY swings that suppliers often pass through and squeeze margins unless hedged. Long-term contracts and design-to-cost reduce exposure, but persistent volatility can shift value capture upstream to raw-material providers.
Electronics and IoT modules
Microcontrollers, sensors and connectivity chips continued to face cycle shortages in 2024, with lead times often exceeding 20 weeks and allocation risks concentrated among Tier-1 suppliers. Tier-1 vendors prioritized high-volume customers, raising Rinnai’s exposure in tight markets and increasing procurement costs. Firmware integration in modules raises switching costs and lengthens qualification cycles. Strategic partnerships and buffer inventories mitigate but do not eliminate supplier power.
Certification and compliance constraints
Gas safety certifications JIS, UL and CE narrow Rinnai’s supplier pool; mandated compliance in 2024 keeps many vendors out. Requalification after a supplier change is costly and often takes months, with validation expenses frequently reaching six-figure levels, giving approved suppliers clear bargaining room. Advanced QA systems and inline testing partially rebalance negotiations by reducing switching risk and shortening qualification timelines.
- Certifications: JIS, UL, CE limit suppliers
- Requalification: typically months
- Costs: validation often six-figure
- QA systems: lower switching risk, shorten lead times
Logistics and regionalization
Global supply chains expose Rinnai to volatile freight rates (spot container rates fell roughly 60% from 2021 peaks by mid‑2024), geopolitical risks, and tighter export controls; regionalized sourcing reduces those risks but limits supplier choice, strengthening local suppliers. Nearshoring boosts resilience at an estimated 10–25% higher unit cost while cutting lead times ~20–40%, and multi‑hub procurement helps preserve bargaining leverage.
- Freight volatility: ≈60% drop from 2021 peak to mid‑2024
- Nearshoring: +10–25% unit cost, −20–40% lead time
- Regionalization: fewer suppliers, higher local leverage
- Multi‑hub: balances risk and supplier bargaining power
Supplier concentration and commodity swings squeeze margins; regionalization raises unit costs
Rinnai faces elevated supplier power from certified, limited vendors, long requalification (months) and six‑figure validation costs; commodity and component volatility in 2024 squeezed margins despite hedges. Dual‑sourcing, in‑house design and buffer stock mitigate but do not eliminate leverage. Regionalization raises resilience at higher unit cost.
| Metric | 2024 value |
|---|---|
| Copper (LME) | $9,500/t |
| Chip lead time | ≥20 weeks |
| Validation cost | Six‑figure (USD) |
| Freight vs 2021 peak | −60% |
| Nearshore impact | +10–25% cost, −20–40% lead time |
What is included in the product
Detailed Word Document
Tailored Porter's Five Forces analysis for Rinnai that uncovers competitive intensity, supplier and buyer leverage, substitute threats, and entry barriers, highlighting disruptive forces and strategic levers to protect market share and profitability.
Customizable Excel Spreadsheet
A compact one-sheet Porter's Five Forces for Rinnai that visualizes competitive pressure with a spider chart and lets you toggle scenarios, swap in company data, and export clean slides—no macros or finance jargon required.
Customers Bargaining Power
Channel concentration
Distributors, big-box retailers and large contractors concentrate Rinnai demand; Home Depot alone reported $157.4B in FY2024, giving these channels strong price and slotting leverage. Losing a key account can sharply reduce plant utilization and margins. Co-op marketing funds and exclusive SKUs help preserve placement and soften pure price pressure.
Installation-driven switching costs
Vent configurations, gas lines, and control systems create moderate switching frictions for installers, but compatible SKUs let installers substitute brands when site plumbing/electrical align. Rinnai's product training and rebates introduced through 2024 increased installer stickiness, while warranty and service responsiveness remain the top loyalty drivers. Installers cite warranty terms (commonly multi-year limited warranties) and local service speed as decisive factors.
End-user price sensitivity
Homeowners and SMBs weigh upfront premiums against efficiency and reliability, with payback periods commonly cited at 3–5 years for high-efficiency tankless systems; incentives and regional energy prices can shift willingness to pay. Over three quarters of buyers consult online reviews and comparison tools, increasing price transparency and negotiation leverage. Financing options and total cost-of-ownership messaging narrow perceived price gaps.
Commercial specification power
Hospitality, multifamily and industrial buyers issue RFPs with tight performance specs and increasingly require uptime guarantees and service SLAs; in 2024 many commercial SLAs target 99.9% uptime. Buyers push for volume discounts and post-sale parts availability is often decisive to win or retain accounts. Bundled solutions shift evaluation from unit price to total lifecycle value.
- RFP-driven specs
- 99.9% SLA expectations
- Volume discount pressure
- Parts availability = retention
- Bundled lifecycle pricing
Electrification preferences
- Market trend: heat pump sales +20% (2023)
- Customer leverage: preference for low-carbon options
- Mitigation: hybrid and high-efficiency models
- Retention: education plus compliance docs
Concentrated channels boost buyer leverage; review-driven installers face margin pressure
Concentrated channels (Home Depot $157.4B FY2024) and large contractors give buyers strong price/slotting leverage; losing a key account can cut utilization and margins. Installers face moderate switching costs but increased transparency (75% consult reviews) raises negotiation power; warranties, rebates and training boost stickiness. Commercial RFPs demand 99.9% SLAs and volume discounts; heat-pump sales +20% (2023) raise low-carbon preference.
| Metric | Value |
|---|---|
| Home Depot revenue (FY2024) | $157.4B |
| Buyer review usage | 75% |
| Heat pump sales change (2023) | +20% |
| Common payback (tankless) | 3–5 yrs |
| Commercial SLA expectation | 99.9% |
Full Version Awaits
Rinnai Porter's Five Forces Analysis
This preview shows the exact Rinnai Porter’s Five Forces Analysis you’ll receive immediately after purchase—no placeholders or mockups. The document displayed is the full, professionally formatted file, ready for download and use the moment you buy. You’re previewing the final deliverable, the same analysis that will be available to you instantly after payment.











