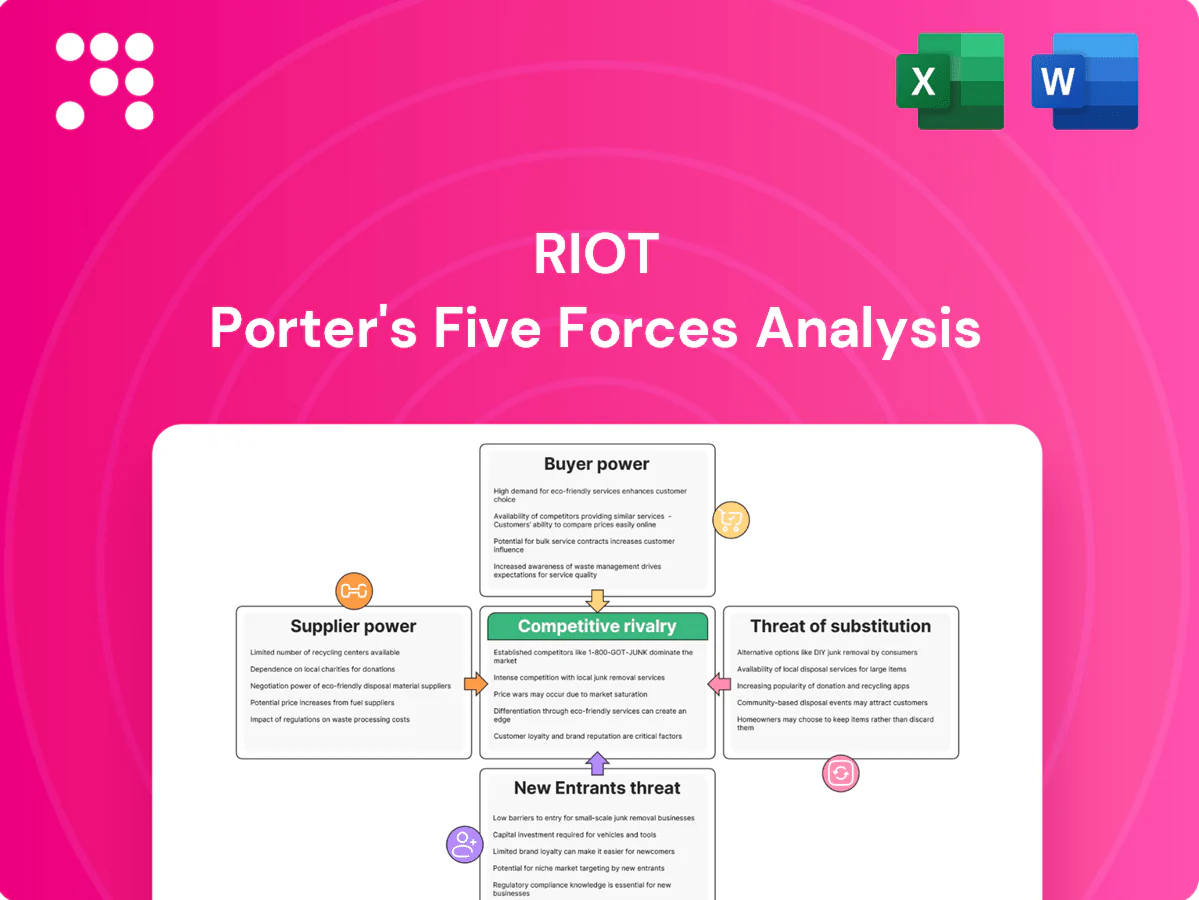
Riot Porter's Five Forces Analysis

Don't Miss the Bigger Picture
Riot’s Porter's Five Forces snapshot highlights key competitive dynamics, supplier and buyer pressures, and emerging substitute threats shaping its industry. This brief overview surfaces strategic advantages and vulnerabilities but only scratches the surface. Unlock the full Porter's Five Forces Analysis to get force-by-force ratings, visuals, and actionable insights for investment or strategy.
Suppliers Bargaining Power

ASIC miner concentration
ASIC supply is highly concentrated—Bitmain and MicroBT account for roughly 75–85% of commercial miner shipments as of 2024, giving them pricing and lead-time leverage. During upcycles lead times commonly stretch 6–12 months and suppliers often require deposits or prepayments. Diversifying OEMs and securing long-term purchase agreements cuts exposure, while custom firmware and in-house tuning reduce reliance on any single manufacturer.
Power and grid access
Electricity providers, ISOs and utilities control access, pricing and curtailment rules that largely determine Riot’s cost base, with Texas grid congestion driving locational price differentials and timing risk. Long-term PPAs and demand-response contracts — PPA prices averaged about $20–30/MWh in 2024 (LevelTen Index) — can damp volatility but create fixed obligations. Onsite generation or co-location with renewables materially improves bargaining leverage and reduces switching costs.

Facility infrastructure
Data-center EPCs, immersion-cooling vendors and switchgear suppliers materially affect deployment speed: transformers often face 20–52 week lead times, substations 6–12 months and chillers/cooling units 16–24 weeks (2024-era supply cycles). Vertical integration of engineering can internalize roughly 5–15% of supplier margins and tighten schedules, while standardized modular builds have cut vendor lock-in and deployment time by up to ~30%.

Firmware and parts
Spare parts, control boards and firmware updates are largely sourced from OEMs and niche third parties, with proprietary chips and software creating dependency and warranty constraints that raise switching costs. In 2024 the global semiconductor market was ≈630 billion USD, reinforcing supplier leverage for proprietary components. Building in-house monitoring and repair capability and tapping secondary markets during shortages reduce supplier power and downtime.
- OEM reliance
- Proprietary chip dependency
- In-house repair offsets
- Secondary market alternative
Logistics and hosting
Freight capacity constraints, customs delays and hosting partners directly affect delivery, import costs and uptime; 2024 container spot rates remained roughly 30–40% below 2022 peaks, easing some capacity pressure but customs unpredictability still adds days to lead times.
Tariffs and export controls in 2024 raised landed costs for affected SKUs by up to low-double-digit percentages and extended timing; building self-operated sites reduces third-party host dependence while multi-route logistics planning cuts single-route bottleneck risk.
High supplier power from ASIC concentration and utility PPAs; diversify, modularize, onsite
ASIC OEMs (Bitmain, MicroBT ~75–85% share in 2024) and utilities (PPA $20–30/MWh in 2024) drive high supplier power via pricing, 6–12+ month lead times and curtailment. Critical electrical gear (transformers 20–52 wks; substations 6–12 mos) and proprietary spares raise switching costs. Tariffs lifted landed costs by up to low-double-digit % in 2024. In-house builds, PPAs, secondary markets and modular designs reduce exposure.
| Supplier | Key metric | 2024 value | Mitigant |
|---|---|---|---|
| ASIC OEMs | Market share | 75–85% | Diversify OEMs |
| Utilities | PPA | $20–30/MWh | Onsite generation |
| Transformers | Lead time | 20–52 wks | Standardized builds |
| Logistics | Container rates | −30–40% vs 2022 | Multi-route |
What is included in the product
 Detailed Word Document
Uncovers key competitive drivers, buyer and supplier power, entry barriers and substitutes specific to Riot Porter, identifying disruptive threats and strategic advantages; deliverable is fully editable for investor decks, plans, or internal strategy.

 Customizable Excel Spreadsheet
Riot Porter’s Five Forces delivers a single-sheet, visual summary that cuts analysis time and clarifies competitive pressures—relieving decision-making friction and enabling faster, confident strategic moves.
Customers Bargaining Power

Bitcoin market as buyer
Riot sells mined Bitcoin into a deep, price-taking spot market with no negotiating counterparties, so realized revenue equals prevailing market price and buyer power manifests primarily as spot volatility. In 2024 Bitcoin maintained deep liquidity—average daily spot volumes exceeded $10 billion—and annualized volatility remained elevated (~70%), driving revenue variability. Choosing HODL versus immediate sale changes Treasury exposure to that volatility but does not grant Riot unit pricing power. Hedging can smooth cash flows and reduce realized volatility but cannot increase the market-determined price per BTC.
Energy clients for solutions
Engineering solutions for energy clients face informed, cost-focused buyers: 2024 industry surveys show about 68% of energy procurement teams rank price as top decision factor. RFPs and competitive bidding routinely compress margins by roughly 5–15% on awarded projects. Differentiation through reliability, speed, and power-market expertise reduces required concessions, while reference sites and SLAs raise switching costs significantly.

Hosting and demand-response partners
When providing load-flex services, utilities and grid operators set program terms that dictate eligibility, performance windows and penalties, giving buyers strong leverage over suppliers. Revenues hinge on market rules and settlement prices across ISOs; major markets (PJM, CAISO, ERCOT) account for over 60% of U.S. load and shape netbacks. Contracting across multiple markets diversifies buyer leverage and revenue volatility. Demonstrated performance data enables suppliers to secure premium participation tiers and higher clearing prices.

Institutional investors
Institutional investors shape Riot's cost of capital and strategic flexibility by controlling funding availability and setting conditions tied to dilution sensitivity and ESG screens, which can force changes in operating practices and governance. Transparent reporting and demonstrable low-cost scaling strengthen Riot's negotiating position with capital providers and lower perceived risk, improving borrowing terms. Efficient capital allocation reduces reliance on expensive equity or high-interest debt, preserving strategic optionality.
- Capital influence: funding terms drive strategy
- Dilution & ESG: pressure on operations
- Transparency: better bargaining outcomes
- Efficient allocation: less costly financing
OEM back-to-back deals
Where OEM back-to-back pass-through contracts exist, end customers in 2024 intensified pressure to lower total delivered cost, exposing margin stacking across tiers and prompting direct challenges to suppliers downstream. Bundling complementary services preserves value capture while outcome-based pricing (service-level or uptime guarantees) realigns incentives and reduces pure price pressure.
- Pass-through scrutiny 2024
- Margin stacking visible
- Bundling preserves value
- Outcome-based aligns incentives
Buyers drive BTC seller revenue swings — >$10B daily, ~70% vol, RFPs cut margins
Buyers exert strong price pressure on Riot: BTC sales are price-taking (2024 avg daily spot volume >$10B; annualized volatility ~70%), so customers drive revenue variability not unit price. Energy clients prioritize cost (2024 survey: 68%); RFPs compress margins ~5–15%. Utilities/grid rules and institutional capital conditions further constrain terms and strategic flexibility.
| Metric | 2024 |
|---|---|
| BTC daily spot volume | >$10B |
| BTC vol (annualized) | ~70% |
| Procurement price priority | 68% |
| RFP margin compression | 5–15% |
Preview Before You Purchase
Riot Porter's Five Forces Analysis
This preview shows the Riot Porter's Five Forces Analysis exactly as delivered—no placeholders or mockups. The document you see is the professionally formatted, final file you’ll receive immediately after purchase. It’s ready for download and use with full, actionable insights into Riot Porter’s competitive dynamics.

Don't Miss the Bigger Picture
Riot’s Porter's Five Forces snapshot highlights key competitive dynamics, supplier and buyer pressures, and emerging substitute threats shaping its industry. This brief overview surfaces strategic advantages and vulnerabilities but only scratches the surface. Unlock the full Porter's Five Forces Analysis to get force-by-force ratings, visuals, and actionable insights for investment or strategy.
Suppliers Bargaining Power
ASIC miner concentration
ASIC supply is highly concentrated—Bitmain and MicroBT account for roughly 75–85% of commercial miner shipments as of 2024, giving them pricing and lead-time leverage. During upcycles lead times commonly stretch 6–12 months and suppliers often require deposits or prepayments. Diversifying OEMs and securing long-term purchase agreements cuts exposure, while custom firmware and in-house tuning reduce reliance on any single manufacturer.
Power and grid access
Electricity providers, ISOs and utilities control access, pricing and curtailment rules that largely determine Riot’s cost base, with Texas grid congestion driving locational price differentials and timing risk. Long-term PPAs and demand-response contracts — PPA prices averaged about $20–30/MWh in 2024 (LevelTen Index) — can damp volatility but create fixed obligations. Onsite generation or co-location with renewables materially improves bargaining leverage and reduces switching costs.
Facility infrastructure
Data-center EPCs, immersion-cooling vendors and switchgear suppliers materially affect deployment speed: transformers often face 20–52 week lead times, substations 6–12 months and chillers/cooling units 16–24 weeks (2024-era supply cycles). Vertical integration of engineering can internalize roughly 5–15% of supplier margins and tighten schedules, while standardized modular builds have cut vendor lock-in and deployment time by up to ~30%.
Firmware and parts
Spare parts, control boards and firmware updates are largely sourced from OEMs and niche third parties, with proprietary chips and software creating dependency and warranty constraints that raise switching costs. In 2024 the global semiconductor market was ≈630 billion USD, reinforcing supplier leverage for proprietary components. Building in-house monitoring and repair capability and tapping secondary markets during shortages reduce supplier power and downtime.
- OEM reliance
- Proprietary chip dependency
- In-house repair offsets
- Secondary market alternative
Logistics and hosting
Freight capacity constraints, customs delays and hosting partners directly affect delivery, import costs and uptime; 2024 container spot rates remained roughly 30–40% below 2022 peaks, easing some capacity pressure but customs unpredictability still adds days to lead times.
Tariffs and export controls in 2024 raised landed costs for affected SKUs by up to low-double-digit percentages and extended timing; building self-operated sites reduces third-party host dependence while multi-route logistics planning cuts single-route bottleneck risk.
High supplier power from ASIC concentration and utility PPAs; diversify, modularize, onsite
ASIC OEMs (Bitmain, MicroBT ~75–85% share in 2024) and utilities (PPA $20–30/MWh in 2024) drive high supplier power via pricing, 6–12+ month lead times and curtailment. Critical electrical gear (transformers 20–52 wks; substations 6–12 mos) and proprietary spares raise switching costs. Tariffs lifted landed costs by up to low-double-digit % in 2024. In-house builds, PPAs, secondary markets and modular designs reduce exposure.
| Supplier | Key metric | 2024 value | Mitigant |
|---|---|---|---|
| ASIC OEMs | Market share | 75–85% | Diversify OEMs |
| Utilities | PPA | $20–30/MWh | Onsite generation |
| Transformers | Lead time | 20–52 wks | Standardized builds |
| Logistics | Container rates | −30–40% vs 2022 | Multi-route |
What is included in the product
Detailed Word Document
Uncovers key competitive drivers, buyer and supplier power, entry barriers and substitutes specific to Riot Porter, identifying disruptive threats and strategic advantages; deliverable is fully editable for investor decks, plans, or internal strategy.
Customizable Excel Spreadsheet
Riot Porter’s Five Forces delivers a single-sheet, visual summary that cuts analysis time and clarifies competitive pressures—relieving decision-making friction and enabling faster, confident strategic moves.
Customers Bargaining Power
Bitcoin market as buyer
Riot sells mined Bitcoin into a deep, price-taking spot market with no negotiating counterparties, so realized revenue equals prevailing market price and buyer power manifests primarily as spot volatility. In 2024 Bitcoin maintained deep liquidity—average daily spot volumes exceeded $10 billion—and annualized volatility remained elevated (~70%), driving revenue variability. Choosing HODL versus immediate sale changes Treasury exposure to that volatility but does not grant Riot unit pricing power. Hedging can smooth cash flows and reduce realized volatility but cannot increase the market-determined price per BTC.
Energy clients for solutions
Engineering solutions for energy clients face informed, cost-focused buyers: 2024 industry surveys show about 68% of energy procurement teams rank price as top decision factor. RFPs and competitive bidding routinely compress margins by roughly 5–15% on awarded projects. Differentiation through reliability, speed, and power-market expertise reduces required concessions, while reference sites and SLAs raise switching costs significantly.
Hosting and demand-response partners
When providing load-flex services, utilities and grid operators set program terms that dictate eligibility, performance windows and penalties, giving buyers strong leverage over suppliers. Revenues hinge on market rules and settlement prices across ISOs; major markets (PJM, CAISO, ERCOT) account for over 60% of U.S. load and shape netbacks. Contracting across multiple markets diversifies buyer leverage and revenue volatility. Demonstrated performance data enables suppliers to secure premium participation tiers and higher clearing prices.
Institutional investors
Institutional investors shape Riot's cost of capital and strategic flexibility by controlling funding availability and setting conditions tied to dilution sensitivity and ESG screens, which can force changes in operating practices and governance. Transparent reporting and demonstrable low-cost scaling strengthen Riot's negotiating position with capital providers and lower perceived risk, improving borrowing terms. Efficient capital allocation reduces reliance on expensive equity or high-interest debt, preserving strategic optionality.
- Capital influence: funding terms drive strategy
- Dilution & ESG: pressure on operations
- Transparency: better bargaining outcomes
- Efficient allocation: less costly financing
OEM back-to-back deals
Where OEM back-to-back pass-through contracts exist, end customers in 2024 intensified pressure to lower total delivered cost, exposing margin stacking across tiers and prompting direct challenges to suppliers downstream. Bundling complementary services preserves value capture while outcome-based pricing (service-level or uptime guarantees) realigns incentives and reduces pure price pressure.
- Pass-through scrutiny 2024
- Margin stacking visible
- Bundling preserves value
- Outcome-based aligns incentives
Buyers drive BTC seller revenue swings — >$10B daily, ~70% vol, RFPs cut margins
Buyers exert strong price pressure on Riot: BTC sales are price-taking (2024 avg daily spot volume >$10B; annualized volatility ~70%), so customers drive revenue variability not unit price. Energy clients prioritize cost (2024 survey: 68%); RFPs compress margins ~5–15%. Utilities/grid rules and institutional capital conditions further constrain terms and strategic flexibility.
| Metric | 2024 |
|---|---|
| BTC daily spot volume | >$10B |
| BTC vol (annualized) | ~70% |
| Procurement price priority | 68% |
| RFP margin compression | 5–15% |
Preview Before You Purchase
Riot Porter's Five Forces Analysis
This preview shows the Riot Porter's Five Forces Analysis exactly as delivered—no placeholders or mockups. The document you see is the professionally formatted, final file you’ll receive immediately after purchase. It’s ready for download and use with full, actionable insights into Riot Porter’s competitive dynamics.
Original: $10.00
-65%$10.00
$3.50Description
Don't Miss the Bigger Picture
Riot’s Porter's Five Forces snapshot highlights key competitive dynamics, supplier and buyer pressures, and emerging substitute threats shaping its industry. This brief overview surfaces strategic advantages and vulnerabilities but only scratches the surface. Unlock the full Porter's Five Forces Analysis to get force-by-force ratings, visuals, and actionable insights for investment or strategy.
Suppliers Bargaining Power
ASIC miner concentration
ASIC supply is highly concentrated—Bitmain and MicroBT account for roughly 75–85% of commercial miner shipments as of 2024, giving them pricing and lead-time leverage. During upcycles lead times commonly stretch 6–12 months and suppliers often require deposits or prepayments. Diversifying OEMs and securing long-term purchase agreements cuts exposure, while custom firmware and in-house tuning reduce reliance on any single manufacturer.
Power and grid access
Electricity providers, ISOs and utilities control access, pricing and curtailment rules that largely determine Riot’s cost base, with Texas grid congestion driving locational price differentials and timing risk. Long-term PPAs and demand-response contracts — PPA prices averaged about $20–30/MWh in 2024 (LevelTen Index) — can damp volatility but create fixed obligations. Onsite generation or co-location with renewables materially improves bargaining leverage and reduces switching costs.
Facility infrastructure
Data-center EPCs, immersion-cooling vendors and switchgear suppliers materially affect deployment speed: transformers often face 20–52 week lead times, substations 6–12 months and chillers/cooling units 16–24 weeks (2024-era supply cycles). Vertical integration of engineering can internalize roughly 5–15% of supplier margins and tighten schedules, while standardized modular builds have cut vendor lock-in and deployment time by up to ~30%.
Firmware and parts
Spare parts, control boards and firmware updates are largely sourced from OEMs and niche third parties, with proprietary chips and software creating dependency and warranty constraints that raise switching costs. In 2024 the global semiconductor market was ≈630 billion USD, reinforcing supplier leverage for proprietary components. Building in-house monitoring and repair capability and tapping secondary markets during shortages reduce supplier power and downtime.
- OEM reliance
- Proprietary chip dependency
- In-house repair offsets
- Secondary market alternative
Logistics and hosting
Freight capacity constraints, customs delays and hosting partners directly affect delivery, import costs and uptime; 2024 container spot rates remained roughly 30–40% below 2022 peaks, easing some capacity pressure but customs unpredictability still adds days to lead times.
Tariffs and export controls in 2024 raised landed costs for affected SKUs by up to low-double-digit percentages and extended timing; building self-operated sites reduces third-party host dependence while multi-route logistics planning cuts single-route bottleneck risk.
High supplier power from ASIC concentration and utility PPAs; diversify, modularize, onsite
ASIC OEMs (Bitmain, MicroBT ~75–85% share in 2024) and utilities (PPA $20–30/MWh in 2024) drive high supplier power via pricing, 6–12+ month lead times and curtailment. Critical electrical gear (transformers 20–52 wks; substations 6–12 mos) and proprietary spares raise switching costs. Tariffs lifted landed costs by up to low-double-digit % in 2024. In-house builds, PPAs, secondary markets and modular designs reduce exposure.
| Supplier | Key metric | 2024 value | Mitigant |
|---|---|---|---|
| ASIC OEMs | Market share | 75–85% | Diversify OEMs |
| Utilities | PPA | $20–30/MWh | Onsite generation |
| Transformers | Lead time | 20–52 wks | Standardized builds |
| Logistics | Container rates | −30–40% vs 2022 | Multi-route |
What is included in the product
Detailed Word Document
Uncovers key competitive drivers, buyer and supplier power, entry barriers and substitutes specific to Riot Porter, identifying disruptive threats and strategic advantages; deliverable is fully editable for investor decks, plans, or internal strategy.
Customizable Excel Spreadsheet
Riot Porter’s Five Forces delivers a single-sheet, visual summary that cuts analysis time and clarifies competitive pressures—relieving decision-making friction and enabling faster, confident strategic moves.
Customers Bargaining Power
Bitcoin market as buyer
Riot sells mined Bitcoin into a deep, price-taking spot market with no negotiating counterparties, so realized revenue equals prevailing market price and buyer power manifests primarily as spot volatility. In 2024 Bitcoin maintained deep liquidity—average daily spot volumes exceeded $10 billion—and annualized volatility remained elevated (~70%), driving revenue variability. Choosing HODL versus immediate sale changes Treasury exposure to that volatility but does not grant Riot unit pricing power. Hedging can smooth cash flows and reduce realized volatility but cannot increase the market-determined price per BTC.
Energy clients for solutions
Engineering solutions for energy clients face informed, cost-focused buyers: 2024 industry surveys show about 68% of energy procurement teams rank price as top decision factor. RFPs and competitive bidding routinely compress margins by roughly 5–15% on awarded projects. Differentiation through reliability, speed, and power-market expertise reduces required concessions, while reference sites and SLAs raise switching costs significantly.
Hosting and demand-response partners
When providing load-flex services, utilities and grid operators set program terms that dictate eligibility, performance windows and penalties, giving buyers strong leverage over suppliers. Revenues hinge on market rules and settlement prices across ISOs; major markets (PJM, CAISO, ERCOT) account for over 60% of U.S. load and shape netbacks. Contracting across multiple markets diversifies buyer leverage and revenue volatility. Demonstrated performance data enables suppliers to secure premium participation tiers and higher clearing prices.
Institutional investors
Institutional investors shape Riot's cost of capital and strategic flexibility by controlling funding availability and setting conditions tied to dilution sensitivity and ESG screens, which can force changes in operating practices and governance. Transparent reporting and demonstrable low-cost scaling strengthen Riot's negotiating position with capital providers and lower perceived risk, improving borrowing terms. Efficient capital allocation reduces reliance on expensive equity or high-interest debt, preserving strategic optionality.
- Capital influence: funding terms drive strategy
- Dilution & ESG: pressure on operations
- Transparency: better bargaining outcomes
- Efficient allocation: less costly financing
OEM back-to-back deals
Where OEM back-to-back pass-through contracts exist, end customers in 2024 intensified pressure to lower total delivered cost, exposing margin stacking across tiers and prompting direct challenges to suppliers downstream. Bundling complementary services preserves value capture while outcome-based pricing (service-level or uptime guarantees) realigns incentives and reduces pure price pressure.
- Pass-through scrutiny 2024
- Margin stacking visible
- Bundling preserves value
- Outcome-based aligns incentives
Buyers drive BTC seller revenue swings — >$10B daily, ~70% vol, RFPs cut margins
Buyers exert strong price pressure on Riot: BTC sales are price-taking (2024 avg daily spot volume >$10B; annualized volatility ~70%), so customers drive revenue variability not unit price. Energy clients prioritize cost (2024 survey: 68%); RFPs compress margins ~5–15%. Utilities/grid rules and institutional capital conditions further constrain terms and strategic flexibility.
| Metric | 2024 |
|---|---|
| BTC daily spot volume | >$10B |
| BTC vol (annualized) | ~70% |
| Procurement price priority | 68% |
| RFP margin compression | 5–15% |
Preview Before You Purchase
Riot Porter's Five Forces Analysis
This preview shows the Riot Porter's Five Forces Analysis exactly as delivered—no placeholders or mockups. The document you see is the professionally formatted, final file you’ll receive immediately after purchase. It’s ready for download and use with full, actionable insights into Riot Porter’s competitive dynamics.











