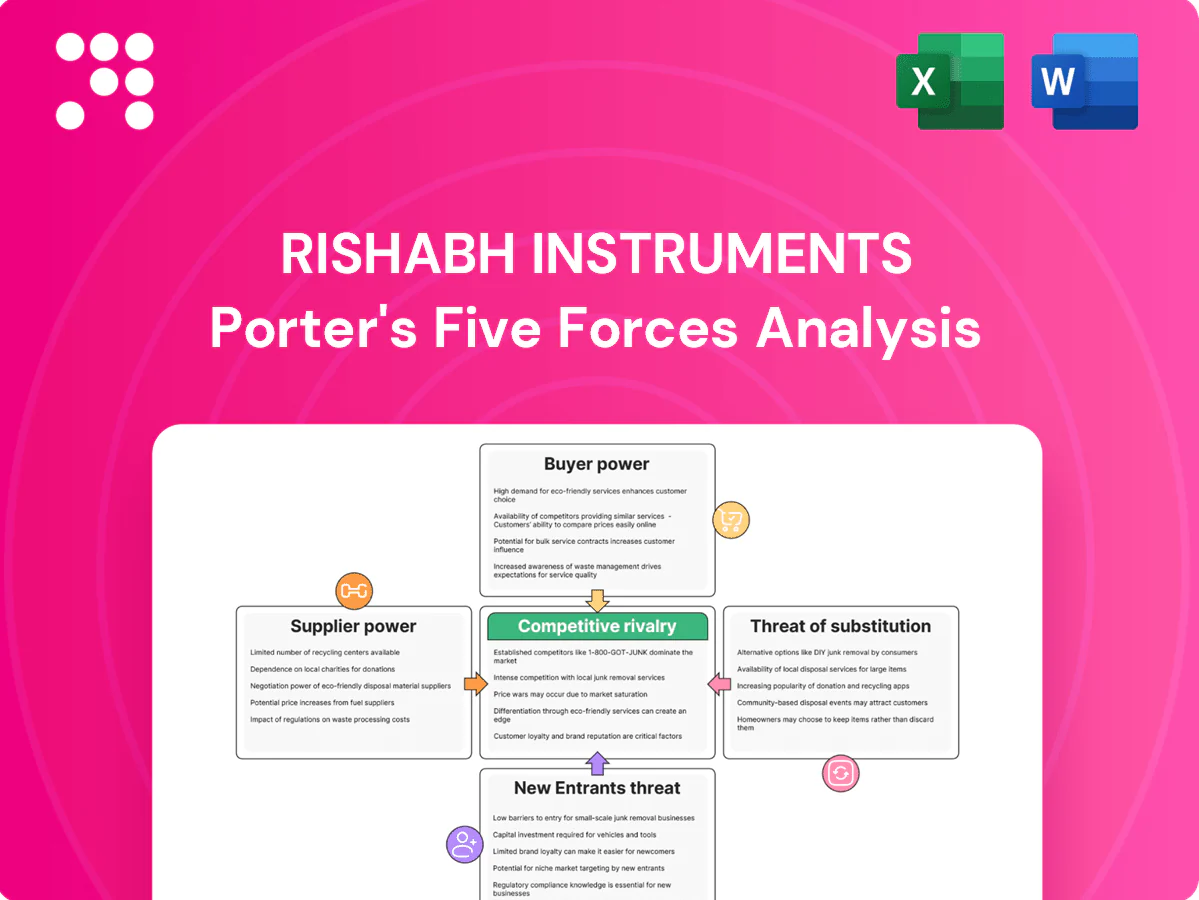
Rishabh Instruments Porter's Five Forces Analysis

Elevate Your Analysis with the Complete Porter's Five Forces Analysis
Rishabh Instruments faces moderate supplier power but intense rivalry from established test-and-measurement players, with steady buyer demand and moderate threat from substitutes as technology evolves. Barriers to entry are significant due to certification and brand trust, while new digital entrants increase disruption risk. This brief snapshot only scratches the surface. Unlock the full Porter's Five Forces Analysis to explore Rishabh Instruments’s competitive dynamics, market pressures, and strategic advantages in detail.
Suppliers Bargaining Power

Critical components concentration
Rishabh relies on metrology-grade ICs, precision sensors and PCBs where a few global vendors dominate; the top 10 semiconductor and sensor firms accounted for roughly 60% of industry revenue in 2023, and concentration remained high into 2024. Such supplier dominance can push lead times beyond 20 weeks in upcycles and drive pricing pressure. Long qualification cycles of 6–12 months for accuracy-critical parts elevate switching costs. Dual-sourcing and approved-vendor lists partially mitigate this supplier power.
Commodity input volatility
Copper, aluminum, rare-earth magnets and resins expose Rishabh Instruments to commodity swings — LME copper averaged about $9,500/tonne and aluminum ~$2,300/tonne in 2024, while rare-earth prices and polymer resins saw double-digit volatility. Suppliers can rapidly pass through hikes, squeezing margins on fixed-price contracts. Hedging and multi-year supply agreements mitigate risk but leave basis risk intact. In-house die-casting yields ~5-8% process cost savings, reducing external exposure.

Quality and certification lock-ins
Metrology and safety standards such as IEC, BIS and MID mandate component-level certification, and switching suppliers commonly triggers requalification that adds weeks to months of lead time and test costs that frequently run into thousands of dollars per part, strengthening supplier leverage for certified inputs; vendor development programs, proven to expand qualified supplier pools over 1–3 years, can gradually reduce this lock-in.

Capacity and lead-time cycles
Semiconductor cycles and PCB capacity in 2024 drove allocation risks that favor suppliers, with typical PCB lead-times of 4–12 weeks and semiconductor lead-times often 8–26 weeks, forcing higher inventories or expedite fees; suppliers with shorter cycle times secured better commercial terms; forecast-sharing and VMI cut friction but did not remove cyclicality.
- PCB lead-times: 4–12 weeks (2024)
- Semiconductor lead-times: 8–26 weeks (2024)
- Higher inventories or expedite fees required
- VMI/forecast-sharing reduce but do not eliminate cycles
Partial vertical integration
Rishabh’s in-house aluminum high-pressure die-casting in 2024 covers roughly 45% of enclosure and thermal-part volume, cutting external casting spend by about 30% and reducing lead-time variability near 20%, which weakens external casters and machining vendors; however, electronic and sensor content still anchors supplier influence and vertical depth does not extend across all BOM lines.
- Die-casting share: ~45%
- External casting spend reduction: ~30%
- Lead-time variability improvement: ~20%
- Residual supplier power: electronics/sensors
Supply squeeze: top-10 ~60%, semis 8-26w
Supplier power is high: top-10 semiconductor/sensor firms held ~60% of revenue (2023), PCB lead-times 4–12w and semiconductors 8–26w (2024), raising inventory and expedite costs; commodity swings (LME copper ~$9,500/t, aluminum ~$2,300/t in 2024) squeeze margins. Die-casting in‑house (45% volume) cuts external spend ~30% but electronics/sensors keep supplier leverage.
| Metric | 2024/2023 |
|---|---|
| Top-10 share | ~60% (2023) |
| PCB lead-time | 4–12 weeks (2024) |
| Semiconductor lead-time | 8–26 weeks (2024) |
| LME copper | ~$9,500/t (2024) |
| Die-casting share | ~45% (2024) |
What is included in the product
 Detailed Word Document
Tailored Porter's Five Forces analysis for Rishabh Instruments that uncovers key competitive drivers, buyer and supplier power, substitutes and disruptive threats, and barriers to entry—delivered in fully editable Word format for inclusion in investor decks, strategy reports, or academic projects.

 Customizable Excel Spreadsheet
Condenses Rishabh Instruments' competitive pressures into a single, easy-to-read one-sheet so executives quickly spot threats and opportunities. Swap in your data, toggle scenarios, and export clean visuals for decks—no macros or finance jargon required.
Customers Bargaining Power

Large institutional buyers
Large institutional buyers such as utilities, OEMs, EPCs and heavy industrials run competitive tenders, and in 2024 their scale and project timing gave them strong pricing and payment-term leverage. Framework agreements frequently require product customization and service SLAs. Volume and multi-year commitments commonly secure discounts of 5-20%.
Product standardization
Many meters, CTs and PQ instruments conform to IEC standards such as IEC 62053, IEC 61869 and IEC 61000, easing technical comparison and letting buyers benchmark specifications and price. This standardization intensifies negotiation, though differentiation through analytics, secure firmware and system integration reduces direct price pressure. Commoditized meter segments, however, remain largely price-led.

Switching and integration costs
Swapping devices often requires panel redesign, protocol mapping and dashboard rework, raising friction and costs. When EMS/cloud management and open APIs are embedded, switching costs rise and buyer power falls; Gartner 2024 reported about 70% of industrial firms use cloud-enabled device management. For standalone instruments switching is easier, boosting buyer leverage. Service history and calibration records add inertia by preserving asset continuity.

Channel and distributor balance
Distributors aggregate demand and press Rishabh Instruments for rebates and extended credit, using availability and margin to shift share to rivals; 2024 industry reports continue to highlight this channel leverage.
Strong channel programs and exclusive SKUs reduce distributor bargaining power by protecting margins and shelf space.
Direct key-account coverage mitigates distributor concentration by securing strategic customers and margins.
- Distributors push rebates/credit
- Can shift share on availability/margin
- Exclusive SKUs curb leverage
- Direct key-account coverage offsets concentration
Total cost of ownership focus
- uptime:72%
- calibration:65%
- fewer concessions with ROI:40%
- warranty/remote lift:25%
2024 tenders: buyers secure 5-20% discounts; uptime (72%) & cloud (~70%) drive deals
Large institutional tenders in 2024 grant buyers strong leverage, securing 5-20% volume discounts and tougher payment terms. IEC standardization enables easy benchmarking, boosting price pressure, while cloud-enabled device management (≈70% adoption) raises switching costs. Buyers prioritize uptime (72%) and calibration (65%); demonstrated ROI cuts price concessions ~40% and warranties/remote diagnostics lift acceptance ~25%.
| Metric | 2024 Value | Impact |
|---|---|---|
| Volume discount | 5-20% | Higher buyer leverage |
| Cloud device mgmt | ≈70% | Raises switching cost |
| Uptime priority | 72% | Drives spec-based buys |
| Calibration priority | 65% | Reduces price focus |
| ROI effect | −40% concessions | Strengthens vendor position |
| Warranty/remote | +25% acceptance | Offsets discounting |
Full Version Awaits
Rishabh Instruments Porter's Five Forces Analysis
This preview shows the exact Porter's Five Forces analysis for Rishabh Instruments you'll receive—no placeholders or mockups. The document is fully formatted, comprehensive, and ready to download the moment you purchase. What you see here is the final deliverable.

Elevate Your Analysis with the Complete Porter's Five Forces Analysis
Rishabh Instruments faces moderate supplier power but intense rivalry from established test-and-measurement players, with steady buyer demand and moderate threat from substitutes as technology evolves. Barriers to entry are significant due to certification and brand trust, while new digital entrants increase disruption risk. This brief snapshot only scratches the surface. Unlock the full Porter's Five Forces Analysis to explore Rishabh Instruments’s competitive dynamics, market pressures, and strategic advantages in detail.
Suppliers Bargaining Power
Critical components concentration
Rishabh relies on metrology-grade ICs, precision sensors and PCBs where a few global vendors dominate; the top 10 semiconductor and sensor firms accounted for roughly 60% of industry revenue in 2023, and concentration remained high into 2024. Such supplier dominance can push lead times beyond 20 weeks in upcycles and drive pricing pressure. Long qualification cycles of 6–12 months for accuracy-critical parts elevate switching costs. Dual-sourcing and approved-vendor lists partially mitigate this supplier power.
Commodity input volatility
Copper, aluminum, rare-earth magnets and resins expose Rishabh Instruments to commodity swings — LME copper averaged about $9,500/tonne and aluminum ~$2,300/tonne in 2024, while rare-earth prices and polymer resins saw double-digit volatility. Suppliers can rapidly pass through hikes, squeezing margins on fixed-price contracts. Hedging and multi-year supply agreements mitigate risk but leave basis risk intact. In-house die-casting yields ~5-8% process cost savings, reducing external exposure.
Quality and certification lock-ins
Metrology and safety standards such as IEC, BIS and MID mandate component-level certification, and switching suppliers commonly triggers requalification that adds weeks to months of lead time and test costs that frequently run into thousands of dollars per part, strengthening supplier leverage for certified inputs; vendor development programs, proven to expand qualified supplier pools over 1–3 years, can gradually reduce this lock-in.
Capacity and lead-time cycles
Semiconductor cycles and PCB capacity in 2024 drove allocation risks that favor suppliers, with typical PCB lead-times of 4–12 weeks and semiconductor lead-times often 8–26 weeks, forcing higher inventories or expedite fees; suppliers with shorter cycle times secured better commercial terms; forecast-sharing and VMI cut friction but did not remove cyclicality.
- PCB lead-times: 4–12 weeks (2024)
- Semiconductor lead-times: 8–26 weeks (2024)
- Higher inventories or expedite fees required
- VMI/forecast-sharing reduce but do not eliminate cycles
Partial vertical integration
Rishabh’s in-house aluminum high-pressure die-casting in 2024 covers roughly 45% of enclosure and thermal-part volume, cutting external casting spend by about 30% and reducing lead-time variability near 20%, which weakens external casters and machining vendors; however, electronic and sensor content still anchors supplier influence and vertical depth does not extend across all BOM lines.
- Die-casting share: ~45%
- External casting spend reduction: ~30%
- Lead-time variability improvement: ~20%
- Residual supplier power: electronics/sensors
Supply squeeze: top-10 ~60%, semis 8-26w
Supplier power is high: top-10 semiconductor/sensor firms held ~60% of revenue (2023), PCB lead-times 4–12w and semiconductors 8–26w (2024), raising inventory and expedite costs; commodity swings (LME copper ~$9,500/t, aluminum ~$2,300/t in 2024) squeeze margins. Die-casting in‑house (45% volume) cuts external spend ~30% but electronics/sensors keep supplier leverage.
| Metric | 2024/2023 |
|---|---|
| Top-10 share | ~60% (2023) |
| PCB lead-time | 4–12 weeks (2024) |
| Semiconductor lead-time | 8–26 weeks (2024) |
| LME copper | ~$9,500/t (2024) |
| Die-casting share | ~45% (2024) |
What is included in the product
Detailed Word Document
Tailored Porter's Five Forces analysis for Rishabh Instruments that uncovers key competitive drivers, buyer and supplier power, substitutes and disruptive threats, and barriers to entry—delivered in fully editable Word format for inclusion in investor decks, strategy reports, or academic projects.
Customizable Excel Spreadsheet
Condenses Rishabh Instruments' competitive pressures into a single, easy-to-read one-sheet so executives quickly spot threats and opportunities. Swap in your data, toggle scenarios, and export clean visuals for decks—no macros or finance jargon required.
Customers Bargaining Power
Large institutional buyers
Large institutional buyers such as utilities, OEMs, EPCs and heavy industrials run competitive tenders, and in 2024 their scale and project timing gave them strong pricing and payment-term leverage. Framework agreements frequently require product customization and service SLAs. Volume and multi-year commitments commonly secure discounts of 5-20%.
Product standardization
Many meters, CTs and PQ instruments conform to IEC standards such as IEC 62053, IEC 61869 and IEC 61000, easing technical comparison and letting buyers benchmark specifications and price. This standardization intensifies negotiation, though differentiation through analytics, secure firmware and system integration reduces direct price pressure. Commoditized meter segments, however, remain largely price-led.
Switching and integration costs
Swapping devices often requires panel redesign, protocol mapping and dashboard rework, raising friction and costs. When EMS/cloud management and open APIs are embedded, switching costs rise and buyer power falls; Gartner 2024 reported about 70% of industrial firms use cloud-enabled device management. For standalone instruments switching is easier, boosting buyer leverage. Service history and calibration records add inertia by preserving asset continuity.
Channel and distributor balance
Distributors aggregate demand and press Rishabh Instruments for rebates and extended credit, using availability and margin to shift share to rivals; 2024 industry reports continue to highlight this channel leverage.
Strong channel programs and exclusive SKUs reduce distributor bargaining power by protecting margins and shelf space.
Direct key-account coverage mitigates distributor concentration by securing strategic customers and margins.
- Distributors push rebates/credit
- Can shift share on availability/margin
- Exclusive SKUs curb leverage
- Direct key-account coverage offsets concentration
Total cost of ownership focus
- uptime:72%
- calibration:65%
- fewer concessions with ROI:40%
- warranty/remote lift:25%
2024 tenders: buyers secure 5-20% discounts; uptime (72%) & cloud (~70%) drive deals
Large institutional tenders in 2024 grant buyers strong leverage, securing 5-20% volume discounts and tougher payment terms. IEC standardization enables easy benchmarking, boosting price pressure, while cloud-enabled device management (≈70% adoption) raises switching costs. Buyers prioritize uptime (72%) and calibration (65%); demonstrated ROI cuts price concessions ~40% and warranties/remote diagnostics lift acceptance ~25%.
| Metric | 2024 Value | Impact |
|---|---|---|
| Volume discount | 5-20% | Higher buyer leverage |
| Cloud device mgmt | ≈70% | Raises switching cost |
| Uptime priority | 72% | Drives spec-based buys |
| Calibration priority | 65% | Reduces price focus |
| ROI effect | −40% concessions | Strengthens vendor position |
| Warranty/remote | +25% acceptance | Offsets discounting |
Full Version Awaits
Rishabh Instruments Porter's Five Forces Analysis
This preview shows the exact Porter's Five Forces analysis for Rishabh Instruments you'll receive—no placeholders or mockups. The document is fully formatted, comprehensive, and ready to download the moment you purchase. What you see here is the final deliverable.
Original: $10.00
-65%$10.00
$3.50Description
Elevate Your Analysis with the Complete Porter's Five Forces Analysis
Rishabh Instruments faces moderate supplier power but intense rivalry from established test-and-measurement players, with steady buyer demand and moderate threat from substitutes as technology evolves. Barriers to entry are significant due to certification and brand trust, while new digital entrants increase disruption risk. This brief snapshot only scratches the surface. Unlock the full Porter's Five Forces Analysis to explore Rishabh Instruments’s competitive dynamics, market pressures, and strategic advantages in detail.
Suppliers Bargaining Power
Critical components concentration
Rishabh relies on metrology-grade ICs, precision sensors and PCBs where a few global vendors dominate; the top 10 semiconductor and sensor firms accounted for roughly 60% of industry revenue in 2023, and concentration remained high into 2024. Such supplier dominance can push lead times beyond 20 weeks in upcycles and drive pricing pressure. Long qualification cycles of 6–12 months for accuracy-critical parts elevate switching costs. Dual-sourcing and approved-vendor lists partially mitigate this supplier power.
Commodity input volatility
Copper, aluminum, rare-earth magnets and resins expose Rishabh Instruments to commodity swings — LME copper averaged about $9,500/tonne and aluminum ~$2,300/tonne in 2024, while rare-earth prices and polymer resins saw double-digit volatility. Suppliers can rapidly pass through hikes, squeezing margins on fixed-price contracts. Hedging and multi-year supply agreements mitigate risk but leave basis risk intact. In-house die-casting yields ~5-8% process cost savings, reducing external exposure.
Quality and certification lock-ins
Metrology and safety standards such as IEC, BIS and MID mandate component-level certification, and switching suppliers commonly triggers requalification that adds weeks to months of lead time and test costs that frequently run into thousands of dollars per part, strengthening supplier leverage for certified inputs; vendor development programs, proven to expand qualified supplier pools over 1–3 years, can gradually reduce this lock-in.
Capacity and lead-time cycles
Semiconductor cycles and PCB capacity in 2024 drove allocation risks that favor suppliers, with typical PCB lead-times of 4–12 weeks and semiconductor lead-times often 8–26 weeks, forcing higher inventories or expedite fees; suppliers with shorter cycle times secured better commercial terms; forecast-sharing and VMI cut friction but did not remove cyclicality.
- PCB lead-times: 4–12 weeks (2024)
- Semiconductor lead-times: 8–26 weeks (2024)
- Higher inventories or expedite fees required
- VMI/forecast-sharing reduce but do not eliminate cycles
Partial vertical integration
Rishabh’s in-house aluminum high-pressure die-casting in 2024 covers roughly 45% of enclosure and thermal-part volume, cutting external casting spend by about 30% and reducing lead-time variability near 20%, which weakens external casters and machining vendors; however, electronic and sensor content still anchors supplier influence and vertical depth does not extend across all BOM lines.
- Die-casting share: ~45%
- External casting spend reduction: ~30%
- Lead-time variability improvement: ~20%
- Residual supplier power: electronics/sensors
Supply squeeze: top-10 ~60%, semis 8-26w
Supplier power is high: top-10 semiconductor/sensor firms held ~60% of revenue (2023), PCB lead-times 4–12w and semiconductors 8–26w (2024), raising inventory and expedite costs; commodity swings (LME copper ~$9,500/t, aluminum ~$2,300/t in 2024) squeeze margins. Die-casting in‑house (45% volume) cuts external spend ~30% but electronics/sensors keep supplier leverage.
| Metric | 2024/2023 |
|---|---|
| Top-10 share | ~60% (2023) |
| PCB lead-time | 4–12 weeks (2024) |
| Semiconductor lead-time | 8–26 weeks (2024) |
| LME copper | ~$9,500/t (2024) |
| Die-casting share | ~45% (2024) |
What is included in the product
Detailed Word Document
Tailored Porter's Five Forces analysis for Rishabh Instruments that uncovers key competitive drivers, buyer and supplier power, substitutes and disruptive threats, and barriers to entry—delivered in fully editable Word format for inclusion in investor decks, strategy reports, or academic projects.
Customizable Excel Spreadsheet
Condenses Rishabh Instruments' competitive pressures into a single, easy-to-read one-sheet so executives quickly spot threats and opportunities. Swap in your data, toggle scenarios, and export clean visuals for decks—no macros or finance jargon required.
Customers Bargaining Power
Large institutional buyers
Large institutional buyers such as utilities, OEMs, EPCs and heavy industrials run competitive tenders, and in 2024 their scale and project timing gave them strong pricing and payment-term leverage. Framework agreements frequently require product customization and service SLAs. Volume and multi-year commitments commonly secure discounts of 5-20%.
Product standardization
Many meters, CTs and PQ instruments conform to IEC standards such as IEC 62053, IEC 61869 and IEC 61000, easing technical comparison and letting buyers benchmark specifications and price. This standardization intensifies negotiation, though differentiation through analytics, secure firmware and system integration reduces direct price pressure. Commoditized meter segments, however, remain largely price-led.
Switching and integration costs
Swapping devices often requires panel redesign, protocol mapping and dashboard rework, raising friction and costs. When EMS/cloud management and open APIs are embedded, switching costs rise and buyer power falls; Gartner 2024 reported about 70% of industrial firms use cloud-enabled device management. For standalone instruments switching is easier, boosting buyer leverage. Service history and calibration records add inertia by preserving asset continuity.
Channel and distributor balance
Distributors aggregate demand and press Rishabh Instruments for rebates and extended credit, using availability and margin to shift share to rivals; 2024 industry reports continue to highlight this channel leverage.
Strong channel programs and exclusive SKUs reduce distributor bargaining power by protecting margins and shelf space.
Direct key-account coverage mitigates distributor concentration by securing strategic customers and margins.
- Distributors push rebates/credit
- Can shift share on availability/margin
- Exclusive SKUs curb leverage
- Direct key-account coverage offsets concentration
Total cost of ownership focus
- uptime:72%
- calibration:65%
- fewer concessions with ROI:40%
- warranty/remote lift:25%
2024 tenders: buyers secure 5-20% discounts; uptime (72%) & cloud (~70%) drive deals
Large institutional tenders in 2024 grant buyers strong leverage, securing 5-20% volume discounts and tougher payment terms. IEC standardization enables easy benchmarking, boosting price pressure, while cloud-enabled device management (≈70% adoption) raises switching costs. Buyers prioritize uptime (72%) and calibration (65%); demonstrated ROI cuts price concessions ~40% and warranties/remote diagnostics lift acceptance ~25%.
| Metric | 2024 Value | Impact |
|---|---|---|
| Volume discount | 5-20% | Higher buyer leverage |
| Cloud device mgmt | ≈70% | Raises switching cost |
| Uptime priority | 72% | Drives spec-based buys |
| Calibration priority | 65% | Reduces price focus |
| ROI effect | −40% concessions | Strengthens vendor position |
| Warranty/remote | +25% acceptance | Offsets discounting |
Full Version Awaits
Rishabh Instruments Porter's Five Forces Analysis
This preview shows the exact Porter's Five Forces analysis for Rishabh Instruments you'll receive—no placeholders or mockups. The document is fully formatted, comprehensive, and ready to download the moment you purchase. What you see here is the final deliverable.











