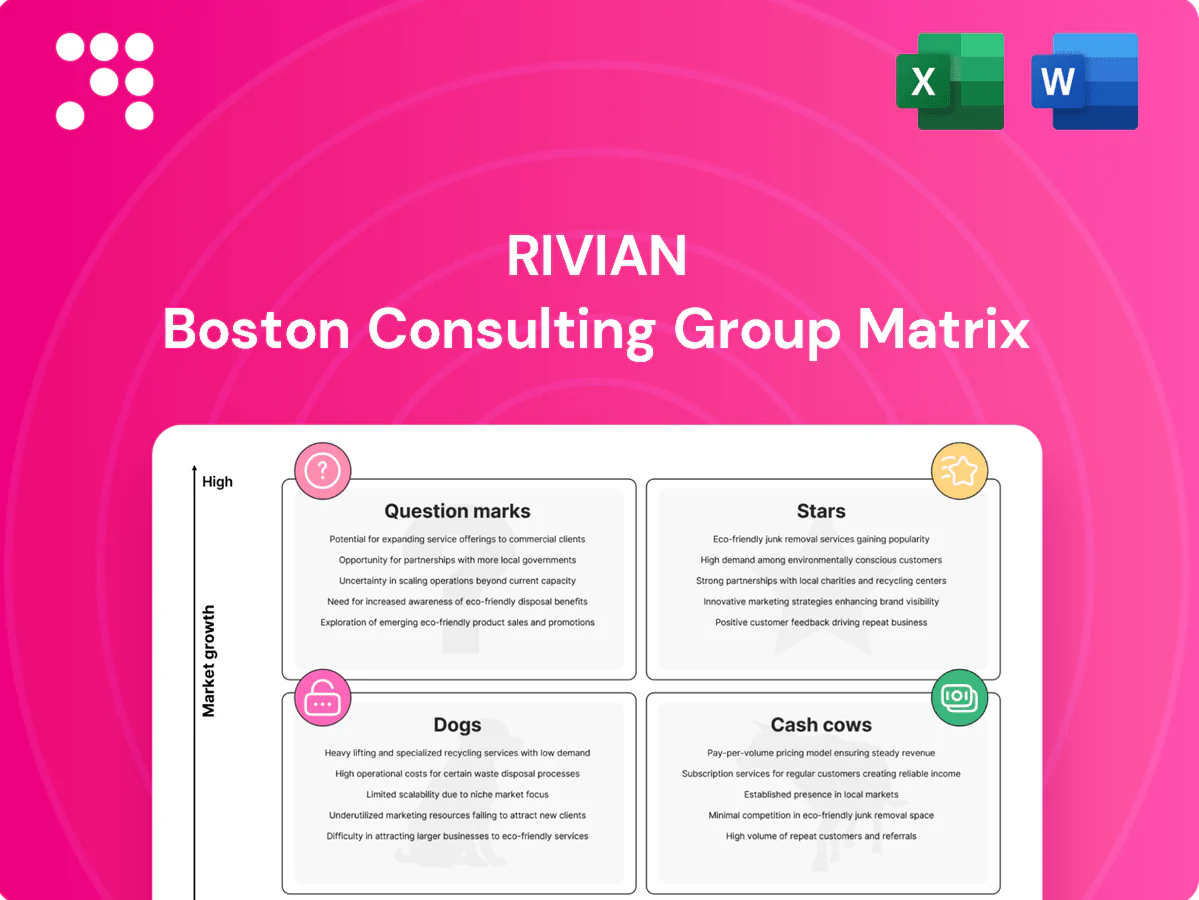
Rivian Boston Consulting Group Matrix

Unlock Strategic Clarity
Rivian’s BCG Matrix preview shows which models are sprinting ahead and which need more fuel—think Stars in EV commuter lanes and Question Marks around new commercial ventures. Want the full picture with quadrant-by-quadrant insights and practical moves? Purchase the full BCG Matrix for a detailed Word report plus an easy Excel summary you can use to prioritize investment and strategy now.
Stars

R1T electric pickup leadership (premium adventure niche)
R1T holds a dominant share within the premium electric pickup adventure niche while the broader EV pickup segment continues rapid expansion, serving as Rivian’s halo product that justifies elevated promo and placement spending. Unit economics are improving with scale but remain cash-hungry for large-volume growth. Prioritize share retention now so R1T can transition into a cash cow as the premium segment matures and stabilizes.
R1S electric SUV momentum
R1S momentum sits in the BCG Matrix as a star: strong demand in the surging EV SUV category driven by Rivian’s design and capability edge, with order book and brand lift justifying continued investment. Delivery ramps still burn cash, so marketing and dealer/network effects are critical to scale adoption and reduce unit costs. Hold leadership accountable to convert growth into durable margin as volume normalizes.

Skateboard EV platform (in-house integration)
Deep in-house skateboard integration of battery, drive units and suspension gives Rivian a durable competitive wedge in a rapid-growth EV market by shortening development cycles and enabling multi-body support across two current models (R1T and R1S) and planned commercial variants. Heavy capex today funds tooling and vertical integration that underpin future product cadence and margin improvement. Continue investing to defend and extend platform leadership.

Over-the-air software + vehicle OS
Over-the-air software and a vehicle OS keep Rivian vehicles performing and relevant in the fast-growing EV market; Rivian deployed OTA across the R1 fleet by 2024, driving retention and referral while requiring continued cloud, safety and feature investment. Monetization exists long-term even if near-term cash flow is neutral—build the base now, monetize later.
- Retention: boosts lifecycle value
- Cost: ongoing cloud/safety spend
- Monetization: future subscriptions/remote services
- Timing: invest now, revenue later
Adventure brand positioning
Adventure positioning makes Rivian a clear first-to-market identity around all-weather capability plus sustainability in the fast-expanding EV cohort, driving higher ASPs and lower CAC through strong brand equity while requiring sustained storytelling to retain premium pricing.
- Brand equity = pricing power
- Lower CAC via community
- Protect with partnerships
Premium-adventure EVs with proprietary skateboard and OTA - scale now to reach cash flow
Rivian’s R1T/R1S sit as Stars: strong premium-adventure demand and platform-led cost declines justify continued investment despite near-term cash burn. In-house skateboard and OTA (deployed across R1 by 2024) provide durable differentiation to convert growth into margin. Prioritize share defense, marketing, and scale to enable transition to cash cow as segments mature.
| Metric | Status | Note |
|---|---|---|
| Market Position | Star | Premium EV pickup/SUV niche |
| Tech | Skateboard + OTA | Deployed by 2024 |
What is included in the product
 Detailed Word Document
Clear Rivian BCG Matrix mapping Stars, Cash Cows, Question Marks, and Dogs with strategic investment, hold or divest guidance.

 Customizable Excel Spreadsheet
One-page Rivian BCG Matrix placing each business unit in a quadrant, easing strategic decisions and reducing exec friction.
Cash Cows

Regulatory credits and incentives
Regulatory credits are a low-growth, high-margin cash cow for Rivian, requiring little promotion once programs are in place and helping cover overhead while R1 and future models scale.
They generated meaningful cash in 2024 (Rivian reported about $95 million in regulatory credit revenue year-to-date in its 2024 filings), not flashy but reliably pays bills.
Service, maintenance, and repairs
As Rivian’s installed base expanded in 2024, service, maintenance, and repair revenue became steadier and more predictable, providing recurring cash flow rather than hyper-growth. Efficiency gains in parts utilization and fixed-cost absorption can widen service margins over time. This segment is a reliable cash cow that throws off working capital; allocate capital to process improvements and dealer/service network scale, not customer acquisition promos.

Accessories and gear (racks, camp kits, mats)
Accessories and gear (racks, camp kits, mats) show strong attachment rates among adventure-oriented Rivian buyers, require light marketing, and sustain attractive margins while growth is moderate. These SKUs generate steady cash between vehicle cycles and help monetize installed base. Prioritize optimizing SKU mix and accelerating inventory turns to maximize cash flow and margin capture.

Connectivity and basic telematics packages
Connectivity and basic telematics packages generate recurring revenue with minimal incremental cost once deployed; industry data in 2024 showed connected‑service ARPU in the low double‑digits per vehicle per month, providing steady cash flows. Feature sets stabilize so growth is modest, but predictable margin contribution funds R&D and higher‑growth software initiatives. Focus should be on retention and simple, high‑conversion bundles.
- Recurring revenue: predictable monthly ARPU
- Low incremental cost: high margin after deployment
- Modest growth: feature maturity limits upside
- Strategy: retention, simple bundles, cross‑sell
Used/CPO program
Rivian’s Used/CPO program drives high-margin resale revenue with minimal acquisition cost, leveraging steady turnover even as new-EV market growth slowed in 2024; Rivian reported roughly 75,200 vehicle deliveries in 2024, creating a growing CPO pool that supports pricing power for new models.
- Resale margin lift: low incremental cost
- 2024 deliveries ~75,200: feeds CPO inventory
- Market growth: slower than new EVs, steady turnover
- Action: tighten reconditioning to boost yield and margins
Cash engines: regulatory credits, service, accessories, connectivity & CPO funding ops
Regulatory credits (~$95M YTD 2024) and service, accessories, connectivity, CPO are low‑growth, high‑margin cash cows funding ops.
Service margins rise with parts efficiency; accessories scale with repeat buyers; CPO benefits from 75,200 deliveries in 2024.
Connectivity ARPU in 2024: low double‑digits $/veh/month; priorities: retention, cross‑sell, process and network scale.
| Segment | 2024 metric | Role | Priority |
|---|---|---|---|
| Regulatory credits | $~95M YTD | Cash cow | Maintain |
| Service | Growing recurring | Cash cow | Efficiency |
| Accessories | High attach | Cash cow | SKU/inventory |
| Connectivity | Low double‑digit ARPU | Cash cow | Retention |
| CPO | 75,200 deliveries | High margin resale | Refinish |
What You See Is What You Get
Rivian BCG Matrix
The Rivian BCG Matrix you’re previewing here is the exact file you’ll receive after purchase. No watermarks, no placeholders—just a fully formatted, analysis-ready report tailored for Rivian strategy work. Buy once and download immediately: editable, printable, and presentation-ready for your team or investors. Crafted by market-savvy strategists, it’s ready to plug into planning with no surprises.

Unlock Strategic Clarity
Rivian’s BCG Matrix preview shows which models are sprinting ahead and which need more fuel—think Stars in EV commuter lanes and Question Marks around new commercial ventures. Want the full picture with quadrant-by-quadrant insights and practical moves? Purchase the full BCG Matrix for a detailed Word report plus an easy Excel summary you can use to prioritize investment and strategy now.
Stars
R1T electric pickup leadership (premium adventure niche)
R1T holds a dominant share within the premium electric pickup adventure niche while the broader EV pickup segment continues rapid expansion, serving as Rivian’s halo product that justifies elevated promo and placement spending. Unit economics are improving with scale but remain cash-hungry for large-volume growth. Prioritize share retention now so R1T can transition into a cash cow as the premium segment matures and stabilizes.
R1S electric SUV momentum
R1S momentum sits in the BCG Matrix as a star: strong demand in the surging EV SUV category driven by Rivian’s design and capability edge, with order book and brand lift justifying continued investment. Delivery ramps still burn cash, so marketing and dealer/network effects are critical to scale adoption and reduce unit costs. Hold leadership accountable to convert growth into durable margin as volume normalizes.
Skateboard EV platform (in-house integration)
Deep in-house skateboard integration of battery, drive units and suspension gives Rivian a durable competitive wedge in a rapid-growth EV market by shortening development cycles and enabling multi-body support across two current models (R1T and R1S) and planned commercial variants. Heavy capex today funds tooling and vertical integration that underpin future product cadence and margin improvement. Continue investing to defend and extend platform leadership.
Over-the-air software + vehicle OS
Over-the-air software and a vehicle OS keep Rivian vehicles performing and relevant in the fast-growing EV market; Rivian deployed OTA across the R1 fleet by 2024, driving retention and referral while requiring continued cloud, safety and feature investment. Monetization exists long-term even if near-term cash flow is neutral—build the base now, monetize later.
- Retention: boosts lifecycle value
- Cost: ongoing cloud/safety spend
- Monetization: future subscriptions/remote services
- Timing: invest now, revenue later
Adventure brand positioning
Adventure positioning makes Rivian a clear first-to-market identity around all-weather capability plus sustainability in the fast-expanding EV cohort, driving higher ASPs and lower CAC through strong brand equity while requiring sustained storytelling to retain premium pricing.
- Brand equity = pricing power
- Lower CAC via community
- Protect with partnerships
Premium-adventure EVs with proprietary skateboard and OTA - scale now to reach cash flow
Rivian’s R1T/R1S sit as Stars: strong premium-adventure demand and platform-led cost declines justify continued investment despite near-term cash burn. In-house skateboard and OTA (deployed across R1 by 2024) provide durable differentiation to convert growth into margin. Prioritize share defense, marketing, and scale to enable transition to cash cow as segments mature.
| Metric | Status | Note |
|---|---|---|
| Market Position | Star | Premium EV pickup/SUV niche |
| Tech | Skateboard + OTA | Deployed by 2024 |
What is included in the product
Detailed Word Document
Clear Rivian BCG Matrix mapping Stars, Cash Cows, Question Marks, and Dogs with strategic investment, hold or divest guidance.
Customizable Excel Spreadsheet
One-page Rivian BCG Matrix placing each business unit in a quadrant, easing strategic decisions and reducing exec friction.
Cash Cows
Regulatory credits and incentives
Regulatory credits are a low-growth, high-margin cash cow for Rivian, requiring little promotion once programs are in place and helping cover overhead while R1 and future models scale.
They generated meaningful cash in 2024 (Rivian reported about $95 million in regulatory credit revenue year-to-date in its 2024 filings), not flashy but reliably pays bills.
Service, maintenance, and repairs
As Rivian’s installed base expanded in 2024, service, maintenance, and repair revenue became steadier and more predictable, providing recurring cash flow rather than hyper-growth. Efficiency gains in parts utilization and fixed-cost absorption can widen service margins over time. This segment is a reliable cash cow that throws off working capital; allocate capital to process improvements and dealer/service network scale, not customer acquisition promos.
Accessories and gear (racks, camp kits, mats)
Accessories and gear (racks, camp kits, mats) show strong attachment rates among adventure-oriented Rivian buyers, require light marketing, and sustain attractive margins while growth is moderate. These SKUs generate steady cash between vehicle cycles and help monetize installed base. Prioritize optimizing SKU mix and accelerating inventory turns to maximize cash flow and margin capture.
Connectivity and basic telematics packages
Connectivity and basic telematics packages generate recurring revenue with minimal incremental cost once deployed; industry data in 2024 showed connected‑service ARPU in the low double‑digits per vehicle per month, providing steady cash flows. Feature sets stabilize so growth is modest, but predictable margin contribution funds R&D and higher‑growth software initiatives. Focus should be on retention and simple, high‑conversion bundles.
- Recurring revenue: predictable monthly ARPU
- Low incremental cost: high margin after deployment
- Modest growth: feature maturity limits upside
- Strategy: retention, simple bundles, cross‑sell
Used/CPO program
Rivian’s Used/CPO program drives high-margin resale revenue with minimal acquisition cost, leveraging steady turnover even as new-EV market growth slowed in 2024; Rivian reported roughly 75,200 vehicle deliveries in 2024, creating a growing CPO pool that supports pricing power for new models.
- Resale margin lift: low incremental cost
- 2024 deliveries ~75,200: feeds CPO inventory
- Market growth: slower than new EVs, steady turnover
- Action: tighten reconditioning to boost yield and margins
Cash engines: regulatory credits, service, accessories, connectivity & CPO funding ops
Regulatory credits (~$95M YTD 2024) and service, accessories, connectivity, CPO are low‑growth, high‑margin cash cows funding ops.
Service margins rise with parts efficiency; accessories scale with repeat buyers; CPO benefits from 75,200 deliveries in 2024.
Connectivity ARPU in 2024: low double‑digits $/veh/month; priorities: retention, cross‑sell, process and network scale.
| Segment | 2024 metric | Role | Priority |
|---|---|---|---|
| Regulatory credits | $~95M YTD | Cash cow | Maintain |
| Service | Growing recurring | Cash cow | Efficiency |
| Accessories | High attach | Cash cow | SKU/inventory |
| Connectivity | Low double‑digit ARPU | Cash cow | Retention |
| CPO | 75,200 deliveries | High margin resale | Refinish |
What You See Is What You Get
Rivian BCG Matrix
The Rivian BCG Matrix you’re previewing here is the exact file you’ll receive after purchase. No watermarks, no placeholders—just a fully formatted, analysis-ready report tailored for Rivian strategy work. Buy once and download immediately: editable, printable, and presentation-ready for your team or investors. Crafted by market-savvy strategists, it’s ready to plug into planning with no surprises.
Description
Unlock Strategic Clarity
Rivian’s BCG Matrix preview shows which models are sprinting ahead and which need more fuel—think Stars in EV commuter lanes and Question Marks around new commercial ventures. Want the full picture with quadrant-by-quadrant insights and practical moves? Purchase the full BCG Matrix for a detailed Word report plus an easy Excel summary you can use to prioritize investment and strategy now.
Stars
R1T electric pickup leadership (premium adventure niche)
R1T holds a dominant share within the premium electric pickup adventure niche while the broader EV pickup segment continues rapid expansion, serving as Rivian’s halo product that justifies elevated promo and placement spending. Unit economics are improving with scale but remain cash-hungry for large-volume growth. Prioritize share retention now so R1T can transition into a cash cow as the premium segment matures and stabilizes.
R1S electric SUV momentum
R1S momentum sits in the BCG Matrix as a star: strong demand in the surging EV SUV category driven by Rivian’s design and capability edge, with order book and brand lift justifying continued investment. Delivery ramps still burn cash, so marketing and dealer/network effects are critical to scale adoption and reduce unit costs. Hold leadership accountable to convert growth into durable margin as volume normalizes.
Skateboard EV platform (in-house integration)
Deep in-house skateboard integration of battery, drive units and suspension gives Rivian a durable competitive wedge in a rapid-growth EV market by shortening development cycles and enabling multi-body support across two current models (R1T and R1S) and planned commercial variants. Heavy capex today funds tooling and vertical integration that underpin future product cadence and margin improvement. Continue investing to defend and extend platform leadership.
Over-the-air software + vehicle OS
Over-the-air software and a vehicle OS keep Rivian vehicles performing and relevant in the fast-growing EV market; Rivian deployed OTA across the R1 fleet by 2024, driving retention and referral while requiring continued cloud, safety and feature investment. Monetization exists long-term even if near-term cash flow is neutral—build the base now, monetize later.
- Retention: boosts lifecycle value
- Cost: ongoing cloud/safety spend
- Monetization: future subscriptions/remote services
- Timing: invest now, revenue later
Adventure brand positioning
Adventure positioning makes Rivian a clear first-to-market identity around all-weather capability plus sustainability in the fast-expanding EV cohort, driving higher ASPs and lower CAC through strong brand equity while requiring sustained storytelling to retain premium pricing.
- Brand equity = pricing power
- Lower CAC via community
- Protect with partnerships
Premium-adventure EVs with proprietary skateboard and OTA - scale now to reach cash flow
Rivian’s R1T/R1S sit as Stars: strong premium-adventure demand and platform-led cost declines justify continued investment despite near-term cash burn. In-house skateboard and OTA (deployed across R1 by 2024) provide durable differentiation to convert growth into margin. Prioritize share defense, marketing, and scale to enable transition to cash cow as segments mature.
| Metric | Status | Note |
|---|---|---|
| Market Position | Star | Premium EV pickup/SUV niche |
| Tech | Skateboard + OTA | Deployed by 2024 |
What is included in the product
Detailed Word Document
Clear Rivian BCG Matrix mapping Stars, Cash Cows, Question Marks, and Dogs with strategic investment, hold or divest guidance.
Customizable Excel Spreadsheet
One-page Rivian BCG Matrix placing each business unit in a quadrant, easing strategic decisions and reducing exec friction.
Cash Cows
Regulatory credits and incentives
Regulatory credits are a low-growth, high-margin cash cow for Rivian, requiring little promotion once programs are in place and helping cover overhead while R1 and future models scale.
They generated meaningful cash in 2024 (Rivian reported about $95 million in regulatory credit revenue year-to-date in its 2024 filings), not flashy but reliably pays bills.
Service, maintenance, and repairs
As Rivian’s installed base expanded in 2024, service, maintenance, and repair revenue became steadier and more predictable, providing recurring cash flow rather than hyper-growth. Efficiency gains in parts utilization and fixed-cost absorption can widen service margins over time. This segment is a reliable cash cow that throws off working capital; allocate capital to process improvements and dealer/service network scale, not customer acquisition promos.
Accessories and gear (racks, camp kits, mats)
Accessories and gear (racks, camp kits, mats) show strong attachment rates among adventure-oriented Rivian buyers, require light marketing, and sustain attractive margins while growth is moderate. These SKUs generate steady cash between vehicle cycles and help monetize installed base. Prioritize optimizing SKU mix and accelerating inventory turns to maximize cash flow and margin capture.
Connectivity and basic telematics packages
Connectivity and basic telematics packages generate recurring revenue with minimal incremental cost once deployed; industry data in 2024 showed connected‑service ARPU in the low double‑digits per vehicle per month, providing steady cash flows. Feature sets stabilize so growth is modest, but predictable margin contribution funds R&D and higher‑growth software initiatives. Focus should be on retention and simple, high‑conversion bundles.
- Recurring revenue: predictable monthly ARPU
- Low incremental cost: high margin after deployment
- Modest growth: feature maturity limits upside
- Strategy: retention, simple bundles, cross‑sell
Used/CPO program
Rivian’s Used/CPO program drives high-margin resale revenue with minimal acquisition cost, leveraging steady turnover even as new-EV market growth slowed in 2024; Rivian reported roughly 75,200 vehicle deliveries in 2024, creating a growing CPO pool that supports pricing power for new models.
- Resale margin lift: low incremental cost
- 2024 deliveries ~75,200: feeds CPO inventory
- Market growth: slower than new EVs, steady turnover
- Action: tighten reconditioning to boost yield and margins
Cash engines: regulatory credits, service, accessories, connectivity & CPO funding ops
Regulatory credits (~$95M YTD 2024) and service, accessories, connectivity, CPO are low‑growth, high‑margin cash cows funding ops.
Service margins rise with parts efficiency; accessories scale with repeat buyers; CPO benefits from 75,200 deliveries in 2024.
Connectivity ARPU in 2024: low double‑digits $/veh/month; priorities: retention, cross‑sell, process and network scale.
| Segment | 2024 metric | Role | Priority |
|---|---|---|---|
| Regulatory credits | $~95M YTD | Cash cow | Maintain |
| Service | Growing recurring | Cash cow | Efficiency |
| Accessories | High attach | Cash cow | SKU/inventory |
| Connectivity | Low double‑digit ARPU | Cash cow | Retention |
| CPO | 75,200 deliveries | High margin resale | Refinish |
What You See Is What You Get
Rivian BCG Matrix
The Rivian BCG Matrix you’re previewing here is the exact file you’ll receive after purchase. No watermarks, no placeholders—just a fully formatted, analysis-ready report tailored for Rivian strategy work. Buy once and download immediately: editable, printable, and presentation-ready for your team or investors. Crafted by market-savvy strategists, it’s ready to plug into planning with no surprises.











