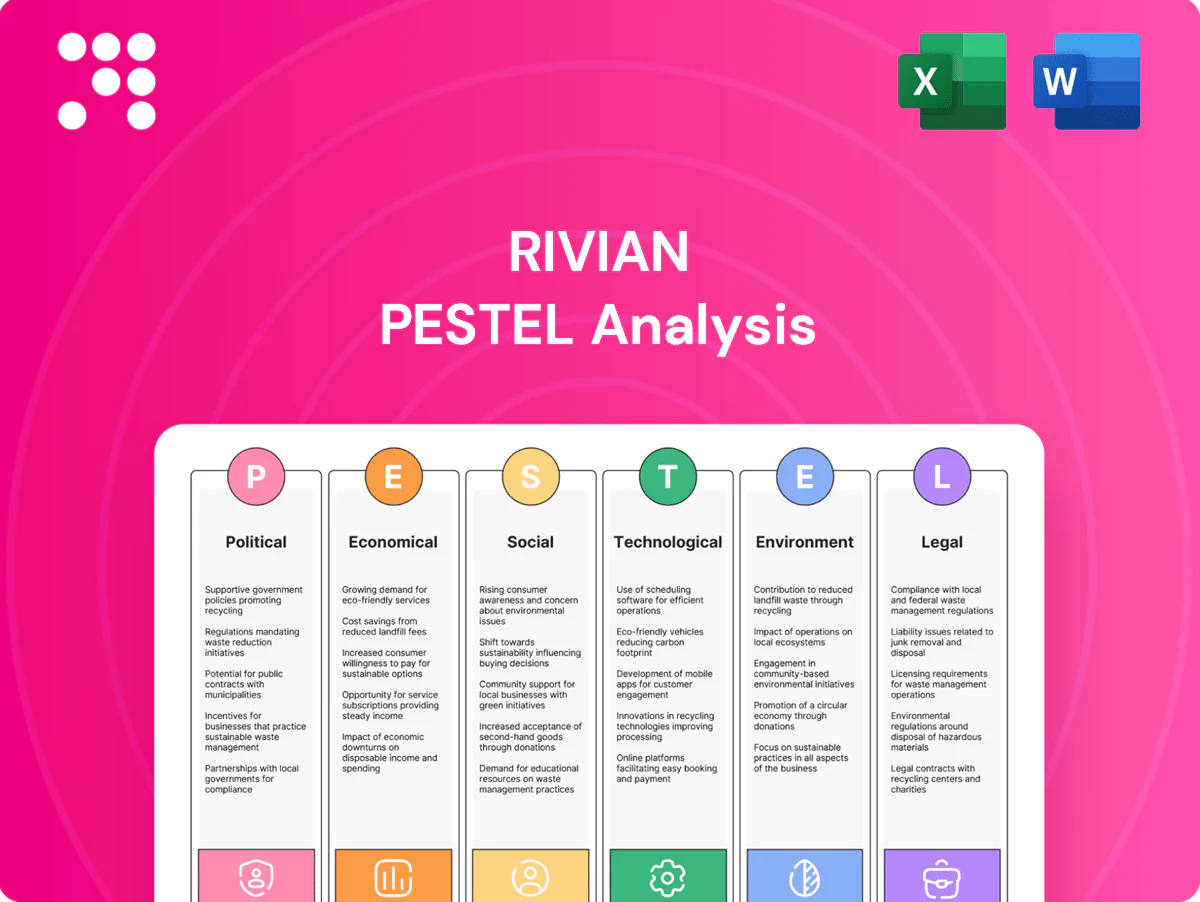
Rivian PESTLE Analysis

Your Competitive Advantage Starts with This Report
Quickly understand how political, economic, social, technological, legal and environmental forces shape Rivian’s prospects in our concise PESTLE overview. Actionable insights highlight supply-chain risks, EV policy drivers, and sustainability pressures. Purchase the full PESTLE for the complete, editable analysis and strategic recommendations.
Political factors

EV incentives and subsidies
Rivian’s sales and margins are highly sensitive to federal and state EV incentives, notably the U.S. IRA’s up to $7,500 clean vehicle tax credit which boosts affordability and can pull-forward demand. Phase-outs and income caps (roughly $150k single/$300k joint) or policy reversals would reduce conversion rates. Global growth depends on local subsidy schemes and import duties, especially in Europe and China.
Industrial policy and onshoring
US industrial policy and push to onshore battery and vehicle manufacturing steer Rivian toward domestic plant siting and long-term supplier deals to secure cells and cathode materials. Access to up to 7,500 USD IRA EV tax credits and related incentives can lower per-unit costs and improve margins. Phased domestic-content rules for battery components and critical minerals shape sourcing decisions, while policy stability is crucial for multi-year capex planning.

Charging infrastructure funding
Public NEVI funding of roughly $5 billion complements Rivian’s private rollout by subsidizing fast-charging corridors while US public networks surpassed ~150,000 ports by 2024. Interoperability mandates (state and federal) can lower range anxiety and lift EV adoption rates. Delays or budget cuts slow usage growth on adventure routes, and coordination with utilities and states directly affects deployment timelines and site readiness.

Trade policy and tariffs
Tariffs on batteries, cells and components raise Rivian's BOM and pricing pressure; US Section 301 tariffs on many Chinese goods remain up to 25% and IRA domestic-content rules (2024: battery components 50%, critical minerals 40%) affect tax-credit eligibility and cost pass-through. Export plans face EU homologation and quota/tariff barriers, while shifting US-China and US-EU trade dynamics plus currency-linked trade actions increase planning volatility.
- Tariff exposure: up to 25% (Section 301)
- IRA thresholds 2024: battery components 50%, critical minerals 40%
- Homologation/quotas constrain EU exports
- Currency-linked trade actions → forecasting volatility
Geopolitical supply risk
Rivian faces geopolitical supply risk as critical minerals are concentrated: DRC supplies ~70% of mined cobalt, Australia ~53% of lithium mine output (2023), and Indonesia/Philippines account for ~40–50% of nickel production; China controls ~80% of cobalt refining capacity, heightening disruption risk.
- Sanctions/unrest can cut nickel, lithium, cobalt flows
- Diversification and recycling lower risk but raise capex/OPEX
- Government stockpiles and US-EU partnerships (post-2022–24) will shape availability
IRA 7,500 USD, NEVI ~5B; tariffs & supply risk
IRA up to 7,500 USD (income caps ~150k/300k) drives demand; phase-outs cut conversion. NEVI ~5B and ~150,000 public ports (2024) aid adoption; delays slow rollouts. Tariffs/IRA domestic-content (2024: battery comps 50%, critical minerals 40%) plus Section 301 up to 25% and concentrated supplies (DRC ~70% cobalt, Australia ~53% lithium, China ~80% refining) heighten cost and supply risk.
| Metric | Value |
|---|---|
| IRA tax credit | 7,500 USD |
| Income caps | ~150k/300k |
| NEVI funding | ~5B USD |
| Public ports (2024) | ~150,000 |
| Section 301 tariff | up to 25% |
| Battery rules (2024) | 50% comps / 40% minerals |
| DRC cobalt | ~70% |
| Australia lithium | ~53% |
| China cobalt refining | ~80% |
What is included in the product
 Detailed Word Document
Explores how Political, Economic, Social, Technological, Environmental, and Legal forces uniquely shape Rivian’s EV strategy, with data-driven trends, risk/opportunity highlights, forward-looking scenario cues, and practitioner-ready insights to support executives, investors, and strategists in decision-making and funding discussions.

 Customizable Excel Spreadsheet
A concise, visually segmented Rivian PESTLE summary that can be dropped into presentations or strategy packs, edited with region- or business-line notes, and easily shared across teams to streamline discussions on external risks, regulatory shifts, and market positioning during planning sessions.
Economic factors

Consumer demand cyclicality
High-ticket EV demand is sensitive to macro slowdowns and rate-driven affordability as the fed funds rate sat near 5.25% in mid-2025, raising financing costs for buyers. Pickup/SUV demand—about 70% of US light-vehicle sales—remains relatively resilient but can still fall in recessions. Changes in incentives and fuel prices (US gas near $3.50/gal in 2025) shift TCO math, and Rivian has warned that order-book quality and cancellations materially affect factory cadence.
Battery raw material costs
Lithium carbonate fell from ~70,000 USD/t in 2022 to about 20,000–30,000 USD/t in 2024 (BNEF), nickel averaged ~21,000 USD/t in 2024 and natural/synthetic graphite trades roughly 1,500–3,500 USD/t, so these prices largely set Rivian’s margin trajectory; hedging and multi‑year supply contracts smooth but do not eliminate spikes. Chemistry choices (NCM vs LFP) trade cost for energy density, and recycling plus yield gains—projected to cut material intensity ~10–15% by 2030—lower long‑run exposure.

Scale and manufacturing learning
Unit economics for Rivian hinge on utilization, yield and labor productivity gains; higher throughput at the Normal, IL plant (target capacity ~150,000 vehicles/year) improves fixed-cost absorption and per-vehicle cost. Platform commonality and component standardization drive further cost-downs. Production delays inflate working capital and cash burn, a risk after 54,401 deliveries in 2023.

Competitive pricing pressure
Rivian faces compressing ASPs as Tesla and legacy OEMs enacted price cuts in 2023–24 (Tesla reductions reached as much as 20% in some markets), pushing feature-for-price comparisons that reshape mix and options uptake. Large fleet deals such as Amazon’s 100,000-vehicle commitment drive volume but typically lower margins, so Rivian must prove brand differentiation to sustain any premium.
- Price cuts: Tesla up to 20% (2023–24)
- Fleet scale: Amazon ~100,000 vans
- Mix risk: options uptake shifts
- Premium at stake: need clear differentiation
Capital markets access
Expansion requires sustained investment in plants, batteries and software; Rivian's 2019 strategic partner Amazon committed a 100,000-van order and made a $700 million investment, showing how partnerships can de-risk funding. Equity or debt costs hinge on execution milestones and market sentiment, and liquidity buffers are critical through ramp variability.
- Partnerships: Amazon 100,000 vans; $700m investment
- Capex need: plants, batteries, software
- Funding risk: execution-based pricing
- Mitigation: liquidity buffers
IRA 7,500 USD, NEVI ~5B; tariffs & supply risk
High rates (~5.25% mid‑2025) and $3.50/gal fuel pressure high-ticket EV affordability; order cancellations hit cadence. Commodity costs (Li2CO3 ~20–30k USD/t 2024, Ni ~21k USD/t 2024) set margins despite hedges. Normal plant target ~150k units/year; 2023 deliveries 54,401; Amazon 100k vans and $700m support scale but lower initial margins.
| Metric | Value |
|---|---|
| Fed funds | ~5.25% (mid‑2025) |
| Gas | $3.50/gal (2025) |
| Li2CO3 | 20–30k USD/t (2024) |
| Deliveries | 54,401 (2023) |
| Normal plant cap | ~150,000/yr |
| Amazon | 100,000 vans; $700m |
What You See Is What You Get
Rivian PESTLE Analysis
The preview shown here is the exact Rivian PESTLE Analysis you’ll receive after purchase—fully formatted and ready to use. No placeholders or teasers: the layout, content, and structure visible here are the final file. You can download this professionally structured report immediately after checkout.

Your Competitive Advantage Starts with This Report
Quickly understand how political, economic, social, technological, legal and environmental forces shape Rivian’s prospects in our concise PESTLE overview. Actionable insights highlight supply-chain risks, EV policy drivers, and sustainability pressures. Purchase the full PESTLE for the complete, editable analysis and strategic recommendations.
Political factors
EV incentives and subsidies
Rivian’s sales and margins are highly sensitive to federal and state EV incentives, notably the U.S. IRA’s up to $7,500 clean vehicle tax credit which boosts affordability and can pull-forward demand. Phase-outs and income caps (roughly $150k single/$300k joint) or policy reversals would reduce conversion rates. Global growth depends on local subsidy schemes and import duties, especially in Europe and China.
Industrial policy and onshoring
US industrial policy and push to onshore battery and vehicle manufacturing steer Rivian toward domestic plant siting and long-term supplier deals to secure cells and cathode materials. Access to up to 7,500 USD IRA EV tax credits and related incentives can lower per-unit costs and improve margins. Phased domestic-content rules for battery components and critical minerals shape sourcing decisions, while policy stability is crucial for multi-year capex planning.
Charging infrastructure funding
Public NEVI funding of roughly $5 billion complements Rivian’s private rollout by subsidizing fast-charging corridors while US public networks surpassed ~150,000 ports by 2024. Interoperability mandates (state and federal) can lower range anxiety and lift EV adoption rates. Delays or budget cuts slow usage growth on adventure routes, and coordination with utilities and states directly affects deployment timelines and site readiness.
Trade policy and tariffs
Tariffs on batteries, cells and components raise Rivian's BOM and pricing pressure; US Section 301 tariffs on many Chinese goods remain up to 25% and IRA domestic-content rules (2024: battery components 50%, critical minerals 40%) affect tax-credit eligibility and cost pass-through. Export plans face EU homologation and quota/tariff barriers, while shifting US-China and US-EU trade dynamics plus currency-linked trade actions increase planning volatility.
- Tariff exposure: up to 25% (Section 301)
- IRA thresholds 2024: battery components 50%, critical minerals 40%
- Homologation/quotas constrain EU exports
- Currency-linked trade actions → forecasting volatility
Geopolitical supply risk
Rivian faces geopolitical supply risk as critical minerals are concentrated: DRC supplies ~70% of mined cobalt, Australia ~53% of lithium mine output (2023), and Indonesia/Philippines account for ~40–50% of nickel production; China controls ~80% of cobalt refining capacity, heightening disruption risk.
- Sanctions/unrest can cut nickel, lithium, cobalt flows
- Diversification and recycling lower risk but raise capex/OPEX
- Government stockpiles and US-EU partnerships (post-2022–24) will shape availability
IRA 7,500 USD, NEVI ~5B; tariffs & supply risk
IRA up to 7,500 USD (income caps ~150k/300k) drives demand; phase-outs cut conversion. NEVI ~5B and ~150,000 public ports (2024) aid adoption; delays slow rollouts. Tariffs/IRA domestic-content (2024: battery comps 50%, critical minerals 40%) plus Section 301 up to 25% and concentrated supplies (DRC ~70% cobalt, Australia ~53% lithium, China ~80% refining) heighten cost and supply risk.
| Metric | Value |
|---|---|
| IRA tax credit | 7,500 USD |
| Income caps | ~150k/300k |
| NEVI funding | ~5B USD |
| Public ports (2024) | ~150,000 |
| Section 301 tariff | up to 25% |
| Battery rules (2024) | 50% comps / 40% minerals |
| DRC cobalt | ~70% |
| Australia lithium | ~53% |
| China cobalt refining | ~80% |
What is included in the product
Detailed Word Document
Explores how Political, Economic, Social, Technological, Environmental, and Legal forces uniquely shape Rivian’s EV strategy, with data-driven trends, risk/opportunity highlights, forward-looking scenario cues, and practitioner-ready insights to support executives, investors, and strategists in decision-making and funding discussions.
Customizable Excel Spreadsheet
A concise, visually segmented Rivian PESTLE summary that can be dropped into presentations or strategy packs, edited with region- or business-line notes, and easily shared across teams to streamline discussions on external risks, regulatory shifts, and market positioning during planning sessions.
Economic factors
Consumer demand cyclicality
High-ticket EV demand is sensitive to macro slowdowns and rate-driven affordability as the fed funds rate sat near 5.25% in mid-2025, raising financing costs for buyers. Pickup/SUV demand—about 70% of US light-vehicle sales—remains relatively resilient but can still fall in recessions. Changes in incentives and fuel prices (US gas near $3.50/gal in 2025) shift TCO math, and Rivian has warned that order-book quality and cancellations materially affect factory cadence.
Battery raw material costs
Lithium carbonate fell from ~70,000 USD/t in 2022 to about 20,000–30,000 USD/t in 2024 (BNEF), nickel averaged ~21,000 USD/t in 2024 and natural/synthetic graphite trades roughly 1,500–3,500 USD/t, so these prices largely set Rivian’s margin trajectory; hedging and multi‑year supply contracts smooth but do not eliminate spikes. Chemistry choices (NCM vs LFP) trade cost for energy density, and recycling plus yield gains—projected to cut material intensity ~10–15% by 2030—lower long‑run exposure.
Scale and manufacturing learning
Unit economics for Rivian hinge on utilization, yield and labor productivity gains; higher throughput at the Normal, IL plant (target capacity ~150,000 vehicles/year) improves fixed-cost absorption and per-vehicle cost. Platform commonality and component standardization drive further cost-downs. Production delays inflate working capital and cash burn, a risk after 54,401 deliveries in 2023.
Competitive pricing pressure
Rivian faces compressing ASPs as Tesla and legacy OEMs enacted price cuts in 2023–24 (Tesla reductions reached as much as 20% in some markets), pushing feature-for-price comparisons that reshape mix and options uptake. Large fleet deals such as Amazon’s 100,000-vehicle commitment drive volume but typically lower margins, so Rivian must prove brand differentiation to sustain any premium.
- Price cuts: Tesla up to 20% (2023–24)
- Fleet scale: Amazon ~100,000 vans
- Mix risk: options uptake shifts
- Premium at stake: need clear differentiation
Capital markets access
Expansion requires sustained investment in plants, batteries and software; Rivian's 2019 strategic partner Amazon committed a 100,000-van order and made a $700 million investment, showing how partnerships can de-risk funding. Equity or debt costs hinge on execution milestones and market sentiment, and liquidity buffers are critical through ramp variability.
- Partnerships: Amazon 100,000 vans; $700m investment
- Capex need: plants, batteries, software
- Funding risk: execution-based pricing
- Mitigation: liquidity buffers
IRA 7,500 USD, NEVI ~5B; tariffs & supply risk
High rates (~5.25% mid‑2025) and $3.50/gal fuel pressure high-ticket EV affordability; order cancellations hit cadence. Commodity costs (Li2CO3 ~20–30k USD/t 2024, Ni ~21k USD/t 2024) set margins despite hedges. Normal plant target ~150k units/year; 2023 deliveries 54,401; Amazon 100k vans and $700m support scale but lower initial margins.
| Metric | Value |
|---|---|
| Fed funds | ~5.25% (mid‑2025) |
| Gas | $3.50/gal (2025) |
| Li2CO3 | 20–30k USD/t (2024) |
| Deliveries | 54,401 (2023) |
| Normal plant cap | ~150,000/yr |
| Amazon | 100,000 vans; $700m |
What You See Is What You Get
Rivian PESTLE Analysis
The preview shown here is the exact Rivian PESTLE Analysis you’ll receive after purchase—fully formatted and ready to use. No placeholders or teasers: the layout, content, and structure visible here are the final file. You can download this professionally structured report immediately after checkout.
Original: $10.00
-65%$10.00
$3.50Description
Your Competitive Advantage Starts with This Report
Quickly understand how political, economic, social, technological, legal and environmental forces shape Rivian’s prospects in our concise PESTLE overview. Actionable insights highlight supply-chain risks, EV policy drivers, and sustainability pressures. Purchase the full PESTLE for the complete, editable analysis and strategic recommendations.
Political factors
EV incentives and subsidies
Rivian’s sales and margins are highly sensitive to federal and state EV incentives, notably the U.S. IRA’s up to $7,500 clean vehicle tax credit which boosts affordability and can pull-forward demand. Phase-outs and income caps (roughly $150k single/$300k joint) or policy reversals would reduce conversion rates. Global growth depends on local subsidy schemes and import duties, especially in Europe and China.
Industrial policy and onshoring
US industrial policy and push to onshore battery and vehicle manufacturing steer Rivian toward domestic plant siting and long-term supplier deals to secure cells and cathode materials. Access to up to 7,500 USD IRA EV tax credits and related incentives can lower per-unit costs and improve margins. Phased domestic-content rules for battery components and critical minerals shape sourcing decisions, while policy stability is crucial for multi-year capex planning.
Charging infrastructure funding
Public NEVI funding of roughly $5 billion complements Rivian’s private rollout by subsidizing fast-charging corridors while US public networks surpassed ~150,000 ports by 2024. Interoperability mandates (state and federal) can lower range anxiety and lift EV adoption rates. Delays or budget cuts slow usage growth on adventure routes, and coordination with utilities and states directly affects deployment timelines and site readiness.
Trade policy and tariffs
Tariffs on batteries, cells and components raise Rivian's BOM and pricing pressure; US Section 301 tariffs on many Chinese goods remain up to 25% and IRA domestic-content rules (2024: battery components 50%, critical minerals 40%) affect tax-credit eligibility and cost pass-through. Export plans face EU homologation and quota/tariff barriers, while shifting US-China and US-EU trade dynamics plus currency-linked trade actions increase planning volatility.
- Tariff exposure: up to 25% (Section 301)
- IRA thresholds 2024: battery components 50%, critical minerals 40%
- Homologation/quotas constrain EU exports
- Currency-linked trade actions → forecasting volatility
Geopolitical supply risk
Rivian faces geopolitical supply risk as critical minerals are concentrated: DRC supplies ~70% of mined cobalt, Australia ~53% of lithium mine output (2023), and Indonesia/Philippines account for ~40–50% of nickel production; China controls ~80% of cobalt refining capacity, heightening disruption risk.
- Sanctions/unrest can cut nickel, lithium, cobalt flows
- Diversification and recycling lower risk but raise capex/OPEX
- Government stockpiles and US-EU partnerships (post-2022–24) will shape availability
IRA 7,500 USD, NEVI ~5B; tariffs & supply risk
IRA up to 7,500 USD (income caps ~150k/300k) drives demand; phase-outs cut conversion. NEVI ~5B and ~150,000 public ports (2024) aid adoption; delays slow rollouts. Tariffs/IRA domestic-content (2024: battery comps 50%, critical minerals 40%) plus Section 301 up to 25% and concentrated supplies (DRC ~70% cobalt, Australia ~53% lithium, China ~80% refining) heighten cost and supply risk.
| Metric | Value |
|---|---|
| IRA tax credit | 7,500 USD |
| Income caps | ~150k/300k |
| NEVI funding | ~5B USD |
| Public ports (2024) | ~150,000 |
| Section 301 tariff | up to 25% |
| Battery rules (2024) | 50% comps / 40% minerals |
| DRC cobalt | ~70% |
| Australia lithium | ~53% |
| China cobalt refining | ~80% |
What is included in the product
Detailed Word Document
Explores how Political, Economic, Social, Technological, Environmental, and Legal forces uniquely shape Rivian’s EV strategy, with data-driven trends, risk/opportunity highlights, forward-looking scenario cues, and practitioner-ready insights to support executives, investors, and strategists in decision-making and funding discussions.
Customizable Excel Spreadsheet
A concise, visually segmented Rivian PESTLE summary that can be dropped into presentations or strategy packs, edited with region- or business-line notes, and easily shared across teams to streamline discussions on external risks, regulatory shifts, and market positioning during planning sessions.
Economic factors
Consumer demand cyclicality
High-ticket EV demand is sensitive to macro slowdowns and rate-driven affordability as the fed funds rate sat near 5.25% in mid-2025, raising financing costs for buyers. Pickup/SUV demand—about 70% of US light-vehicle sales—remains relatively resilient but can still fall in recessions. Changes in incentives and fuel prices (US gas near $3.50/gal in 2025) shift TCO math, and Rivian has warned that order-book quality and cancellations materially affect factory cadence.
Battery raw material costs
Lithium carbonate fell from ~70,000 USD/t in 2022 to about 20,000–30,000 USD/t in 2024 (BNEF), nickel averaged ~21,000 USD/t in 2024 and natural/synthetic graphite trades roughly 1,500–3,500 USD/t, so these prices largely set Rivian’s margin trajectory; hedging and multi‑year supply contracts smooth but do not eliminate spikes. Chemistry choices (NCM vs LFP) trade cost for energy density, and recycling plus yield gains—projected to cut material intensity ~10–15% by 2030—lower long‑run exposure.
Scale and manufacturing learning
Unit economics for Rivian hinge on utilization, yield and labor productivity gains; higher throughput at the Normal, IL plant (target capacity ~150,000 vehicles/year) improves fixed-cost absorption and per-vehicle cost. Platform commonality and component standardization drive further cost-downs. Production delays inflate working capital and cash burn, a risk after 54,401 deliveries in 2023.
Competitive pricing pressure
Rivian faces compressing ASPs as Tesla and legacy OEMs enacted price cuts in 2023–24 (Tesla reductions reached as much as 20% in some markets), pushing feature-for-price comparisons that reshape mix and options uptake. Large fleet deals such as Amazon’s 100,000-vehicle commitment drive volume but typically lower margins, so Rivian must prove brand differentiation to sustain any premium.
- Price cuts: Tesla up to 20% (2023–24)
- Fleet scale: Amazon ~100,000 vans
- Mix risk: options uptake shifts
- Premium at stake: need clear differentiation
Capital markets access
Expansion requires sustained investment in plants, batteries and software; Rivian's 2019 strategic partner Amazon committed a 100,000-van order and made a $700 million investment, showing how partnerships can de-risk funding. Equity or debt costs hinge on execution milestones and market sentiment, and liquidity buffers are critical through ramp variability.
- Partnerships: Amazon 100,000 vans; $700m investment
- Capex need: plants, batteries, software
- Funding risk: execution-based pricing
- Mitigation: liquidity buffers
IRA 7,500 USD, NEVI ~5B; tariffs & supply risk
High rates (~5.25% mid‑2025) and $3.50/gal fuel pressure high-ticket EV affordability; order cancellations hit cadence. Commodity costs (Li2CO3 ~20–30k USD/t 2024, Ni ~21k USD/t 2024) set margins despite hedges. Normal plant target ~150k units/year; 2023 deliveries 54,401; Amazon 100k vans and $700m support scale but lower initial margins.
| Metric | Value |
|---|---|
| Fed funds | ~5.25% (mid‑2025) |
| Gas | $3.50/gal (2025) |
| Li2CO3 | 20–30k USD/t (2024) |
| Deliveries | 54,401 (2023) |
| Normal plant cap | ~150,000/yr |
| Amazon | 100,000 vans; $700m |
What You See Is What You Get
Rivian PESTLE Analysis
The preview shown here is the exact Rivian PESTLE Analysis you’ll receive after purchase—fully formatted and ready to use. No placeholders or teasers: the layout, content, and structure visible here are the final file. You can download this professionally structured report immediately after checkout.











