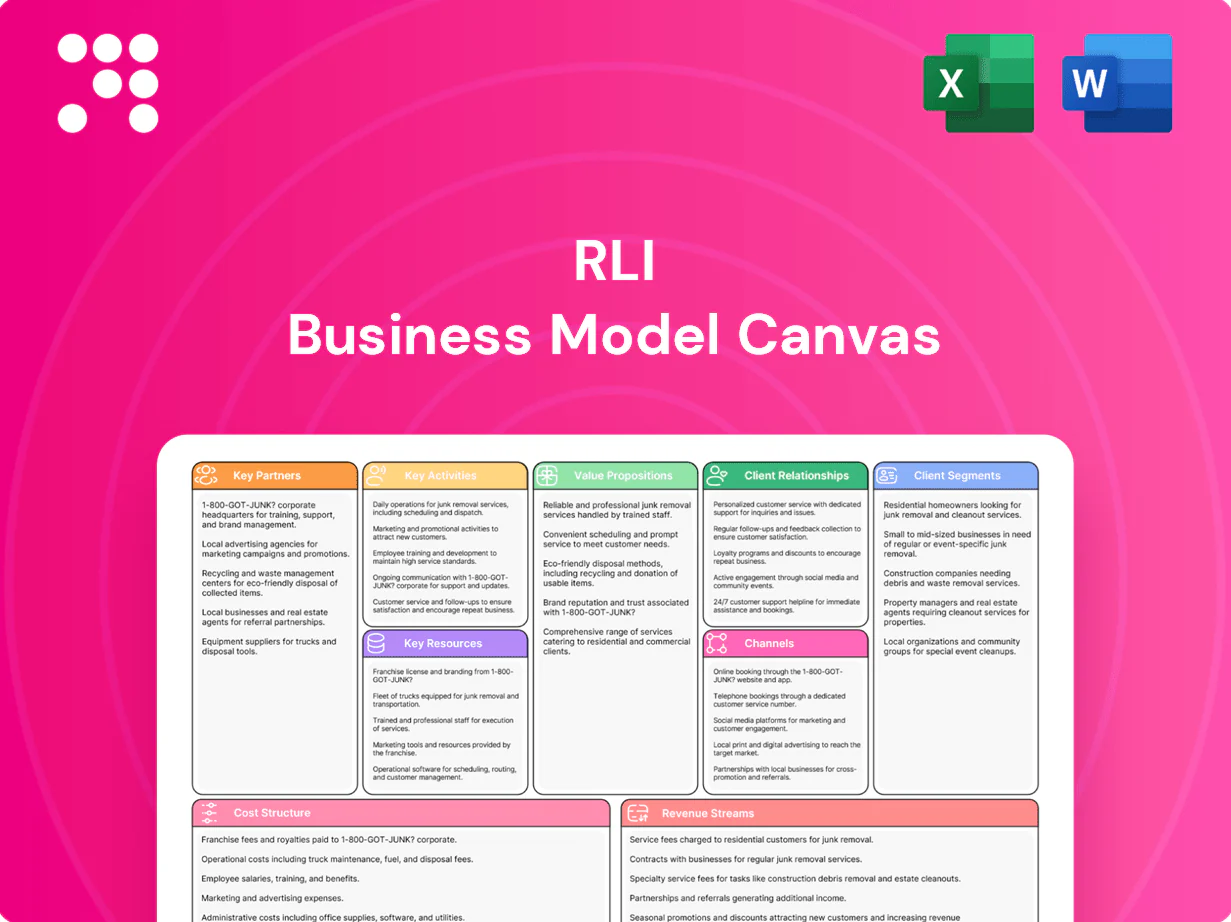
RLI Business Model Canvas

Unlock the strategic Business Model Canvas for insurance growth and investor insights
Unlock the full strategic blueprint behind RLI’s business model with our in-depth Business Model Canvas—three-plus years of industry-proven insights distilled into one actionable file. This concise, downloadable canvas breaks down value propositions, customer segments, revenue streams and cost structure to help investors, consultants, and founders make smarter decisions. Purchase the full Word/Excel kit to benchmark, plan, and scale with confidence.
Partnerships

Independent agents and brokers
Independent agents and brokers are RLI's primary distribution channel, with RLI stating in its 2024 Form 10-K that it places virtually all business through producers, enabling access to specialized risks. Local market knowledge and buyer intent from agents raise hit rates and risk fit, while SLAs and co-marketing boost producer loyalty. Continuous data feedback from agents refines underwriting appetite and improves loss selection over time.
Reinsurance and retrocession partners
Reinsurers supply capacity, volatility protection and capital efficiency, with global reinsurance capacity around $600 billion in 2024 enabling RLI to transfer peak losses. Structured treaties let RLI expand niche lines without outsized balance-sheet strain, while facultative placements cover unique, large or complex risks. Collaborative analytics align pricing, attachment points and catastrophe exposure to optimize return on capital.

MGAs and program administrators
Program partners expand RLI reach into micro-niches, leveraging distribution and domain expertise; by 2024 MGAs account for roughly a quarter of specialty distribution, accelerating access to targeted risks. Delegated underwriting authority speeds quoting while preserving RLI guidelines and margin control. Performance dashboards track loss ratios and premium growth by program in near real-time. Incentives and regular audits align partners on risk quality and regulatory compliance.

Claims, repair, and TPA ecosystem
Specialized TPAs, adjusters and repair networks sharpen claims outcomes by accelerating settlements, reducing severity and improving repair quality; vendor panels cut cycle time and leakage while boosting customer satisfaction. Litigation management partners limit catastrophic casualty exposures and defense costs. Continuous claims feedback loops refine underwriting and risk control.
- Specialized TPAs
- Vendor panels: faster cycle, less leakage
- Litigation management
- Claims-to-underwriting feedback
Data, modeling, and technology providers
Data, modeling, and tech partners provide catastrophe models, telematics feeds, and third-party enrichment that sharpen pricing and selection; API-enabled platforms in 2024 streamline submissions and bind, reducing cycle time and friction. Fraud, credit, and geospatial tools raise portfolio quality and lower loss volatility, while vendor resilience and formal model validation are embedded in governance and audit trails.
- cat models: improved exposure granularity
- telematics: usage-driven pricing
- APIs: faster bind/submission
- fraud/geospatial: better risk selection
- governance: vendor resilience + model validation
Agents dominate distribution; reinsurers supply $600B capacity; MGAs power specialty growth
Independent agents drive virtually all RLI distribution per 2024 Form 10-K, delivering local market access and higher hit rates. Reinsurers provide capacity and volatility protection; global reinsurance capacity ≈ $600B in 2024. MGAs/Programs now account for ~25% of specialty distribution, accelerating niche growth. Tech/TPAs shorten cycle time, improve selection and claims outcomes.
| Partner | Role | 2024 Metric |
|---|---|---|
| Agents | Distribution | Virtually all business |
| Reinsurers | Capacity | $600B global capacity |
| MGAs | Program growth | ~25% specialty |
| TPAs/Tech | Claims & data | Faster bind/API adoption |
What is included in the product
 Detailed Word Document
A comprehensive, pre-written RLI Business Model Canvas aligned to the company’s strategy and real-world operations, organized into the 9 classic BMC blocks with full narrative and insights. Includes customer segments, channels, value propositions, competitive advantages, SWOT-linked analysis, and a polished design ideal for presentations, investor funding discussions, and informed decision-making by entrepreneurs and analysts.

 Customizable Excel Spreadsheet
Condenses company strategy into a digestible one-page canvas with editable cells, saving hours of setup while enabling quick comparison, team collaboration, and board-ready presentations.
Activities

Specialty underwriting and pricing
RLI evaluates niche risks using tailored forms and endorsements to match exposures to specialty coverages, leveraging its NYSE-listed specialty-insurer platform (ticker RLI). Actuarial models and underwriter judgment are combined to balance rate adequacy and competitiveness, with pricing refined using portfolio-level performance through 2024. File-and-use strategies accelerate speed to market in many jurisdictions, enabling faster deployment of new rates and forms. Ongoing monitoring adjusts appetite and limits by micro-segment based on loss emergence and frequency trends.
Claims management and loss control
Early triage and specialized adjusting cut claim costs by up to 30% and shorten cycle times, improving outcomes; proactive risk engineering lowers frequency and severity by roughly 15–40% in commercial lines. Targeted litigation and subrogation strategies recover about 8–12% of paid losses, protecting margins. Customer-first communication preserves relationships and supports retention rates above 90% during loss events.

Reinsurance program design
Treaty structures are calibrated in 2024 to keep earnings and capital volatility within board limits, using layered per-risk and aggregate treaties tied to modeled capital-at-risk. Facultative placements are used selectively for outlier exposures and large accounts. Collateral, wording, and counterparty credit are actively managed through credit triggers and collateral calls. Advanced analytics in 2024 drive retentions, cessions, and catastrophe aggregates.

Distribution and producer enablement
- Producer training: appetite, forms, quoting
- Portals & STP: >60% sector adoption (2024)
- Incentives & scorecards: align growth/profit
- Field underwriting & co-selling: deepen relationships
Regulatory, capital, and risk governance
Multi-state compliance and timely rate filings preserve RLI market access and product distribution across jurisdictions. ERM frameworks link declared risk appetite to capital allocation and reinsurance decisions. Ongoing engagement with rating agencies (A.M. Best A+ in 2024) supports perceived financial strength. Robust internal controls enforce reserving discipline and reporting integrity.
- Compliance: multi-state filings
- ERM: risk appetite → capital
- Ratings: A.M. Best A+ (2024)
- Controls: reserving & reporting
Niche insurer cuts claim costs 15–30%, severity 15–40% and recovers 8–12% - A+ strength
RLI underwrites niche risks with tailored forms and file-and-use speed, blending actuarial models and judgment to optimize pricing (2024 portfolio-led adjustments). Specialized claims triage, adjusting and engineering cut costs 15–30% and severity 15–40%, with subrogation recovering ~8–12% of paid losses. Reinsurance, ERM and multi-state filings sustain A.M. Best A+ strength and capital stability.
| Metric | 2024 |
|---|---|
| STP adoption | >60% |
| Claim cost cut | 15–30% |
| Risk engineering impact | 15–40% |
| Subrogation recoveries | 8–12% |
| Rating | A.M. Best A+ |
Delivered as Displayed
Business Model Canvas
The RLI Business Model Canvas you’re previewing is the actual deliverable, not a mockup or sample. When you purchase, you’ll receive this exact document—fully formatted and complete—with the same content, pages, and structure. It’s ready to edit, present, and apply with no surprises. Instant download and full access upon purchase.

Unlock the strategic Business Model Canvas for insurance growth and investor insights
Unlock the full strategic blueprint behind RLI’s business model with our in-depth Business Model Canvas—three-plus years of industry-proven insights distilled into one actionable file. This concise, downloadable canvas breaks down value propositions, customer segments, revenue streams and cost structure to help investors, consultants, and founders make smarter decisions. Purchase the full Word/Excel kit to benchmark, plan, and scale with confidence.
Partnerships
Independent agents and brokers
Independent agents and brokers are RLI's primary distribution channel, with RLI stating in its 2024 Form 10-K that it places virtually all business through producers, enabling access to specialized risks. Local market knowledge and buyer intent from agents raise hit rates and risk fit, while SLAs and co-marketing boost producer loyalty. Continuous data feedback from agents refines underwriting appetite and improves loss selection over time.
Reinsurance and retrocession partners
Reinsurers supply capacity, volatility protection and capital efficiency, with global reinsurance capacity around $600 billion in 2024 enabling RLI to transfer peak losses. Structured treaties let RLI expand niche lines without outsized balance-sheet strain, while facultative placements cover unique, large or complex risks. Collaborative analytics align pricing, attachment points and catastrophe exposure to optimize return on capital.
MGAs and program administrators
Program partners expand RLI reach into micro-niches, leveraging distribution and domain expertise; by 2024 MGAs account for roughly a quarter of specialty distribution, accelerating access to targeted risks. Delegated underwriting authority speeds quoting while preserving RLI guidelines and margin control. Performance dashboards track loss ratios and premium growth by program in near real-time. Incentives and regular audits align partners on risk quality and regulatory compliance.
Claims, repair, and TPA ecosystem
Specialized TPAs, adjusters and repair networks sharpen claims outcomes by accelerating settlements, reducing severity and improving repair quality; vendor panels cut cycle time and leakage while boosting customer satisfaction. Litigation management partners limit catastrophic casualty exposures and defense costs. Continuous claims feedback loops refine underwriting and risk control.
- Specialized TPAs
- Vendor panels: faster cycle, less leakage
- Litigation management
- Claims-to-underwriting feedback
Data, modeling, and technology providers
Data, modeling, and tech partners provide catastrophe models, telematics feeds, and third-party enrichment that sharpen pricing and selection; API-enabled platforms in 2024 streamline submissions and bind, reducing cycle time and friction. Fraud, credit, and geospatial tools raise portfolio quality and lower loss volatility, while vendor resilience and formal model validation are embedded in governance and audit trails.
- cat models: improved exposure granularity
- telematics: usage-driven pricing
- APIs: faster bind/submission
- fraud/geospatial: better risk selection
- governance: vendor resilience + model validation
Agents dominate distribution; reinsurers supply $600B capacity; MGAs power specialty growth
Independent agents drive virtually all RLI distribution per 2024 Form 10-K, delivering local market access and higher hit rates. Reinsurers provide capacity and volatility protection; global reinsurance capacity ≈ $600B in 2024. MGAs/Programs now account for ~25% of specialty distribution, accelerating niche growth. Tech/TPAs shorten cycle time, improve selection and claims outcomes.
| Partner | Role | 2024 Metric |
|---|---|---|
| Agents | Distribution | Virtually all business |
| Reinsurers | Capacity | $600B global capacity |
| MGAs | Program growth | ~25% specialty |
| TPAs/Tech | Claims & data | Faster bind/API adoption |
What is included in the product
Detailed Word Document
A comprehensive, pre-written RLI Business Model Canvas aligned to the company’s strategy and real-world operations, organized into the 9 classic BMC blocks with full narrative and insights. Includes customer segments, channels, value propositions, competitive advantages, SWOT-linked analysis, and a polished design ideal for presentations, investor funding discussions, and informed decision-making by entrepreneurs and analysts.
Customizable Excel Spreadsheet
Condenses company strategy into a digestible one-page canvas with editable cells, saving hours of setup while enabling quick comparison, team collaboration, and board-ready presentations.
Activities
Specialty underwriting and pricing
RLI evaluates niche risks using tailored forms and endorsements to match exposures to specialty coverages, leveraging its NYSE-listed specialty-insurer platform (ticker RLI). Actuarial models and underwriter judgment are combined to balance rate adequacy and competitiveness, with pricing refined using portfolio-level performance through 2024. File-and-use strategies accelerate speed to market in many jurisdictions, enabling faster deployment of new rates and forms. Ongoing monitoring adjusts appetite and limits by micro-segment based on loss emergence and frequency trends.
Claims management and loss control
Early triage and specialized adjusting cut claim costs by up to 30% and shorten cycle times, improving outcomes; proactive risk engineering lowers frequency and severity by roughly 15–40% in commercial lines. Targeted litigation and subrogation strategies recover about 8–12% of paid losses, protecting margins. Customer-first communication preserves relationships and supports retention rates above 90% during loss events.
Reinsurance program design
Treaty structures are calibrated in 2024 to keep earnings and capital volatility within board limits, using layered per-risk and aggregate treaties tied to modeled capital-at-risk. Facultative placements are used selectively for outlier exposures and large accounts. Collateral, wording, and counterparty credit are actively managed through credit triggers and collateral calls. Advanced analytics in 2024 drive retentions, cessions, and catastrophe aggregates.
Distribution and producer enablement
- Producer training: appetite, forms, quoting
- Portals & STP: >60% sector adoption (2024)
- Incentives & scorecards: align growth/profit
- Field underwriting & co-selling: deepen relationships
Regulatory, capital, and risk governance
Multi-state compliance and timely rate filings preserve RLI market access and product distribution across jurisdictions. ERM frameworks link declared risk appetite to capital allocation and reinsurance decisions. Ongoing engagement with rating agencies (A.M. Best A+ in 2024) supports perceived financial strength. Robust internal controls enforce reserving discipline and reporting integrity.
- Compliance: multi-state filings
- ERM: risk appetite → capital
- Ratings: A.M. Best A+ (2024)
- Controls: reserving & reporting
Niche insurer cuts claim costs 15–30%, severity 15–40% and recovers 8–12% - A+ strength
RLI underwrites niche risks with tailored forms and file-and-use speed, blending actuarial models and judgment to optimize pricing (2024 portfolio-led adjustments). Specialized claims triage, adjusting and engineering cut costs 15–30% and severity 15–40%, with subrogation recovering ~8–12% of paid losses. Reinsurance, ERM and multi-state filings sustain A.M. Best A+ strength and capital stability.
| Metric | 2024 |
|---|---|
| STP adoption | >60% |
| Claim cost cut | 15–30% |
| Risk engineering impact | 15–40% |
| Subrogation recoveries | 8–12% |
| Rating | A.M. Best A+ |
Delivered as Displayed
Business Model Canvas
The RLI Business Model Canvas you’re previewing is the actual deliverable, not a mockup or sample. When you purchase, you’ll receive this exact document—fully formatted and complete—with the same content, pages, and structure. It’s ready to edit, present, and apply with no surprises. Instant download and full access upon purchase.
Original: $10.00
-65%$10.00
$3.50Description
Unlock the strategic Business Model Canvas for insurance growth and investor insights
Unlock the full strategic blueprint behind RLI’s business model with our in-depth Business Model Canvas—three-plus years of industry-proven insights distilled into one actionable file. This concise, downloadable canvas breaks down value propositions, customer segments, revenue streams and cost structure to help investors, consultants, and founders make smarter decisions. Purchase the full Word/Excel kit to benchmark, plan, and scale with confidence.
Partnerships
Independent agents and brokers
Independent agents and brokers are RLI's primary distribution channel, with RLI stating in its 2024 Form 10-K that it places virtually all business through producers, enabling access to specialized risks. Local market knowledge and buyer intent from agents raise hit rates and risk fit, while SLAs and co-marketing boost producer loyalty. Continuous data feedback from agents refines underwriting appetite and improves loss selection over time.
Reinsurance and retrocession partners
Reinsurers supply capacity, volatility protection and capital efficiency, with global reinsurance capacity around $600 billion in 2024 enabling RLI to transfer peak losses. Structured treaties let RLI expand niche lines without outsized balance-sheet strain, while facultative placements cover unique, large or complex risks. Collaborative analytics align pricing, attachment points and catastrophe exposure to optimize return on capital.
MGAs and program administrators
Program partners expand RLI reach into micro-niches, leveraging distribution and domain expertise; by 2024 MGAs account for roughly a quarter of specialty distribution, accelerating access to targeted risks. Delegated underwriting authority speeds quoting while preserving RLI guidelines and margin control. Performance dashboards track loss ratios and premium growth by program in near real-time. Incentives and regular audits align partners on risk quality and regulatory compliance.
Claims, repair, and TPA ecosystem
Specialized TPAs, adjusters and repair networks sharpen claims outcomes by accelerating settlements, reducing severity and improving repair quality; vendor panels cut cycle time and leakage while boosting customer satisfaction. Litigation management partners limit catastrophic casualty exposures and defense costs. Continuous claims feedback loops refine underwriting and risk control.
- Specialized TPAs
- Vendor panels: faster cycle, less leakage
- Litigation management
- Claims-to-underwriting feedback
Data, modeling, and technology providers
Data, modeling, and tech partners provide catastrophe models, telematics feeds, and third-party enrichment that sharpen pricing and selection; API-enabled platforms in 2024 streamline submissions and bind, reducing cycle time and friction. Fraud, credit, and geospatial tools raise portfolio quality and lower loss volatility, while vendor resilience and formal model validation are embedded in governance and audit trails.
- cat models: improved exposure granularity
- telematics: usage-driven pricing
- APIs: faster bind/submission
- fraud/geospatial: better risk selection
- governance: vendor resilience + model validation
Agents dominate distribution; reinsurers supply $600B capacity; MGAs power specialty growth
Independent agents drive virtually all RLI distribution per 2024 Form 10-K, delivering local market access and higher hit rates. Reinsurers provide capacity and volatility protection; global reinsurance capacity ≈ $600B in 2024. MGAs/Programs now account for ~25% of specialty distribution, accelerating niche growth. Tech/TPAs shorten cycle time, improve selection and claims outcomes.
| Partner | Role | 2024 Metric |
|---|---|---|
| Agents | Distribution | Virtually all business |
| Reinsurers | Capacity | $600B global capacity |
| MGAs | Program growth | ~25% specialty |
| TPAs/Tech | Claims & data | Faster bind/API adoption |
What is included in the product
Detailed Word Document
A comprehensive, pre-written RLI Business Model Canvas aligned to the company’s strategy and real-world operations, organized into the 9 classic BMC blocks with full narrative and insights. Includes customer segments, channels, value propositions, competitive advantages, SWOT-linked analysis, and a polished design ideal for presentations, investor funding discussions, and informed decision-making by entrepreneurs and analysts.
Customizable Excel Spreadsheet
Condenses company strategy into a digestible one-page canvas with editable cells, saving hours of setup while enabling quick comparison, team collaboration, and board-ready presentations.
Activities
Specialty underwriting and pricing
RLI evaluates niche risks using tailored forms and endorsements to match exposures to specialty coverages, leveraging its NYSE-listed specialty-insurer platform (ticker RLI). Actuarial models and underwriter judgment are combined to balance rate adequacy and competitiveness, with pricing refined using portfolio-level performance through 2024. File-and-use strategies accelerate speed to market in many jurisdictions, enabling faster deployment of new rates and forms. Ongoing monitoring adjusts appetite and limits by micro-segment based on loss emergence and frequency trends.
Claims management and loss control
Early triage and specialized adjusting cut claim costs by up to 30% and shorten cycle times, improving outcomes; proactive risk engineering lowers frequency and severity by roughly 15–40% in commercial lines. Targeted litigation and subrogation strategies recover about 8–12% of paid losses, protecting margins. Customer-first communication preserves relationships and supports retention rates above 90% during loss events.
Reinsurance program design
Treaty structures are calibrated in 2024 to keep earnings and capital volatility within board limits, using layered per-risk and aggregate treaties tied to modeled capital-at-risk. Facultative placements are used selectively for outlier exposures and large accounts. Collateral, wording, and counterparty credit are actively managed through credit triggers and collateral calls. Advanced analytics in 2024 drive retentions, cessions, and catastrophe aggregates.
Distribution and producer enablement
- Producer training: appetite, forms, quoting
- Portals & STP: >60% sector adoption (2024)
- Incentives & scorecards: align growth/profit
- Field underwriting & co-selling: deepen relationships
Regulatory, capital, and risk governance
Multi-state compliance and timely rate filings preserve RLI market access and product distribution across jurisdictions. ERM frameworks link declared risk appetite to capital allocation and reinsurance decisions. Ongoing engagement with rating agencies (A.M. Best A+ in 2024) supports perceived financial strength. Robust internal controls enforce reserving discipline and reporting integrity.
- Compliance: multi-state filings
- ERM: risk appetite → capital
- Ratings: A.M. Best A+ (2024)
- Controls: reserving & reporting
Niche insurer cuts claim costs 15–30%, severity 15–40% and recovers 8–12% - A+ strength
RLI underwrites niche risks with tailored forms and file-and-use speed, blending actuarial models and judgment to optimize pricing (2024 portfolio-led adjustments). Specialized claims triage, adjusting and engineering cut costs 15–30% and severity 15–40%, with subrogation recovering ~8–12% of paid losses. Reinsurance, ERM and multi-state filings sustain A.M. Best A+ strength and capital stability.
| Metric | 2024 |
|---|---|
| STP adoption | >60% |
| Claim cost cut | 15–30% |
| Risk engineering impact | 15–40% |
| Subrogation recoveries | 8–12% |
| Rating | A.M. Best A+ |
Delivered as Displayed
Business Model Canvas
The RLI Business Model Canvas you’re previewing is the actual deliverable, not a mockup or sample. When you purchase, you’ll receive this exact document—fully formatted and complete—with the same content, pages, and structure. It’s ready to edit, present, and apply with no surprises. Instant download and full access upon purchase.











