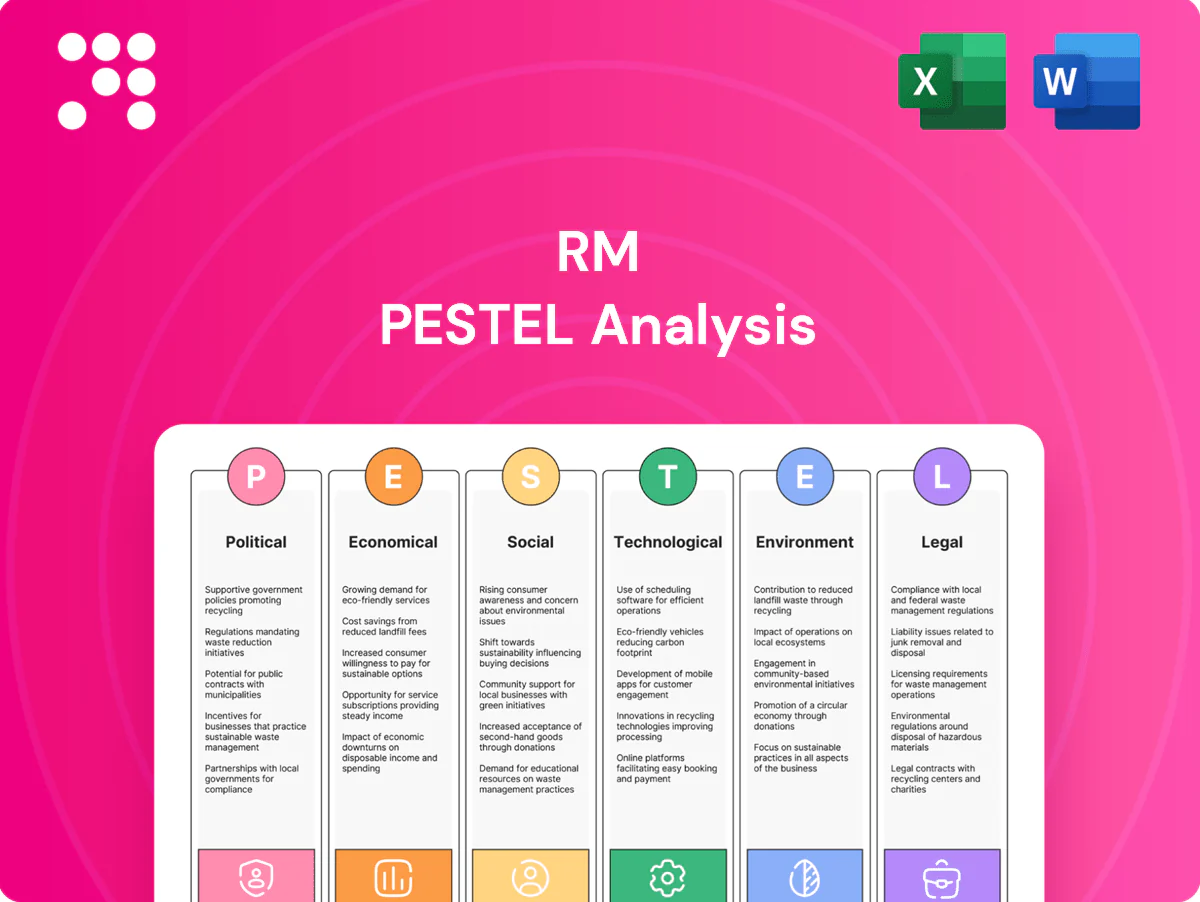
RM PESTLE Analysis

Your Shortcut to Market Insight Starts Here
Unlock strategic advantage with our RM PESTLE Analysis—three-dimensional insights into political, economic, social, technological, legal, and environmental forces shaping RM’s future. Perfect for investors and strategists, it translates trends into actionable risks and opportunities. Buy the full report now for the detailed breakdown and ready-to-use recommendations.
Political factors

Education funding policy
Government school budgets and pupil premium allocations — for 2024–25 set at about £1,455 per primary eligible pupil and £1,035 per secondary eligible pupil — directly determine IT spend and procurement cycles for RM. Post‑election funding shifts can accelerate capital IT programmes or impose freezes, impacting phasing of rollout and revenue timing. RM must align product roadmaps to policy priorities to win multi‑year contracts and engage in DfE consultations to anticipate demand swings and tender windows.
Curriculum and standards
Changes to curriculum, assessments, or digital literacy standards—computing has been statutory in England since 2014—drive demand for compliant software and shape school procurement. Central directives on computing and STEM influence approved vendor lists and budgets. RM should map products to evolving frameworks to remain a preferred supplier. Early compliance can create a first-mover advantage in tender processes.

Public procurement rules
Frameworks and tender rules (value-for-money, social value) govern supplier selection, with public procurement representing about 12% of GDP in OECD countries and accounting for over $3 trillion annually. Transparent pricing and measurable outcomes are essential to meet audit and scoring criteria. RM must optimize bids regionally to maximize scorecard points. Strong public-sector references materially increase tender win rates.

Digital inclusion agendas
Government digital inclusion agendas fund devices, connectivity and platforms to close learning gaps; priority areas and disadvantaged-school grant streams can unlock targeted procurement opportunities, and RM can package solutions to meet inclusion KPIs while demonstrating measurable impact on attainment to strengthen policy alignment.
- policy: align offers to grant criteria
- targets: design for disadvantaged schools
- evidence: link deployments to attainment
International education policy
International education exports hinge on local ed-tech strategies and import rules; OECD data show roughly 5.6 million cross-border tertiary students in 2022, highlighting market scale and policy sensitivity. Accreditation and local hosting rules differ by country, forcing RM to localize curricula and data hosting to meet national requirements and avoid restrictions. Strategic partnerships with ministries can de-risk entry and speed approvals.
- Export dependence: align with national ed-tech strategies
- Accreditation: adapt to country-specific rules
- Localization: curriculum and data hosting compliance
- Partnerships: ministries reduce regulatory risk
DfE funding, 12% GDP procurement time RM IT; 5.6m students push localization
DfE funding (pupil premium £1,455 primary / £1,035 secondary 2024–25) and post‑election capital shifts dictate RM IT spend timing; alignment to policy secures multi‑year contracts. Public procurement (~12% GDP; >$3tn annually) favors measurable social value and transparent pricing. International demand (≈5.6m cross‑border tertiary students 2022) requires localization and accredited hosting to enter markets.
| Factor | Metric | Implication |
|---|---|---|
| Funding | £1,455/£1,035 | Timing, product roadmap |
| Procurement | ~12% GDP / $3tn | Scorecards, social value |
| Exports | 5.6m students | Localization, accreditation |
What is included in the product
 Detailed Word Document
Explores how macro-environmental factors uniquely affect the RM across Political, Economic, Social, Technological, Environmental and Legal dimensions, with each category expanded into detailed, business-specific subpoints and data-backed trends. Designed for executives, advisors and investors, the analysis delivers forward-looking insights to identify risks, opportunities and actionable scenarios aligned to regional market and regulatory realities.

 Customizable Excel Spreadsheet
RM PESTLE Analysis delivers a concise, visually segmented summary of external factors that can be dropped into presentations, easily shared across teams, and annotated for local context—helping speed alignment and support risk discussions during planning.
Economic factors

School budget cycles
Annual and multi-year school budgets create clear seasonal demand peaks around district fiscal year-ends (most run July–June) and school starts; US public K–12 serves about 50.8 million students (2023–24). Delays or mid-year cuts frequently defer orders and capex. RM should align sales cadence and financing offers to fiscal calendars. Deferred-revenue models like leasing or subscriptions convert lumpy purchases into predictable cashflow.
Inflation and FX
Component and labor inflation are raising delivery costs, forcing RM pricing decisions as US federal funds rates sat at 5.25–5.50% in 2024, tightening input-cost pass-through. FX swings alter import bills and margins when the USD rallies, so pricing must balance affordability with margin protection. Hedging and cost-engineering lower volatility exposure. Transparent indexation clauses sustain long-term contracts.

Hardware refresh demand
Enterprise hardware refresh cycles average 3–5 years, driving periodic spikes in device spend and creating predictable windows for RM sales; global IT spending reached roughly $4.5 trillion in 2024, amplifying upgrade opportunities. Total cost of ownership frequently tips decisions toward repair, lease, or buy, so RM lifecycle services can capture recurring revenue and improve margins. Trade-in programs that recover 10–25% of device value can unlock constrained budgets and accelerate refresh conversions.

Cloud cost dynamics
Rising hyperscaler fees squeeze SaaS margins and push school IT bills higher as public cloud spend rose ~20% in 2024 and AWS/Azure/GCP held ~65% of infrastructure spend; efficient architecture and reserved capacity (savings up to 70%) lower unit costs. RM can tier features to match tight school budgets, and clear ROI proof points materially support renewals.
- hyperscaler_share_2024: ~65%
- cloud_spend_growth_2024: ~20%
- reserved_savings: up to 70%
- tiering: aligns to constrained school budgets
- ROI: increases renewal propensity
Macroeconomic downturn risk
Macroeconomic downturns compress public finances and push discretionary IT projects to the chopping block; IMF projected global GDP growth at about 3.2% in 2024, tightening budgets across markets. RM should present digital tooling as efficiency enablers with quantifiable cost savings and learning outcomes—Gartner estimated global IT spend near 5.5 trillion USD in 2024, showing room for prioritized investments. Diversifying regionally cushions localized cuts by spreading fiscal risk and preserving revenue streams.
- Emphasize ROI: cost-per-user, payback months
- Highlight learning impact: adoption and productivity metrics
- Regional diversification: reduce exposure to single-market fiscal cuts
DfE funding, 12% GDP procurement time RM IT; 5.6m students push localization
School fiscal cycles (US K–12 ~50.8M students 2023–24) create seasonal demand; leasing/subscriptions smooth cashflow. Input inflation and 2024 US fed funds at 5.25–5.50% pressure pricing; hedging and indexation protect margins. Enterprise refreshes (3–5y) plus $4.5T global IT spend (2024) and 20% cloud growth create repeat-opportunity windows.
| Metric | 2024 |
|---|---|
| US K–12 students | 50.8M |
| Global IT spend | $4.5T |
| Cloud spend growth | +20% |
| Hyperscaler share | ~65% |
Preview the Actual Deliverable
RM PESTLE Analysis
The preview shown here is the exact RM PESTLE Analysis document you’ll receive after purchase—fully formatted and ready to use. The layout, content, and structure visible are identical to the downloadable file. No placeholders or extras; this is the final, professional report.

Your Shortcut to Market Insight Starts Here
Unlock strategic advantage with our RM PESTLE Analysis—three-dimensional insights into political, economic, social, technological, legal, and environmental forces shaping RM’s future. Perfect for investors and strategists, it translates trends into actionable risks and opportunities. Buy the full report now for the detailed breakdown and ready-to-use recommendations.
Political factors
Education funding policy
Government school budgets and pupil premium allocations — for 2024–25 set at about £1,455 per primary eligible pupil and £1,035 per secondary eligible pupil — directly determine IT spend and procurement cycles for RM. Post‑election funding shifts can accelerate capital IT programmes or impose freezes, impacting phasing of rollout and revenue timing. RM must align product roadmaps to policy priorities to win multi‑year contracts and engage in DfE consultations to anticipate demand swings and tender windows.
Curriculum and standards
Changes to curriculum, assessments, or digital literacy standards—computing has been statutory in England since 2014—drive demand for compliant software and shape school procurement. Central directives on computing and STEM influence approved vendor lists and budgets. RM should map products to evolving frameworks to remain a preferred supplier. Early compliance can create a first-mover advantage in tender processes.
Public procurement rules
Frameworks and tender rules (value-for-money, social value) govern supplier selection, with public procurement representing about 12% of GDP in OECD countries and accounting for over $3 trillion annually. Transparent pricing and measurable outcomes are essential to meet audit and scoring criteria. RM must optimize bids regionally to maximize scorecard points. Strong public-sector references materially increase tender win rates.
Digital inclusion agendas
Government digital inclusion agendas fund devices, connectivity and platforms to close learning gaps; priority areas and disadvantaged-school grant streams can unlock targeted procurement opportunities, and RM can package solutions to meet inclusion KPIs while demonstrating measurable impact on attainment to strengthen policy alignment.
- policy: align offers to grant criteria
- targets: design for disadvantaged schools
- evidence: link deployments to attainment
International education policy
International education exports hinge on local ed-tech strategies and import rules; OECD data show roughly 5.6 million cross-border tertiary students in 2022, highlighting market scale and policy sensitivity. Accreditation and local hosting rules differ by country, forcing RM to localize curricula and data hosting to meet national requirements and avoid restrictions. Strategic partnerships with ministries can de-risk entry and speed approvals.
- Export dependence: align with national ed-tech strategies
- Accreditation: adapt to country-specific rules
- Localization: curriculum and data hosting compliance
- Partnerships: ministries reduce regulatory risk
DfE funding, 12% GDP procurement time RM IT; 5.6m students push localization
DfE funding (pupil premium £1,455 primary / £1,035 secondary 2024–25) and post‑election capital shifts dictate RM IT spend timing; alignment to policy secures multi‑year contracts. Public procurement (~12% GDP; >$3tn annually) favors measurable social value and transparent pricing. International demand (≈5.6m cross‑border tertiary students 2022) requires localization and accredited hosting to enter markets.
| Factor | Metric | Implication |
|---|---|---|
| Funding | £1,455/£1,035 | Timing, product roadmap |
| Procurement | ~12% GDP / $3tn | Scorecards, social value |
| Exports | 5.6m students | Localization, accreditation |
What is included in the product
Detailed Word Document
Explores how macro-environmental factors uniquely affect the RM across Political, Economic, Social, Technological, Environmental and Legal dimensions, with each category expanded into detailed, business-specific subpoints and data-backed trends. Designed for executives, advisors and investors, the analysis delivers forward-looking insights to identify risks, opportunities and actionable scenarios aligned to regional market and regulatory realities.
Customizable Excel Spreadsheet
RM PESTLE Analysis delivers a concise, visually segmented summary of external factors that can be dropped into presentations, easily shared across teams, and annotated for local context—helping speed alignment and support risk discussions during planning.
Economic factors
School budget cycles
Annual and multi-year school budgets create clear seasonal demand peaks around district fiscal year-ends (most run July–June) and school starts; US public K–12 serves about 50.8 million students (2023–24). Delays or mid-year cuts frequently defer orders and capex. RM should align sales cadence and financing offers to fiscal calendars. Deferred-revenue models like leasing or subscriptions convert lumpy purchases into predictable cashflow.
Inflation and FX
Component and labor inflation are raising delivery costs, forcing RM pricing decisions as US federal funds rates sat at 5.25–5.50% in 2024, tightening input-cost pass-through. FX swings alter import bills and margins when the USD rallies, so pricing must balance affordability with margin protection. Hedging and cost-engineering lower volatility exposure. Transparent indexation clauses sustain long-term contracts.
Hardware refresh demand
Enterprise hardware refresh cycles average 3–5 years, driving periodic spikes in device spend and creating predictable windows for RM sales; global IT spending reached roughly $4.5 trillion in 2024, amplifying upgrade opportunities. Total cost of ownership frequently tips decisions toward repair, lease, or buy, so RM lifecycle services can capture recurring revenue and improve margins. Trade-in programs that recover 10–25% of device value can unlock constrained budgets and accelerate refresh conversions.
Cloud cost dynamics
Rising hyperscaler fees squeeze SaaS margins and push school IT bills higher as public cloud spend rose ~20% in 2024 and AWS/Azure/GCP held ~65% of infrastructure spend; efficient architecture and reserved capacity (savings up to 70%) lower unit costs. RM can tier features to match tight school budgets, and clear ROI proof points materially support renewals.
- hyperscaler_share_2024: ~65%
- cloud_spend_growth_2024: ~20%
- reserved_savings: up to 70%
- tiering: aligns to constrained school budgets
- ROI: increases renewal propensity
Macroeconomic downturn risk
Macroeconomic downturns compress public finances and push discretionary IT projects to the chopping block; IMF projected global GDP growth at about 3.2% in 2024, tightening budgets across markets. RM should present digital tooling as efficiency enablers with quantifiable cost savings and learning outcomes—Gartner estimated global IT spend near 5.5 trillion USD in 2024, showing room for prioritized investments. Diversifying regionally cushions localized cuts by spreading fiscal risk and preserving revenue streams.
- Emphasize ROI: cost-per-user, payback months
- Highlight learning impact: adoption and productivity metrics
- Regional diversification: reduce exposure to single-market fiscal cuts
DfE funding, 12% GDP procurement time RM IT; 5.6m students push localization
School fiscal cycles (US K–12 ~50.8M students 2023–24) create seasonal demand; leasing/subscriptions smooth cashflow. Input inflation and 2024 US fed funds at 5.25–5.50% pressure pricing; hedging and indexation protect margins. Enterprise refreshes (3–5y) plus $4.5T global IT spend (2024) and 20% cloud growth create repeat-opportunity windows.
| Metric | 2024 |
|---|---|
| US K–12 students | 50.8M |
| Global IT spend | $4.5T |
| Cloud spend growth | +20% |
| Hyperscaler share | ~65% |
Preview the Actual Deliverable
RM PESTLE Analysis
The preview shown here is the exact RM PESTLE Analysis document you’ll receive after purchase—fully formatted and ready to use. The layout, content, and structure visible are identical to the downloadable file. No placeholders or extras; this is the final, professional report.
Original: $10.00
-65%$10.00
$3.50Description
Your Shortcut to Market Insight Starts Here
Unlock strategic advantage with our RM PESTLE Analysis—three-dimensional insights into political, economic, social, technological, legal, and environmental forces shaping RM’s future. Perfect for investors and strategists, it translates trends into actionable risks and opportunities. Buy the full report now for the detailed breakdown and ready-to-use recommendations.
Political factors
Education funding policy
Government school budgets and pupil premium allocations — for 2024–25 set at about £1,455 per primary eligible pupil and £1,035 per secondary eligible pupil — directly determine IT spend and procurement cycles for RM. Post‑election funding shifts can accelerate capital IT programmes or impose freezes, impacting phasing of rollout and revenue timing. RM must align product roadmaps to policy priorities to win multi‑year contracts and engage in DfE consultations to anticipate demand swings and tender windows.
Curriculum and standards
Changes to curriculum, assessments, or digital literacy standards—computing has been statutory in England since 2014—drive demand for compliant software and shape school procurement. Central directives on computing and STEM influence approved vendor lists and budgets. RM should map products to evolving frameworks to remain a preferred supplier. Early compliance can create a first-mover advantage in tender processes.
Public procurement rules
Frameworks and tender rules (value-for-money, social value) govern supplier selection, with public procurement representing about 12% of GDP in OECD countries and accounting for over $3 trillion annually. Transparent pricing and measurable outcomes are essential to meet audit and scoring criteria. RM must optimize bids regionally to maximize scorecard points. Strong public-sector references materially increase tender win rates.
Digital inclusion agendas
Government digital inclusion agendas fund devices, connectivity and platforms to close learning gaps; priority areas and disadvantaged-school grant streams can unlock targeted procurement opportunities, and RM can package solutions to meet inclusion KPIs while demonstrating measurable impact on attainment to strengthen policy alignment.
- policy: align offers to grant criteria
- targets: design for disadvantaged schools
- evidence: link deployments to attainment
International education policy
International education exports hinge on local ed-tech strategies and import rules; OECD data show roughly 5.6 million cross-border tertiary students in 2022, highlighting market scale and policy sensitivity. Accreditation and local hosting rules differ by country, forcing RM to localize curricula and data hosting to meet national requirements and avoid restrictions. Strategic partnerships with ministries can de-risk entry and speed approvals.
- Export dependence: align with national ed-tech strategies
- Accreditation: adapt to country-specific rules
- Localization: curriculum and data hosting compliance
- Partnerships: ministries reduce regulatory risk
DfE funding, 12% GDP procurement time RM IT; 5.6m students push localization
DfE funding (pupil premium £1,455 primary / £1,035 secondary 2024–25) and post‑election capital shifts dictate RM IT spend timing; alignment to policy secures multi‑year contracts. Public procurement (~12% GDP; >$3tn annually) favors measurable social value and transparent pricing. International demand (≈5.6m cross‑border tertiary students 2022) requires localization and accredited hosting to enter markets.
| Factor | Metric | Implication |
|---|---|---|
| Funding | £1,455/£1,035 | Timing, product roadmap |
| Procurement | ~12% GDP / $3tn | Scorecards, social value |
| Exports | 5.6m students | Localization, accreditation |
What is included in the product
Detailed Word Document
Explores how macro-environmental factors uniquely affect the RM across Political, Economic, Social, Technological, Environmental and Legal dimensions, with each category expanded into detailed, business-specific subpoints and data-backed trends. Designed for executives, advisors and investors, the analysis delivers forward-looking insights to identify risks, opportunities and actionable scenarios aligned to regional market and regulatory realities.
Customizable Excel Spreadsheet
RM PESTLE Analysis delivers a concise, visually segmented summary of external factors that can be dropped into presentations, easily shared across teams, and annotated for local context—helping speed alignment and support risk discussions during planning.
Economic factors
School budget cycles
Annual and multi-year school budgets create clear seasonal demand peaks around district fiscal year-ends (most run July–June) and school starts; US public K–12 serves about 50.8 million students (2023–24). Delays or mid-year cuts frequently defer orders and capex. RM should align sales cadence and financing offers to fiscal calendars. Deferred-revenue models like leasing or subscriptions convert lumpy purchases into predictable cashflow.
Inflation and FX
Component and labor inflation are raising delivery costs, forcing RM pricing decisions as US federal funds rates sat at 5.25–5.50% in 2024, tightening input-cost pass-through. FX swings alter import bills and margins when the USD rallies, so pricing must balance affordability with margin protection. Hedging and cost-engineering lower volatility exposure. Transparent indexation clauses sustain long-term contracts.
Hardware refresh demand
Enterprise hardware refresh cycles average 3–5 years, driving periodic spikes in device spend and creating predictable windows for RM sales; global IT spending reached roughly $4.5 trillion in 2024, amplifying upgrade opportunities. Total cost of ownership frequently tips decisions toward repair, lease, or buy, so RM lifecycle services can capture recurring revenue and improve margins. Trade-in programs that recover 10–25% of device value can unlock constrained budgets and accelerate refresh conversions.
Cloud cost dynamics
Rising hyperscaler fees squeeze SaaS margins and push school IT bills higher as public cloud spend rose ~20% in 2024 and AWS/Azure/GCP held ~65% of infrastructure spend; efficient architecture and reserved capacity (savings up to 70%) lower unit costs. RM can tier features to match tight school budgets, and clear ROI proof points materially support renewals.
- hyperscaler_share_2024: ~65%
- cloud_spend_growth_2024: ~20%
- reserved_savings: up to 70%
- tiering: aligns to constrained school budgets
- ROI: increases renewal propensity
Macroeconomic downturn risk
Macroeconomic downturns compress public finances and push discretionary IT projects to the chopping block; IMF projected global GDP growth at about 3.2% in 2024, tightening budgets across markets. RM should present digital tooling as efficiency enablers with quantifiable cost savings and learning outcomes—Gartner estimated global IT spend near 5.5 trillion USD in 2024, showing room for prioritized investments. Diversifying regionally cushions localized cuts by spreading fiscal risk and preserving revenue streams.
- Emphasize ROI: cost-per-user, payback months
- Highlight learning impact: adoption and productivity metrics
- Regional diversification: reduce exposure to single-market fiscal cuts
DfE funding, 12% GDP procurement time RM IT; 5.6m students push localization
School fiscal cycles (US K–12 ~50.8M students 2023–24) create seasonal demand; leasing/subscriptions smooth cashflow. Input inflation and 2024 US fed funds at 5.25–5.50% pressure pricing; hedging and indexation protect margins. Enterprise refreshes (3–5y) plus $4.5T global IT spend (2024) and 20% cloud growth create repeat-opportunity windows.
| Metric | 2024 |
|---|---|
| US K–12 students | 50.8M |
| Global IT spend | $4.5T |
| Cloud spend growth | +20% |
| Hyperscaler share | ~65% |
Preview the Actual Deliverable
RM PESTLE Analysis
The preview shown here is the exact RM PESTLE Analysis document you’ll receive after purchase—fully formatted and ready to use. The layout, content, and structure visible are identical to the downloadable file. No placeholders or extras; this is the final, professional report.











