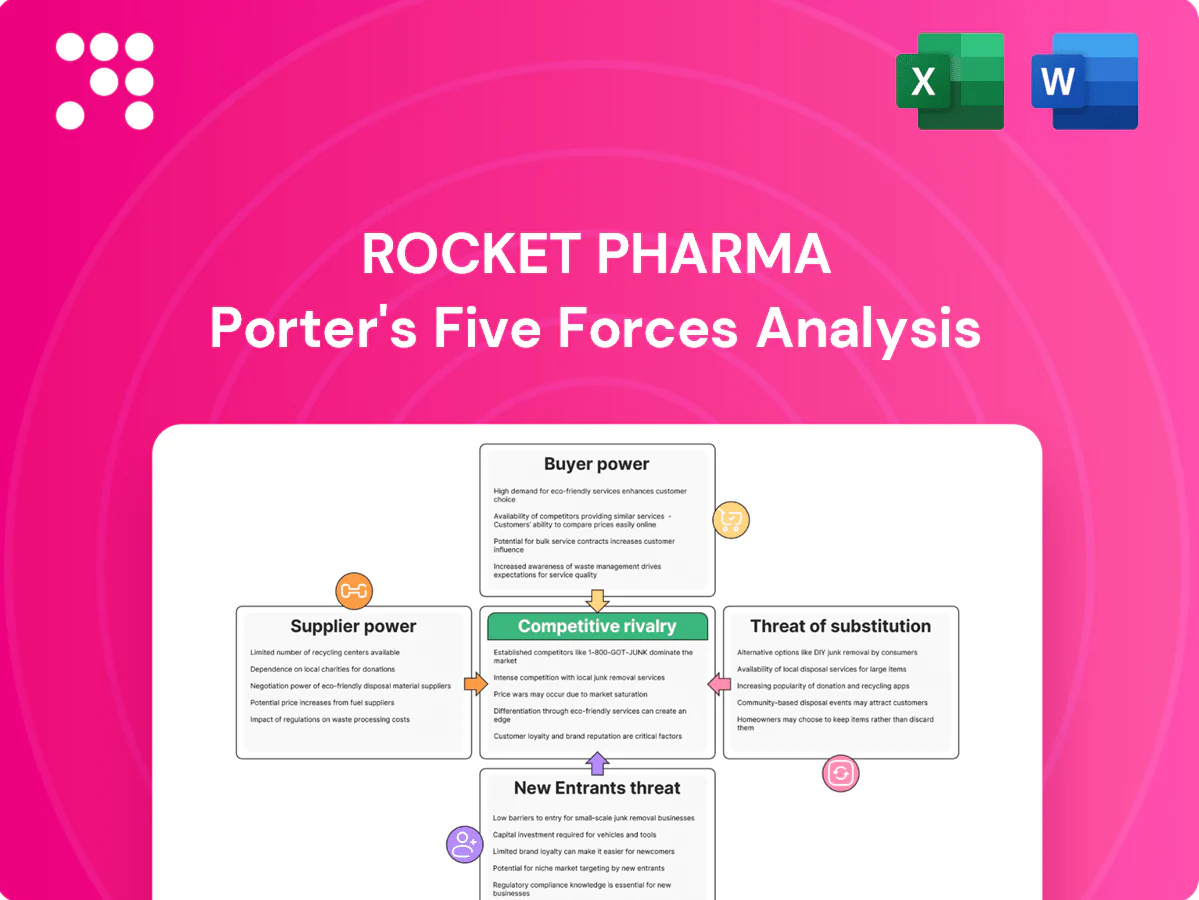
Rocket Pharma Porter's Five Forces Analysis

Don't Miss the Bigger Picture
Rocket Pharma faces high rivalry among biotech peers, niche gene-therapy pipelines with strong IP reduce substitute threats, and supplier power is moderate due to specialized manufacturing; buyer power is limited but regulatory risk and capital intensity raise barriers. This brief snapshot only scratches the surface. Unlock the full Porter's Five Forces Analysis to explore Rocket Pharma’s competitive dynamics, market pressures, and strategic advantages in detail.
Suppliers Bargaining Power

Concentrated vector CDMOs
LVV and AAV manufacturing capacity resides with a handful of specialized CDMOs (Catalent, Lonza, Thermo Fisher, WuXi, AGC), concentrating leverage. Tech transfers typically take 9–18 months and validation runs often cost six figures, making switching costly and risky. Suppliers routinely prioritize larger or higher-margin programs, tightening available slots. This elevates pricing power and stricter delivery terms over clinical-stage sponsors.
GMP-critical inputs
GMP plasmids, producer cell lines, resins and high‑grade reagents have few qualified sources—industry estimates in 2024 show >60% of GMP plasmid capacity concentrated in the top five suppliers. Lead times are lengthy (plasmids 12–24 weeks, specialty resins 20–36 weeks) and dual‑sourcing is hard due to comparability needs. Any quality deviation can trigger batch loss costing millions and postpone trials by months. Suppliers commonly enforce MOQs and annual escalation clauses given these stakes.

Specialized equipment/assays
Bioreactors (capital cost $0.1–5M) and chromatography skids ($0.2–2M) plus ddPCR/NGS platforms ($50k–1M) are capital-intensive and vendor-tied, with method transfer and assay validation effectively locking in platforms. Service contracts often run 10–20% of equipment cost annually and limited spare parts create dependencies; vendors push bundled pricing and upgrade cycles that can raise TCO by ~15–30% (2024 data).

IP/licensing dependencies
Access to AAV capsids, promoters and LVV parts often requires licenses with royalties (commonly 3–8%) and milestone schedules; 2024 deal trends show upfronts around $30–80M and milestones up to $100–200M, increasing sponsor cash needs. Late freedom-to-operate reviews can surface blocking IP, shifting leverage to licensors and prompting royalty stacking that can erode margins by several percentage points as programs advance. Negotiating carve-outs or field limits adds legal complexity and incremental cost, often delaying trials and increasing spend.
- Royalty ranges: 3–8%
- Upfronts (2024 median): $30–80M
- Milestones: $10–200M+
- Margin compression: several percentage points
Specialist talent scarcity
Experienced CMC, QC, QA and regulatory gene‑therapy experts remain scarce; specialized recruiters and consulting firms commonly charge placement fees of 20–30% of first‑year salary and premium consulting rates, allowing them to demand restrictive terms. Hiring delays frequently extend scale‑up and regulatory filing timelines, creating a human‑capital bottleneck that strengthens supplier bargaining power.
- Placement fees: 20–30%
- Consulting premiums: above market rates
- Result: delayed scale‑up and filings
CDMO concentration and >60% GMP share squeeze cash and margins
Suppliers hold high leverage: CDMO and GMP input concentration raises switching costs and slot prioritization, pushing pricing and strict terms. IP licenses and royalties (2024 upfronts $30–80M, royalties 3–8%) increase cash needs and margin risk. Skilled CMC/QC talent scarcity and capital‑intensive equipment deepen dependency and delay scale‑up.
| Metric | 2024 Value |
|---|---|
| GMP plasmid share top5 | >60% |
| Upfronts (median) | $30–80M |
| Royalties | 3–8% |
| Placement fees | 20–30% |
What is included in the product
 Detailed Word Document
Uncovers key drivers of competition, customer influence, supplier power, substitutes, and market entry risks tailored to Rocket Pharma’s rare-disease gene therapy focus. Identifies disruptive threats, regulatory barriers, and strategic levers to protect market position and inform investor or internal strategy materials.

 Customizable Excel Spreadsheet
A concise Rocket Pharma Porter's Five Forces one-sheet that instantly maps competitive pressures with an editable spider chart and customizable scores—perfect for board decks and quick strategic decisions.
Customers Bargaining Power

Payers as gatekeepers
Payers and HTA bodies act as gatekeepers for high-cost one-time therapies, demanding robust durability, safety and real-world evidence before reimbursement; many gene therapies carry list prices above $1M (eg Zolgensma ~2.1M). Outcomes-based contracts and annuities increasingly shift performance and payment risk back to manufacturers. Consolidation of payers and three PBMs controlling roughly 80% of US pharmacy claims amplifies negotiating leverage.
Centers of excellence
Limited qualified treatment sites concentrate purchasing influence, pressuring Rocket Pharma (NASDAQ RCKT) to prioritize partners with seamless supply chains and robust patient-support programs. Site capacity constraints drive selectivity on product adoption, making center-level buy-in critical. These centers’ clinical experiences directly shape payer coverage decisions and inclusion in clinical guidelines, amplifying their bargaining power.

Small patient pools
Small patient pools concentrate decision-making: WHO estimates ~300 million people live with rare diseases worldwide and in the US a rare disease is defined as affecting fewer than 200,000 individuals, shrinking aggregate buyer numbers but heightening case-by-case scrutiny. Individual patients typically lack price leverage while payers demand rigorous prior authorization and real-world evidence. Any adverse event can prompt widescale policy change across an indication, so precise patient selection is a prerequisite for access.

Regulatory and evidence demands
Buyers demand validated endpoints, long-term follow-up and comparative effectiveness where feasible; regulators (FDA in 2024) often require up to 15 years of post‑marketing follow‑up for certain gene therapies. Manufacturing consistency and robust CMC data are assessed as part of value, and payers commonly demand registries and post‑marketing commitments that increase launch costs. Evidence gaps routinely translate into restricted coverage, outcomes‑based contracts or rebates.
- 2024 FDA: up to 15‑year LTFU for some gene therapies
- Registries/post‑marketing studies: common payer requirement raising program costs
- Evidence gaps → coverage with evidence development, restricted access, or rebate arrangements
Public and policy pressure
High upfront prices for gene therapies draw political and media scrutiny, strengthening payer leverage as US Medicare negotiation authority from the Inflation Reduction Act is active and global HTA bodies press value-based pricing. Reference pricing, budget caps and value frameworks (eg NICE ~20,000–30,000 GBP/QALY) constrain negotiations. Orphan incentives remain (US 7-year exclusivity; EU 10 years) but face periodic policy review, and stakeholder optics often force price concessions or risk-sharing.
- Political scrutiny strengthens payers
- Reference pricing and caps limit negotiation
- Value thresholds (NICE ~20–30k GBP/QALY)
- Orphan exclusivity: US 7y, EU 10y
- Public optics drive concessions/risk-share
Payers and HTAs demand robust RWE as >$1M gene therapies face PBM concentration and 15y LTFU
Payers/PBMs (3 PBMs ≈80% US claims) plus HTAs demand robust RWE; many gene therapies price >$1M (Zolgensma ~$2.1M).
Limited treatment sites and small patient pools (US rare <200k) concentrate buyer power, driving prior auth, registries and site selectivity.
FDA may require up to 15‑year LTFU; NICE ~£20–30k/QALY; value frameworks push outcomes‑based contracts.
| Metric | Value |
|---|---|
| PBM concentration | 3 PBMs ≈80% |
| Gene therapy price | >$1M (Zolgensma ~$2.1M) |
| US rare definition | <200k |
| FDA LTFU | up to 15y |
| NICE threshold | £20–30k/QALY |
Preview Before You Purchase
Rocket Pharma Porter's Five Forces Analysis
This preview shows the exact Rocket Pharma Porter's Five Forces analysis you'll receive—fully formatted and ready for use. No mockups or samples: the file available after purchase is identical to this preview and downloadable instantly. Use it immediately for competitive strategy, valuation context, and decision-making.

Don't Miss the Bigger Picture
Rocket Pharma faces high rivalry among biotech peers, niche gene-therapy pipelines with strong IP reduce substitute threats, and supplier power is moderate due to specialized manufacturing; buyer power is limited but regulatory risk and capital intensity raise barriers. This brief snapshot only scratches the surface. Unlock the full Porter's Five Forces Analysis to explore Rocket Pharma’s competitive dynamics, market pressures, and strategic advantages in detail.
Suppliers Bargaining Power
Concentrated vector CDMOs
LVV and AAV manufacturing capacity resides with a handful of specialized CDMOs (Catalent, Lonza, Thermo Fisher, WuXi, AGC), concentrating leverage. Tech transfers typically take 9–18 months and validation runs often cost six figures, making switching costly and risky. Suppliers routinely prioritize larger or higher-margin programs, tightening available slots. This elevates pricing power and stricter delivery terms over clinical-stage sponsors.
GMP-critical inputs
GMP plasmids, producer cell lines, resins and high‑grade reagents have few qualified sources—industry estimates in 2024 show >60% of GMP plasmid capacity concentrated in the top five suppliers. Lead times are lengthy (plasmids 12–24 weeks, specialty resins 20–36 weeks) and dual‑sourcing is hard due to comparability needs. Any quality deviation can trigger batch loss costing millions and postpone trials by months. Suppliers commonly enforce MOQs and annual escalation clauses given these stakes.
Specialized equipment/assays
Bioreactors (capital cost $0.1–5M) and chromatography skids ($0.2–2M) plus ddPCR/NGS platforms ($50k–1M) are capital-intensive and vendor-tied, with method transfer and assay validation effectively locking in platforms. Service contracts often run 10–20% of equipment cost annually and limited spare parts create dependencies; vendors push bundled pricing and upgrade cycles that can raise TCO by ~15–30% (2024 data).
IP/licensing dependencies
Access to AAV capsids, promoters and LVV parts often requires licenses with royalties (commonly 3–8%) and milestone schedules; 2024 deal trends show upfronts around $30–80M and milestones up to $100–200M, increasing sponsor cash needs. Late freedom-to-operate reviews can surface blocking IP, shifting leverage to licensors and prompting royalty stacking that can erode margins by several percentage points as programs advance. Negotiating carve-outs or field limits adds legal complexity and incremental cost, often delaying trials and increasing spend.
- Royalty ranges: 3–8%
- Upfronts (2024 median): $30–80M
- Milestones: $10–200M+
- Margin compression: several percentage points
Specialist talent scarcity
Experienced CMC, QC, QA and regulatory gene‑therapy experts remain scarce; specialized recruiters and consulting firms commonly charge placement fees of 20–30% of first‑year salary and premium consulting rates, allowing them to demand restrictive terms. Hiring delays frequently extend scale‑up and regulatory filing timelines, creating a human‑capital bottleneck that strengthens supplier bargaining power.
- Placement fees: 20–30%
- Consulting premiums: above market rates
- Result: delayed scale‑up and filings
CDMO concentration and >60% GMP share squeeze cash and margins
Suppliers hold high leverage: CDMO and GMP input concentration raises switching costs and slot prioritization, pushing pricing and strict terms. IP licenses and royalties (2024 upfronts $30–80M, royalties 3–8%) increase cash needs and margin risk. Skilled CMC/QC talent scarcity and capital‑intensive equipment deepen dependency and delay scale‑up.
| Metric | 2024 Value |
|---|---|
| GMP plasmid share top5 | >60% |
| Upfronts (median) | $30–80M |
| Royalties | 3–8% |
| Placement fees | 20–30% |
What is included in the product
Detailed Word Document
Uncovers key drivers of competition, customer influence, supplier power, substitutes, and market entry risks tailored to Rocket Pharma’s rare-disease gene therapy focus. Identifies disruptive threats, regulatory barriers, and strategic levers to protect market position and inform investor or internal strategy materials.
Customizable Excel Spreadsheet
A concise Rocket Pharma Porter's Five Forces one-sheet that instantly maps competitive pressures with an editable spider chart and customizable scores—perfect for board decks and quick strategic decisions.
Customers Bargaining Power
Payers as gatekeepers
Payers and HTA bodies act as gatekeepers for high-cost one-time therapies, demanding robust durability, safety and real-world evidence before reimbursement; many gene therapies carry list prices above $1M (eg Zolgensma ~2.1M). Outcomes-based contracts and annuities increasingly shift performance and payment risk back to manufacturers. Consolidation of payers and three PBMs controlling roughly 80% of US pharmacy claims amplifies negotiating leverage.
Centers of excellence
Limited qualified treatment sites concentrate purchasing influence, pressuring Rocket Pharma (NASDAQ RCKT) to prioritize partners with seamless supply chains and robust patient-support programs. Site capacity constraints drive selectivity on product adoption, making center-level buy-in critical. These centers’ clinical experiences directly shape payer coverage decisions and inclusion in clinical guidelines, amplifying their bargaining power.
Small patient pools
Small patient pools concentrate decision-making: WHO estimates ~300 million people live with rare diseases worldwide and in the US a rare disease is defined as affecting fewer than 200,000 individuals, shrinking aggregate buyer numbers but heightening case-by-case scrutiny. Individual patients typically lack price leverage while payers demand rigorous prior authorization and real-world evidence. Any adverse event can prompt widescale policy change across an indication, so precise patient selection is a prerequisite for access.
Regulatory and evidence demands
Buyers demand validated endpoints, long-term follow-up and comparative effectiveness where feasible; regulators (FDA in 2024) often require up to 15 years of post‑marketing follow‑up for certain gene therapies. Manufacturing consistency and robust CMC data are assessed as part of value, and payers commonly demand registries and post‑marketing commitments that increase launch costs. Evidence gaps routinely translate into restricted coverage, outcomes‑based contracts or rebates.
- 2024 FDA: up to 15‑year LTFU for some gene therapies
- Registries/post‑marketing studies: common payer requirement raising program costs
- Evidence gaps → coverage with evidence development, restricted access, or rebate arrangements
Public and policy pressure
High upfront prices for gene therapies draw political and media scrutiny, strengthening payer leverage as US Medicare negotiation authority from the Inflation Reduction Act is active and global HTA bodies press value-based pricing. Reference pricing, budget caps and value frameworks (eg NICE ~20,000–30,000 GBP/QALY) constrain negotiations. Orphan incentives remain (US 7-year exclusivity; EU 10 years) but face periodic policy review, and stakeholder optics often force price concessions or risk-sharing.
- Political scrutiny strengthens payers
- Reference pricing and caps limit negotiation
- Value thresholds (NICE ~20–30k GBP/QALY)
- Orphan exclusivity: US 7y, EU 10y
- Public optics drive concessions/risk-share
Payers and HTAs demand robust RWE as >$1M gene therapies face PBM concentration and 15y LTFU
Payers/PBMs (3 PBMs ≈80% US claims) plus HTAs demand robust RWE; many gene therapies price >$1M (Zolgensma ~$2.1M).
Limited treatment sites and small patient pools (US rare <200k) concentrate buyer power, driving prior auth, registries and site selectivity.
FDA may require up to 15‑year LTFU; NICE ~£20–30k/QALY; value frameworks push outcomes‑based contracts.
| Metric | Value |
|---|---|
| PBM concentration | 3 PBMs ≈80% |
| Gene therapy price | >$1M (Zolgensma ~$2.1M) |
| US rare definition | <200k |
| FDA LTFU | up to 15y |
| NICE threshold | £20–30k/QALY |
Preview Before You Purchase
Rocket Pharma Porter's Five Forces Analysis
This preview shows the exact Rocket Pharma Porter's Five Forces analysis you'll receive—fully formatted and ready for use. No mockups or samples: the file available after purchase is identical to this preview and downloadable instantly. Use it immediately for competitive strategy, valuation context, and decision-making.
Original: $10.00
-65%$10.00
$3.50Description
Don't Miss the Bigger Picture
Rocket Pharma faces high rivalry among biotech peers, niche gene-therapy pipelines with strong IP reduce substitute threats, and supplier power is moderate due to specialized manufacturing; buyer power is limited but regulatory risk and capital intensity raise barriers. This brief snapshot only scratches the surface. Unlock the full Porter's Five Forces Analysis to explore Rocket Pharma’s competitive dynamics, market pressures, and strategic advantages in detail.
Suppliers Bargaining Power
Concentrated vector CDMOs
LVV and AAV manufacturing capacity resides with a handful of specialized CDMOs (Catalent, Lonza, Thermo Fisher, WuXi, AGC), concentrating leverage. Tech transfers typically take 9–18 months and validation runs often cost six figures, making switching costly and risky. Suppliers routinely prioritize larger or higher-margin programs, tightening available slots. This elevates pricing power and stricter delivery terms over clinical-stage sponsors.
GMP-critical inputs
GMP plasmids, producer cell lines, resins and high‑grade reagents have few qualified sources—industry estimates in 2024 show >60% of GMP plasmid capacity concentrated in the top five suppliers. Lead times are lengthy (plasmids 12–24 weeks, specialty resins 20–36 weeks) and dual‑sourcing is hard due to comparability needs. Any quality deviation can trigger batch loss costing millions and postpone trials by months. Suppliers commonly enforce MOQs and annual escalation clauses given these stakes.
Specialized equipment/assays
Bioreactors (capital cost $0.1–5M) and chromatography skids ($0.2–2M) plus ddPCR/NGS platforms ($50k–1M) are capital-intensive and vendor-tied, with method transfer and assay validation effectively locking in platforms. Service contracts often run 10–20% of equipment cost annually and limited spare parts create dependencies; vendors push bundled pricing and upgrade cycles that can raise TCO by ~15–30% (2024 data).
IP/licensing dependencies
Access to AAV capsids, promoters and LVV parts often requires licenses with royalties (commonly 3–8%) and milestone schedules; 2024 deal trends show upfronts around $30–80M and milestones up to $100–200M, increasing sponsor cash needs. Late freedom-to-operate reviews can surface blocking IP, shifting leverage to licensors and prompting royalty stacking that can erode margins by several percentage points as programs advance. Negotiating carve-outs or field limits adds legal complexity and incremental cost, often delaying trials and increasing spend.
- Royalty ranges: 3–8%
- Upfronts (2024 median): $30–80M
- Milestones: $10–200M+
- Margin compression: several percentage points
Specialist talent scarcity
Experienced CMC, QC, QA and regulatory gene‑therapy experts remain scarce; specialized recruiters and consulting firms commonly charge placement fees of 20–30% of first‑year salary and premium consulting rates, allowing them to demand restrictive terms. Hiring delays frequently extend scale‑up and regulatory filing timelines, creating a human‑capital bottleneck that strengthens supplier bargaining power.
- Placement fees: 20–30%
- Consulting premiums: above market rates
- Result: delayed scale‑up and filings
CDMO concentration and >60% GMP share squeeze cash and margins
Suppliers hold high leverage: CDMO and GMP input concentration raises switching costs and slot prioritization, pushing pricing and strict terms. IP licenses and royalties (2024 upfronts $30–80M, royalties 3–8%) increase cash needs and margin risk. Skilled CMC/QC talent scarcity and capital‑intensive equipment deepen dependency and delay scale‑up.
| Metric | 2024 Value |
|---|---|
| GMP plasmid share top5 | >60% |
| Upfronts (median) | $30–80M |
| Royalties | 3–8% |
| Placement fees | 20–30% |
What is included in the product
Detailed Word Document
Uncovers key drivers of competition, customer influence, supplier power, substitutes, and market entry risks tailored to Rocket Pharma’s rare-disease gene therapy focus. Identifies disruptive threats, regulatory barriers, and strategic levers to protect market position and inform investor or internal strategy materials.
Customizable Excel Spreadsheet
A concise Rocket Pharma Porter's Five Forces one-sheet that instantly maps competitive pressures with an editable spider chart and customizable scores—perfect for board decks and quick strategic decisions.
Customers Bargaining Power
Payers as gatekeepers
Payers and HTA bodies act as gatekeepers for high-cost one-time therapies, demanding robust durability, safety and real-world evidence before reimbursement; many gene therapies carry list prices above $1M (eg Zolgensma ~2.1M). Outcomes-based contracts and annuities increasingly shift performance and payment risk back to manufacturers. Consolidation of payers and three PBMs controlling roughly 80% of US pharmacy claims amplifies negotiating leverage.
Centers of excellence
Limited qualified treatment sites concentrate purchasing influence, pressuring Rocket Pharma (NASDAQ RCKT) to prioritize partners with seamless supply chains and robust patient-support programs. Site capacity constraints drive selectivity on product adoption, making center-level buy-in critical. These centers’ clinical experiences directly shape payer coverage decisions and inclusion in clinical guidelines, amplifying their bargaining power.
Small patient pools
Small patient pools concentrate decision-making: WHO estimates ~300 million people live with rare diseases worldwide and in the US a rare disease is defined as affecting fewer than 200,000 individuals, shrinking aggregate buyer numbers but heightening case-by-case scrutiny. Individual patients typically lack price leverage while payers demand rigorous prior authorization and real-world evidence. Any adverse event can prompt widescale policy change across an indication, so precise patient selection is a prerequisite for access.
Regulatory and evidence demands
Buyers demand validated endpoints, long-term follow-up and comparative effectiveness where feasible; regulators (FDA in 2024) often require up to 15 years of post‑marketing follow‑up for certain gene therapies. Manufacturing consistency and robust CMC data are assessed as part of value, and payers commonly demand registries and post‑marketing commitments that increase launch costs. Evidence gaps routinely translate into restricted coverage, outcomes‑based contracts or rebates.
- 2024 FDA: up to 15‑year LTFU for some gene therapies
- Registries/post‑marketing studies: common payer requirement raising program costs
- Evidence gaps → coverage with evidence development, restricted access, or rebate arrangements
Public and policy pressure
High upfront prices for gene therapies draw political and media scrutiny, strengthening payer leverage as US Medicare negotiation authority from the Inflation Reduction Act is active and global HTA bodies press value-based pricing. Reference pricing, budget caps and value frameworks (eg NICE ~20,000–30,000 GBP/QALY) constrain negotiations. Orphan incentives remain (US 7-year exclusivity; EU 10 years) but face periodic policy review, and stakeholder optics often force price concessions or risk-sharing.
- Political scrutiny strengthens payers
- Reference pricing and caps limit negotiation
- Value thresholds (NICE ~20–30k GBP/QALY)
- Orphan exclusivity: US 7y, EU 10y
- Public optics drive concessions/risk-share
Payers and HTAs demand robust RWE as >$1M gene therapies face PBM concentration and 15y LTFU
Payers/PBMs (3 PBMs ≈80% US claims) plus HTAs demand robust RWE; many gene therapies price >$1M (Zolgensma ~$2.1M).
Limited treatment sites and small patient pools (US rare <200k) concentrate buyer power, driving prior auth, registries and site selectivity.
FDA may require up to 15‑year LTFU; NICE ~£20–30k/QALY; value frameworks push outcomes‑based contracts.
| Metric | Value |
|---|---|
| PBM concentration | 3 PBMs ≈80% |
| Gene therapy price | >$1M (Zolgensma ~$2.1M) |
| US rare definition | <200k |
| FDA LTFU | up to 15y |
| NICE threshold | £20–30k/QALY |
Preview Before You Purchase
Rocket Pharma Porter's Five Forces Analysis
This preview shows the exact Rocket Pharma Porter's Five Forces analysis you'll receive—fully formatted and ready for use. No mockups or samples: the file available after purchase is identical to this preview and downloadable instantly. Use it immediately for competitive strategy, valuation context, and decision-making.











