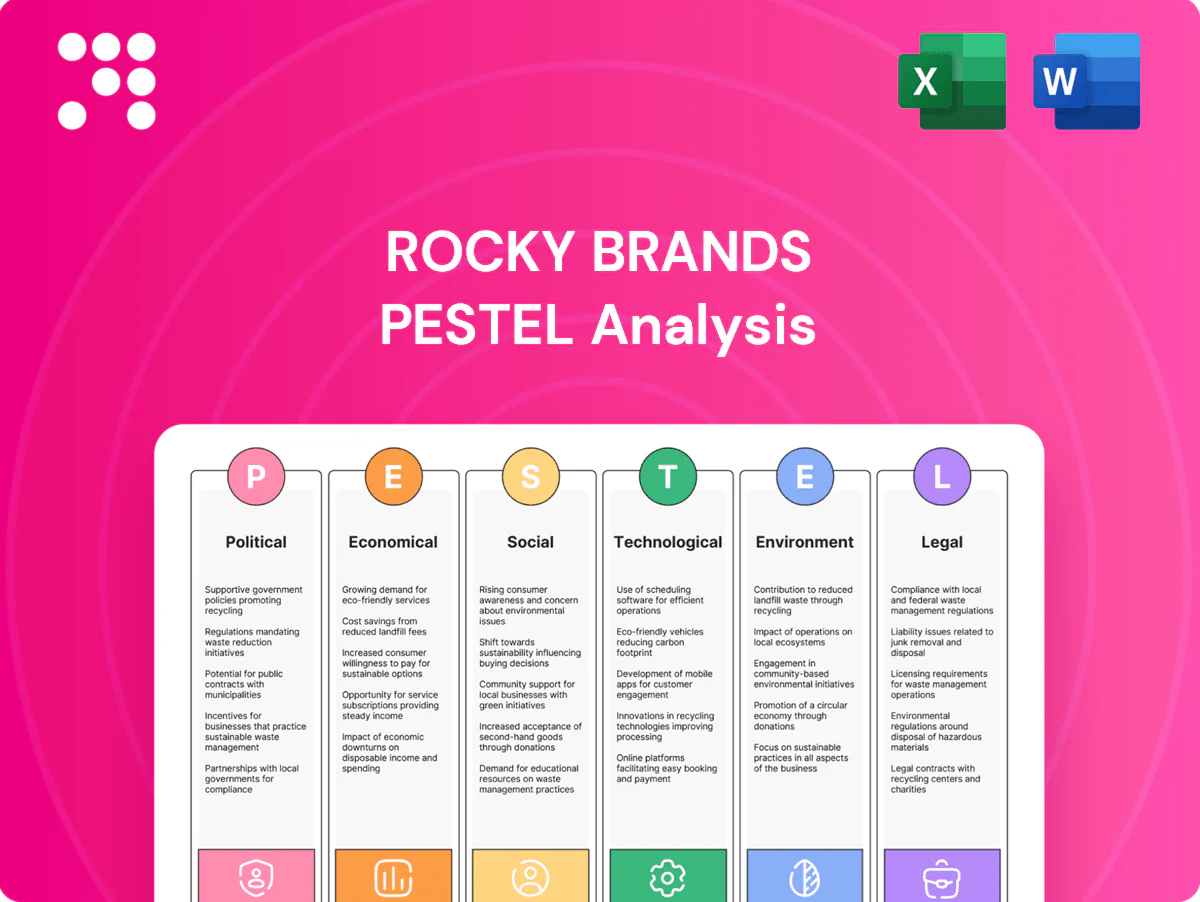
Rocky Brands PESTLE Analysis

Your Shortcut to Market Insight Starts Here
Discover how political shifts, economic cycles, social trends, technological advances, legal pressures, and environmental risks shape Rocky Brands' prospects in our concise PESTLE snapshot. Use these strategic insights to spot risks and opportunities—buy the full PESTLE now for the complete, ready-to-use analysis.
Political factors

Tariffs and trade policy
Footwear faces shifting tariffs, quotas and anti-dumping actions—Section 301 measures still cover roughly 370 billion in Chinese goods and tariffs can add an estimated 10–35% to landed costs, pressuring pricing power. Changes in US–China or US–Vietnam trade terms have already rerouted sourcing and compressed margins for many brands. Proactive supplier diversification and tariff engineering reduce exposure, while ongoing monitoring of USTR actions is essential for planning.
Defense procurement dynamics
Rocky’s military category is directly tied to US defense budgets (FY2024 topline roughly $858 billion) and Berry Amendment requirements that mandate domestic sourcing. Contract timing and detailed specs from DoD procurement often create volume spikes or lulls, impacting quarterly utilization. Maintaining compliant U.S. production capacity secures eligibility for contracts, and close engagement with procurement cycles helps stabilize plant throughput.

Labor and industrial policy
Minimum wage remains $7.25 federally (since 2009) while state hikes raise Rocky Brands labor costs and plant-siting decisions; reshoring incentives like the CHIPS Act ($52.7B) and Inflation Reduction Act (~$369B) provide tax credits/subsidies that can offset automation or domestic capex. Political shifts can change benefit mandates, compliance costs and collective bargaining strength, so scenario planning is needed to protect margin targets.

Geopolitical supply chain risk
Geopolitical supply chain risks—conflicts, sanctions and port disruptions—have driven freight cost volatility and longer lead times, with US West Coast port vessel wait times falling to about 2–3 days in 2024 after pandemic-era peaks but remaining a source of episodic delay per Port of Los Angeles data.
Rocky Brands mitigates single-country risk by sourcing across multiple countries and increasing visibility into Tier-2/Tier-3 suppliers to reduce surprise bottlenecks; contingency logistics contracts help preserve service levels and stabilize costs.
- Conflicts/sanctions increase freight volatility and lead times
- Multi-country sourcing reduces single-country exposure
- Tier-2/3 visibility lowers unexpected bottlenecks
- Contingency logistics contracts preserve service levels
Tax regime and incentives
US federal corporate tax remains 21%, while state incentives and local credits materially affect Rocky Brands RCKY’s footprint and after-tax returns. Duty drawback programs can recover up to 99% of paid duties and US free-trade zones reduce import duty timing to boost cash flow. Federal R&D tax credits can offset up to 20% of qualified research costs, lowering net development spend; disciplined tax planning reduces earnings volatility.
- Corporate tax rate: 21%
- Duty drawback: up to 99% recovery
- R&D credit: up to 20% of QREs
- FTZs: improve cash flow/timing
Tariffs raise landed costs up to 35% and drive US sourcing shifts
Tariffs/Section 301 (~370 billion in Chinese goods) raise landed costs 10–35% and drive sourcing shifts. Military sales link to FY2024 DoD budget ~$858 billion and Berry Amendment domestic sourcing. Federal corporate tax 21%; CHIPS $52.7B, IRA ~$369B, duty drawback up to 99%; US West Coast port waits ~2–3 days (2024).
| Tag | Metric | Value |
|---|---|---|
| Tariffs | Section 301 coverage | ~$370B; +10–35% landed cost |
| Defense | DoD FY2024 | $858B |
| Tax | Federal corp rate | 21% |
| Incentives | CHIPS / IRA | $52.7B / ~$369B |
| Trade | Duty drawback | Up to 99% |
| Logistics | Port wait (2024) | ~2–3 days |
What is included in the product
 Detailed Word Document
Explores how macro-environmental factors uniquely affect Rocky Brands across Political, Economic, Social, Technological, Environmental, and Legal dimensions, with data-driven trends and forward-looking insights to identify threats and opportunities for executives, investors, and strategists; delivered in clean, report-ready format for planning, funding, and scenario design.

 Customizable Excel Spreadsheet
Provides a concise, visually segmented PESTLE summary of Rocky Brands to drop into presentations or planning sessions, enabling quick alignment across teams and supporting discussions on external risks and market positioning.
Economic factors

Consumer spending cycles
Work and outdoor footwear demand tracks employment and construction; US unemployment fell to about 3.7% in late 2024 while US construction put-in-place was roughly $1.9 trillion in 2024, supporting commercial/work volumes. In downturns consumers shift to value tiers and durable basics, pushing promotional intensity and squeezing gross margins across the sector. Flexible pricing and assortment strategies have protected share for players like Rocky Brands.
Input cost volatility
Leather, rubber, adhesives and freight costs for Rocky Brands move with commodities and oil—Brent averaged about $85/barrel in 2024, keeping upstream input pressure variable. Hedging, forward buys and multi‑sourcing have been used to stabilize COGS while passing increases to customers depends on brand strength and timing. Design‑to‑cost initiatives offset inflation by redesigning components to preserve performance.

FX and global sourcing
Currency moves materially affect Rocky Brands through supplier quotes and translation of international sales; the US dollar’s strength (DXY near 105 in 2024) can lower input costs but tightens export pricing power. Natural hedges and local-currency contracts are used to reduce earnings volatility. Dynamic sourcing reallocates volumes to lower-cost regions, preserving margins amid ±5–10% FX swings.

Channel mix and margin
Wholesale gives Rocky Brands scale but compresses gross margins, while DTC/e-commerce typically improves gross margin mix at the expense of higher fulfillment and customer acquisition costs; optimizing assortment by channel raises inventory turns and profitability. MAP policies and selective distribution help protect price integrity and brand value. Omnichannel customer engagement drives higher lifetime value through cross-channel retention and repeat purchase.
- Wholesale: scale, thinner margins
- DTC: higher margin, higher fulfillment cost
- Assortment optimization: better turns
- MAP/selective distribution: price protection
- Omnichannel: increased LTV
Interest rates and inventory
Higher interest rates raise Rocky Brands' carrying costs for seasonal, size-intensive inventories and increase financing expense as the federal funds rate stood at 5.25–5.50% in 2024, squeezing margins on inventory held across channels. Tighter working capital cycles force more accurate demand planning to avoid markdowns. Vendor terms and supply-chain finance can alleviate cash pressure, while lean replenishment reduces obsolescence risk.
- Higher rates: federal funds 5.25–5.50% (2024)
- Need: accurate demand planning
- Mitigants: vendor terms, supply-chain finance
- Strategy: lean replenishment to cut obsolescence
Tariffs raise landed costs up to 35% and drive US sourcing shifts
Work/outdoor demand tied to employment and construction (US unemployment ~3.7% and construction put-in-place ~$1.9T in 2024) supporting volumes; downturns shift consumers to value, pressuring margins. Input cost pressure from Brent ~$85/bbl in 2024 and FX (DXY ~105) affect COGS; hedging and sourcing mitigate. Higher rates (fed 5.25–5.50% in 2024) raise carrying costs; lean replenishment and supply‑chain finance reduce risk.
| Metric | 2024 |
|---|---|
| Unemployment | ~3.7% |
| Construction put-in-place | $1.9T |
| Brent | $85/bbl |
| DXY | ~105 |
| Fed funds | 5.25–5.50% |
Same Document Delivered
Rocky Brands PESTLE Analysis
The Rocky Brands PESTLE Analysis preview shown here is the exact document you’ll receive after purchase, fully formatted and ready to use. This is a real snapshot of the final file—no placeholders or teasers. The content, structure, and layout visible here are exactly what you’ll download immediately after checkout.

Your Shortcut to Market Insight Starts Here
Discover how political shifts, economic cycles, social trends, technological advances, legal pressures, and environmental risks shape Rocky Brands' prospects in our concise PESTLE snapshot. Use these strategic insights to spot risks and opportunities—buy the full PESTLE now for the complete, ready-to-use analysis.
Political factors
Tariffs and trade policy
Footwear faces shifting tariffs, quotas and anti-dumping actions—Section 301 measures still cover roughly 370 billion in Chinese goods and tariffs can add an estimated 10–35% to landed costs, pressuring pricing power. Changes in US–China or US–Vietnam trade terms have already rerouted sourcing and compressed margins for many brands. Proactive supplier diversification and tariff engineering reduce exposure, while ongoing monitoring of USTR actions is essential for planning.
Defense procurement dynamics
Rocky’s military category is directly tied to US defense budgets (FY2024 topline roughly $858 billion) and Berry Amendment requirements that mandate domestic sourcing. Contract timing and detailed specs from DoD procurement often create volume spikes or lulls, impacting quarterly utilization. Maintaining compliant U.S. production capacity secures eligibility for contracts, and close engagement with procurement cycles helps stabilize plant throughput.
Labor and industrial policy
Minimum wage remains $7.25 federally (since 2009) while state hikes raise Rocky Brands labor costs and plant-siting decisions; reshoring incentives like the CHIPS Act ($52.7B) and Inflation Reduction Act (~$369B) provide tax credits/subsidies that can offset automation or domestic capex. Political shifts can change benefit mandates, compliance costs and collective bargaining strength, so scenario planning is needed to protect margin targets.
Geopolitical supply chain risk
Geopolitical supply chain risks—conflicts, sanctions and port disruptions—have driven freight cost volatility and longer lead times, with US West Coast port vessel wait times falling to about 2–3 days in 2024 after pandemic-era peaks but remaining a source of episodic delay per Port of Los Angeles data.
Rocky Brands mitigates single-country risk by sourcing across multiple countries and increasing visibility into Tier-2/Tier-3 suppliers to reduce surprise bottlenecks; contingency logistics contracts help preserve service levels and stabilize costs.
- Conflicts/sanctions increase freight volatility and lead times
- Multi-country sourcing reduces single-country exposure
- Tier-2/3 visibility lowers unexpected bottlenecks
- Contingency logistics contracts preserve service levels
Tax regime and incentives
US federal corporate tax remains 21%, while state incentives and local credits materially affect Rocky Brands RCKY’s footprint and after-tax returns. Duty drawback programs can recover up to 99% of paid duties and US free-trade zones reduce import duty timing to boost cash flow. Federal R&D tax credits can offset up to 20% of qualified research costs, lowering net development spend; disciplined tax planning reduces earnings volatility.
- Corporate tax rate: 21%
- Duty drawback: up to 99% recovery
- R&D credit: up to 20% of QREs
- FTZs: improve cash flow/timing
Tariffs raise landed costs up to 35% and drive US sourcing shifts
Tariffs/Section 301 (~370 billion in Chinese goods) raise landed costs 10–35% and drive sourcing shifts. Military sales link to FY2024 DoD budget ~$858 billion and Berry Amendment domestic sourcing. Federal corporate tax 21%; CHIPS $52.7B, IRA ~$369B, duty drawback up to 99%; US West Coast port waits ~2–3 days (2024).
| Tag | Metric | Value |
|---|---|---|
| Tariffs | Section 301 coverage | ~$370B; +10–35% landed cost |
| Defense | DoD FY2024 | $858B |
| Tax | Federal corp rate | 21% |
| Incentives | CHIPS / IRA | $52.7B / ~$369B |
| Trade | Duty drawback | Up to 99% |
| Logistics | Port wait (2024) | ~2–3 days |
What is included in the product
Detailed Word Document
Explores how macro-environmental factors uniquely affect Rocky Brands across Political, Economic, Social, Technological, Environmental, and Legal dimensions, with data-driven trends and forward-looking insights to identify threats and opportunities for executives, investors, and strategists; delivered in clean, report-ready format for planning, funding, and scenario design.
Customizable Excel Spreadsheet
Provides a concise, visually segmented PESTLE summary of Rocky Brands to drop into presentations or planning sessions, enabling quick alignment across teams and supporting discussions on external risks and market positioning.
Economic factors
Consumer spending cycles
Work and outdoor footwear demand tracks employment and construction; US unemployment fell to about 3.7% in late 2024 while US construction put-in-place was roughly $1.9 trillion in 2024, supporting commercial/work volumes. In downturns consumers shift to value tiers and durable basics, pushing promotional intensity and squeezing gross margins across the sector. Flexible pricing and assortment strategies have protected share for players like Rocky Brands.
Input cost volatility
Leather, rubber, adhesives and freight costs for Rocky Brands move with commodities and oil—Brent averaged about $85/barrel in 2024, keeping upstream input pressure variable. Hedging, forward buys and multi‑sourcing have been used to stabilize COGS while passing increases to customers depends on brand strength and timing. Design‑to‑cost initiatives offset inflation by redesigning components to preserve performance.
FX and global sourcing
Currency moves materially affect Rocky Brands through supplier quotes and translation of international sales; the US dollar’s strength (DXY near 105 in 2024) can lower input costs but tightens export pricing power. Natural hedges and local-currency contracts are used to reduce earnings volatility. Dynamic sourcing reallocates volumes to lower-cost regions, preserving margins amid ±5–10% FX swings.
Channel mix and margin
Wholesale gives Rocky Brands scale but compresses gross margins, while DTC/e-commerce typically improves gross margin mix at the expense of higher fulfillment and customer acquisition costs; optimizing assortment by channel raises inventory turns and profitability. MAP policies and selective distribution help protect price integrity and brand value. Omnichannel customer engagement drives higher lifetime value through cross-channel retention and repeat purchase.
- Wholesale: scale, thinner margins
- DTC: higher margin, higher fulfillment cost
- Assortment optimization: better turns
- MAP/selective distribution: price protection
- Omnichannel: increased LTV
Interest rates and inventory
Higher interest rates raise Rocky Brands' carrying costs for seasonal, size-intensive inventories and increase financing expense as the federal funds rate stood at 5.25–5.50% in 2024, squeezing margins on inventory held across channels. Tighter working capital cycles force more accurate demand planning to avoid markdowns. Vendor terms and supply-chain finance can alleviate cash pressure, while lean replenishment reduces obsolescence risk.
- Higher rates: federal funds 5.25–5.50% (2024)
- Need: accurate demand planning
- Mitigants: vendor terms, supply-chain finance
- Strategy: lean replenishment to cut obsolescence
Tariffs raise landed costs up to 35% and drive US sourcing shifts
Work/outdoor demand tied to employment and construction (US unemployment ~3.7% and construction put-in-place ~$1.9T in 2024) supporting volumes; downturns shift consumers to value, pressuring margins. Input cost pressure from Brent ~$85/bbl in 2024 and FX (DXY ~105) affect COGS; hedging and sourcing mitigate. Higher rates (fed 5.25–5.50% in 2024) raise carrying costs; lean replenishment and supply‑chain finance reduce risk.
| Metric | 2024 |
|---|---|
| Unemployment | ~3.7% |
| Construction put-in-place | $1.9T |
| Brent | $85/bbl |
| DXY | ~105 |
| Fed funds | 5.25–5.50% |
Same Document Delivered
Rocky Brands PESTLE Analysis
The Rocky Brands PESTLE Analysis preview shown here is the exact document you’ll receive after purchase, fully formatted and ready to use. This is a real snapshot of the final file—no placeholders or teasers. The content, structure, and layout visible here are exactly what you’ll download immediately after checkout.
Original: $10.00
-65%$10.00
$3.50Description
Your Shortcut to Market Insight Starts Here
Discover how political shifts, economic cycles, social trends, technological advances, legal pressures, and environmental risks shape Rocky Brands' prospects in our concise PESTLE snapshot. Use these strategic insights to spot risks and opportunities—buy the full PESTLE now for the complete, ready-to-use analysis.
Political factors
Tariffs and trade policy
Footwear faces shifting tariffs, quotas and anti-dumping actions—Section 301 measures still cover roughly 370 billion in Chinese goods and tariffs can add an estimated 10–35% to landed costs, pressuring pricing power. Changes in US–China or US–Vietnam trade terms have already rerouted sourcing and compressed margins for many brands. Proactive supplier diversification and tariff engineering reduce exposure, while ongoing monitoring of USTR actions is essential for planning.
Defense procurement dynamics
Rocky’s military category is directly tied to US defense budgets (FY2024 topline roughly $858 billion) and Berry Amendment requirements that mandate domestic sourcing. Contract timing and detailed specs from DoD procurement often create volume spikes or lulls, impacting quarterly utilization. Maintaining compliant U.S. production capacity secures eligibility for contracts, and close engagement with procurement cycles helps stabilize plant throughput.
Labor and industrial policy
Minimum wage remains $7.25 federally (since 2009) while state hikes raise Rocky Brands labor costs and plant-siting decisions; reshoring incentives like the CHIPS Act ($52.7B) and Inflation Reduction Act (~$369B) provide tax credits/subsidies that can offset automation or domestic capex. Political shifts can change benefit mandates, compliance costs and collective bargaining strength, so scenario planning is needed to protect margin targets.
Geopolitical supply chain risk
Geopolitical supply chain risks—conflicts, sanctions and port disruptions—have driven freight cost volatility and longer lead times, with US West Coast port vessel wait times falling to about 2–3 days in 2024 after pandemic-era peaks but remaining a source of episodic delay per Port of Los Angeles data.
Rocky Brands mitigates single-country risk by sourcing across multiple countries and increasing visibility into Tier-2/Tier-3 suppliers to reduce surprise bottlenecks; contingency logistics contracts help preserve service levels and stabilize costs.
- Conflicts/sanctions increase freight volatility and lead times
- Multi-country sourcing reduces single-country exposure
- Tier-2/3 visibility lowers unexpected bottlenecks
- Contingency logistics contracts preserve service levels
Tax regime and incentives
US federal corporate tax remains 21%, while state incentives and local credits materially affect Rocky Brands RCKY’s footprint and after-tax returns. Duty drawback programs can recover up to 99% of paid duties and US free-trade zones reduce import duty timing to boost cash flow. Federal R&D tax credits can offset up to 20% of qualified research costs, lowering net development spend; disciplined tax planning reduces earnings volatility.
- Corporate tax rate: 21%
- Duty drawback: up to 99% recovery
- R&D credit: up to 20% of QREs
- FTZs: improve cash flow/timing
Tariffs raise landed costs up to 35% and drive US sourcing shifts
Tariffs/Section 301 (~370 billion in Chinese goods) raise landed costs 10–35% and drive sourcing shifts. Military sales link to FY2024 DoD budget ~$858 billion and Berry Amendment domestic sourcing. Federal corporate tax 21%; CHIPS $52.7B, IRA ~$369B, duty drawback up to 99%; US West Coast port waits ~2–3 days (2024).
| Tag | Metric | Value |
|---|---|---|
| Tariffs | Section 301 coverage | ~$370B; +10–35% landed cost |
| Defense | DoD FY2024 | $858B |
| Tax | Federal corp rate | 21% |
| Incentives | CHIPS / IRA | $52.7B / ~$369B |
| Trade | Duty drawback | Up to 99% |
| Logistics | Port wait (2024) | ~2–3 days |
What is included in the product
Detailed Word Document
Explores how macro-environmental factors uniquely affect Rocky Brands across Political, Economic, Social, Technological, Environmental, and Legal dimensions, with data-driven trends and forward-looking insights to identify threats and opportunities for executives, investors, and strategists; delivered in clean, report-ready format for planning, funding, and scenario design.
Customizable Excel Spreadsheet
Provides a concise, visually segmented PESTLE summary of Rocky Brands to drop into presentations or planning sessions, enabling quick alignment across teams and supporting discussions on external risks and market positioning.
Economic factors
Consumer spending cycles
Work and outdoor footwear demand tracks employment and construction; US unemployment fell to about 3.7% in late 2024 while US construction put-in-place was roughly $1.9 trillion in 2024, supporting commercial/work volumes. In downturns consumers shift to value tiers and durable basics, pushing promotional intensity and squeezing gross margins across the sector. Flexible pricing and assortment strategies have protected share for players like Rocky Brands.
Input cost volatility
Leather, rubber, adhesives and freight costs for Rocky Brands move with commodities and oil—Brent averaged about $85/barrel in 2024, keeping upstream input pressure variable. Hedging, forward buys and multi‑sourcing have been used to stabilize COGS while passing increases to customers depends on brand strength and timing. Design‑to‑cost initiatives offset inflation by redesigning components to preserve performance.
FX and global sourcing
Currency moves materially affect Rocky Brands through supplier quotes and translation of international sales; the US dollar’s strength (DXY near 105 in 2024) can lower input costs but tightens export pricing power. Natural hedges and local-currency contracts are used to reduce earnings volatility. Dynamic sourcing reallocates volumes to lower-cost regions, preserving margins amid ±5–10% FX swings.
Channel mix and margin
Wholesale gives Rocky Brands scale but compresses gross margins, while DTC/e-commerce typically improves gross margin mix at the expense of higher fulfillment and customer acquisition costs; optimizing assortment by channel raises inventory turns and profitability. MAP policies and selective distribution help protect price integrity and brand value. Omnichannel customer engagement drives higher lifetime value through cross-channel retention and repeat purchase.
- Wholesale: scale, thinner margins
- DTC: higher margin, higher fulfillment cost
- Assortment optimization: better turns
- MAP/selective distribution: price protection
- Omnichannel: increased LTV
Interest rates and inventory
Higher interest rates raise Rocky Brands' carrying costs for seasonal, size-intensive inventories and increase financing expense as the federal funds rate stood at 5.25–5.50% in 2024, squeezing margins on inventory held across channels. Tighter working capital cycles force more accurate demand planning to avoid markdowns. Vendor terms and supply-chain finance can alleviate cash pressure, while lean replenishment reduces obsolescence risk.
- Higher rates: federal funds 5.25–5.50% (2024)
- Need: accurate demand planning
- Mitigants: vendor terms, supply-chain finance
- Strategy: lean replenishment to cut obsolescence
Tariffs raise landed costs up to 35% and drive US sourcing shifts
Work/outdoor demand tied to employment and construction (US unemployment ~3.7% and construction put-in-place ~$1.9T in 2024) supporting volumes; downturns shift consumers to value, pressuring margins. Input cost pressure from Brent ~$85/bbl in 2024 and FX (DXY ~105) affect COGS; hedging and sourcing mitigate. Higher rates (fed 5.25–5.50% in 2024) raise carrying costs; lean replenishment and supply‑chain finance reduce risk.
| Metric | 2024 |
|---|---|
| Unemployment | ~3.7% |
| Construction put-in-place | $1.9T |
| Brent | $85/bbl |
| DXY | ~105 |
| Fed funds | 5.25–5.50% |
Same Document Delivered
Rocky Brands PESTLE Analysis
The Rocky Brands PESTLE Analysis preview shown here is the exact document you’ll receive after purchase, fully formatted and ready to use. This is a real snapshot of the final file—no placeholders or teasers. The content, structure, and layout visible here are exactly what you’ll download immediately after checkout.











