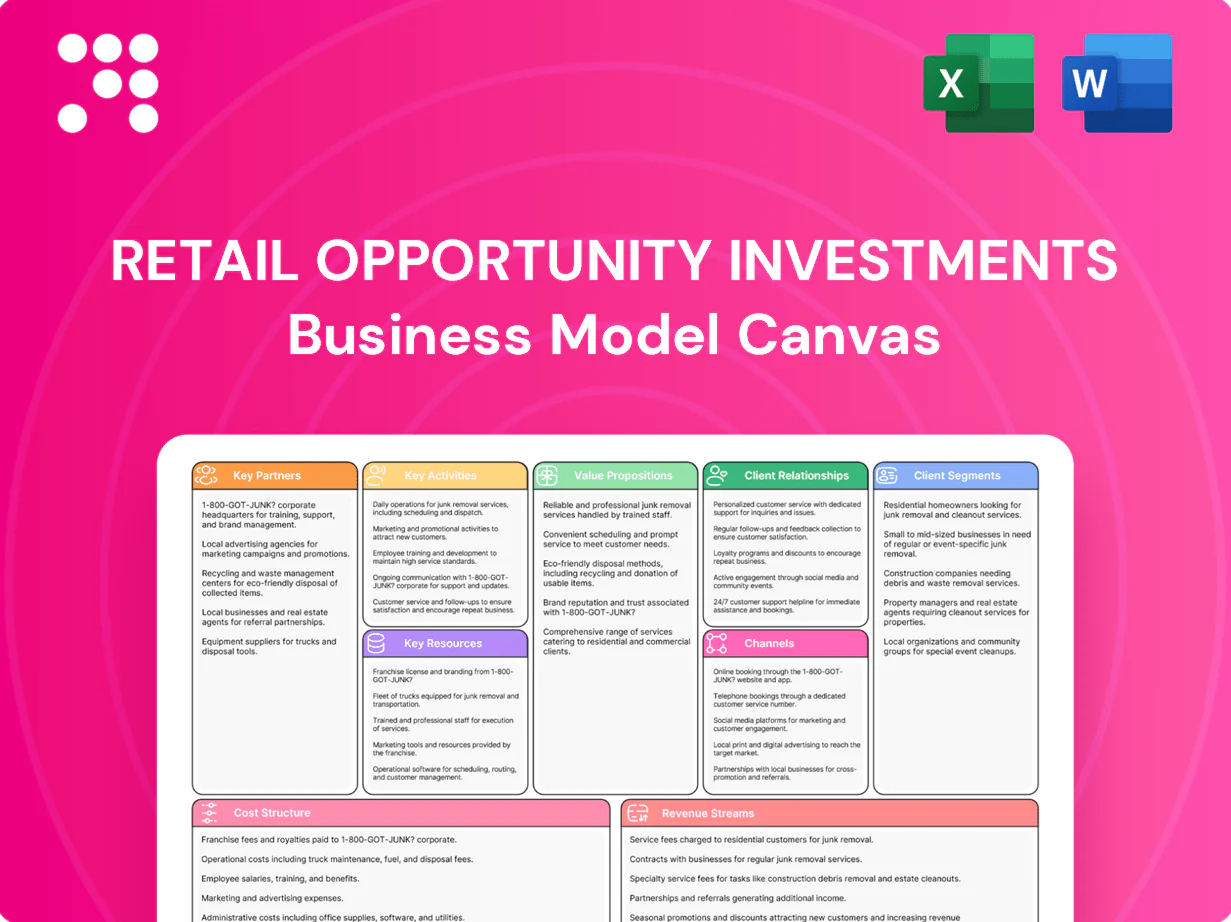
Retail Opportunity Investments Business Model Canvas

Retail Opportunity Investments: Business Model Canvas Snapshot for Investors
Unlock the strategic blueprint behind Retail Opportunity Investments with our concise Business Model Canvas preview. This snapshot shows core value propositions, customer segments, and revenue levers that drive performance. Purchase the full Canvas for a section-by-section breakdown, financial implications, and editable Word/Excel files. Perfect for investors, strategists, and analysts seeking actionable insights.
Partnerships

Grocery anchor tenant alliances
Partnerships with creditworthy grocery chains such as Kroger, Albertsons and Publix secure daily foot traffic and stabilize rent rolls; US grocery sales were roughly $800 billion in 2024. Anchors boost center visibility and attract complementary tenants, improving tenant mix and sales per sq ft. Long-term anchor leases typically run 10–25 years, reducing turnover risk and supporting favorable financing. Co-marketing and coordinated events further enhance center performance and shopper frequency.
National and regional retailers
Relationships with pharmacies (CVS ~9,900 US stores, Walgreens ~8,000 in 2024), discount retailers (Dollar General ~19,600 stores in 2024), fitness (Planet Fitness ~2,600 US clubs) and service providers fill complementary categories and diversify income, reducing reliance on any single sector. Portfolio-wide deals can accelerate lease-up and renewals, while data-driven placement boosts sales productivity and tenant retention.

Debt and equity capital providers
Banks, life insurers and bond investors provide revolving credit and mortgage financing, with lending terms in 2024 shaped by occupancy, NOI trends and asset quality. With the Fed funds target averaging 5.25–5.50% in 2024, favorable pricing still required strong cashflows and low vacancy. Stable lender relationships enable opportunistic acquisitions and refinancing. Equity investors support growth via accretive public-market raises.

Leasing brokers and property service vendors
Leasing brokers expand deal flow and tenant reach in target submarkets, with brokered transactions accounting for a majority of retail leases in 2024 as investors prioritized local market expertise amidst slower transaction volumes.
Facility managers, landscapers, and security firms uphold property standards and reduce tenant churn; professional management typically cuts reactive maintenance costs and vacancy downtime.
Vendor SLAs ensure responsiveness and cost control through KPIs (response time, completion rate, cost per SQFT), protecting NOI and brand reputation.
- Broker networks: expanded deal flow, localized tenant sourcing
- Facility vendors: maintain standards, reduce churn
- SLAs: KPI-driven cost and response control
- Outcome: stronger brand and tenant satisfaction
Municipalities and developers
Municipalities and developers shape entitlements, zoning and redevelopment timelines; coordinated permitting and signage agreements can accelerate projects—U.S. retail vacancy was about 4.5% in 2024, heightening focus on repositioning. Co-development partners de-risk construction and re-tenanting, while community alignment improves acceptance and long-term NAV.
- Entitlements: municipal approval essential
- Permits/signage: unlock access and traffic improvements
- Co-development: shared capex/risk
- Community: boosts leasing and value
Grocery anchor and pharmacy partnerships stabilize rents, drive traffic, and enable deals
Partnerships with grocery anchors (US grocery sales ~$800B in 2024) and pharmacies/discount chains (CVS 9,900 stores, Walgreens 8,000, Dollar General 19,600 in 2024) secure traffic and diversify income. Lenders and equity (Fed funds 5.25–5.50% avg 2024) enable acquisitions and refinancing. Municipal and co-development partners reduce entitlement risk amid 4.5% retail vacancy in 2024.
| Partner | Role | 2024 metric |
|---|---|---|
| Grocery anchors | Stabilize rent rolls | $800B sales |
| Pharmacies/discount | Drive traffic/diversify | CVS 9,900; DG 19,600 |
| Lenders | Financing | Fed funds 5.25–5.50% |
| Municipal/dev | Entitlements/reposition | Retail vacancy 4.5% |
What is included in the product
 Detailed Word Document
A comprehensive Business Model Canvas tailored to Retail Opportunity Investments, detailing customer segments, value propositions, channels, revenue streams, key partners, activities, resources, cost structure, and investor-focused metrics. Includes competitive advantage analysis and SWOT insights, organized for presentations, funding discussions, and validation of retail real estate strategies.

 Customizable Excel Spreadsheet
High-level view of Retail Opportunity Investments’ business model highlighting tenant mix, lease economics, and portfolio risks in editable cells to quickly relieve analysis and alignment pain points for teams and boards.
Activities

Targeted acquisitions and dispositions
Sourcing grocery-anchored, infill centers in high-barrier West Coast markets like Los Angeles and San Francisco drives portfolio quality and resilience. Underwriting emphasizes tenant credit, trade-area density and rent spreads to preserve cash flow. Capital recycling exits non-core assets to fund higher-yield opportunities. Disciplined timing manages interest-rate and valuation cycles amid 2024 Fed funds at 5.25–5.50%.
Leasing and tenant mix optimization
Proactive leasing targets necessity-based categories to drive footfall, aiming to lower vacancy toward sub-5% levels; in 2024 operators prioritized grocers and pharmacies as anchors. Curating complements to anchors boosts cross-shopping and dwell time, with rent-share deals (5–10% of sales) common in 2024 to align risk and upside. Data-informed merchandising and 7–10% occupancy-cost targets strengthen sales-per-sqft and occupancy ratios.

Asset management and operations
Daily operations focus on curb appeal, safety and uptime to preserve shopper experience and limit revenue disruption. CAM budget management, vendor oversight and energy projects such as LED retrofits (typical energy savings ~30%) constrain operating expenses. Routine and preventative maintenance extends asset life, while KPI tracking of NOI, foot traffic and tenant health — with occupancy targets above 90% — guides performance.

Redevelopment and value-add projects
Re-tenanting boxes, pad splits and façade upgrades commonly boost achieved rents by 10–30% versus legacy leases, while entitlement work unlocks outparcel value and modern formats (drive-thrus, last-mile lockers) that can add $50k–$250k annual NOI per pad in 2024 markets. Capex prioritization focuses on projects targeting 12–20% IRRs; phased execution reduces downtime and tenant disruption, preserving cash flow.
- Rent uplift: 10–30%
- Outparcel NOI potential: $50k–$250k
- Target IRR: 12–20%
- Phased execution: lower vacancy loss
Financing and investor relations
Active balance sheet management targets loan-to-value of 40–60% and 12–24 months of liquidity to optimize leverage and flexibility. Strategic refinancing locks in favorable rates and duration amid 2024 market volatility, preserving cashflow. Transparent quarterly reporting plus ESG and community updates strengthen investor trust and access to capital.
- Target LTV 40–60%
- Liquidity buffer 12–24 months
- Quarterly reporting + ESG KPIs
- Refinance to match duration/rates
Grocery-anchored infill LA/SF: prioritize grocers, hold vacancy 5%
Sourcing grocery-anchored infill in LA/SF preserves cash flow; underwriting stresses tenant credit, trade-area density and 2024 Fed funds at 5.25–5.50%. Proactive leasing targets grocers/pharmacies to drive vacancy <5% and rent-share 5–10%; re-tenanting and pad work lift rents 10–30%. Active balance-sheet targets LTV 40–60% and 12–24 months liquidity; LED retrofits save ~30% energy.
| Metric | 2024 Value |
|---|---|
| Vacancy target | <5% |
| Rent uplift | 10–30% |
| Outparcel NOI | $50k–$250k |
| Target IRR | 12–20% |
| Target LTV | 40–60% |
Preview Before You Purchase
Business Model Canvas
The document previewed here is the actual Retail Opportunity Investments Business Model Canvas you will receive—no mockups or samples. Upon purchase you’ll get this same complete, editable file ready to use for strategy, presentation, and analysis in Word and Excel formats.

Retail Opportunity Investments: Business Model Canvas Snapshot for Investors
Unlock the strategic blueprint behind Retail Opportunity Investments with our concise Business Model Canvas preview. This snapshot shows core value propositions, customer segments, and revenue levers that drive performance. Purchase the full Canvas for a section-by-section breakdown, financial implications, and editable Word/Excel files. Perfect for investors, strategists, and analysts seeking actionable insights.
Partnerships
Grocery anchor tenant alliances
Partnerships with creditworthy grocery chains such as Kroger, Albertsons and Publix secure daily foot traffic and stabilize rent rolls; US grocery sales were roughly $800 billion in 2024. Anchors boost center visibility and attract complementary tenants, improving tenant mix and sales per sq ft. Long-term anchor leases typically run 10–25 years, reducing turnover risk and supporting favorable financing. Co-marketing and coordinated events further enhance center performance and shopper frequency.
National and regional retailers
Relationships with pharmacies (CVS ~9,900 US stores, Walgreens ~8,000 in 2024), discount retailers (Dollar General ~19,600 stores in 2024), fitness (Planet Fitness ~2,600 US clubs) and service providers fill complementary categories and diversify income, reducing reliance on any single sector. Portfolio-wide deals can accelerate lease-up and renewals, while data-driven placement boosts sales productivity and tenant retention.
Debt and equity capital providers
Banks, life insurers and bond investors provide revolving credit and mortgage financing, with lending terms in 2024 shaped by occupancy, NOI trends and asset quality. With the Fed funds target averaging 5.25–5.50% in 2024, favorable pricing still required strong cashflows and low vacancy. Stable lender relationships enable opportunistic acquisitions and refinancing. Equity investors support growth via accretive public-market raises.
Leasing brokers and property service vendors
Leasing brokers expand deal flow and tenant reach in target submarkets, with brokered transactions accounting for a majority of retail leases in 2024 as investors prioritized local market expertise amidst slower transaction volumes.
Facility managers, landscapers, and security firms uphold property standards and reduce tenant churn; professional management typically cuts reactive maintenance costs and vacancy downtime.
Vendor SLAs ensure responsiveness and cost control through KPIs (response time, completion rate, cost per SQFT), protecting NOI and brand reputation.
- Broker networks: expanded deal flow, localized tenant sourcing
- Facility vendors: maintain standards, reduce churn
- SLAs: KPI-driven cost and response control
- Outcome: stronger brand and tenant satisfaction
Municipalities and developers
Municipalities and developers shape entitlements, zoning and redevelopment timelines; coordinated permitting and signage agreements can accelerate projects—U.S. retail vacancy was about 4.5% in 2024, heightening focus on repositioning. Co-development partners de-risk construction and re-tenanting, while community alignment improves acceptance and long-term NAV.
- Entitlements: municipal approval essential
- Permits/signage: unlock access and traffic improvements
- Co-development: shared capex/risk
- Community: boosts leasing and value
Grocery anchor and pharmacy partnerships stabilize rents, drive traffic, and enable deals
Partnerships with grocery anchors (US grocery sales ~$800B in 2024) and pharmacies/discount chains (CVS 9,900 stores, Walgreens 8,000, Dollar General 19,600 in 2024) secure traffic and diversify income. Lenders and equity (Fed funds 5.25–5.50% avg 2024) enable acquisitions and refinancing. Municipal and co-development partners reduce entitlement risk amid 4.5% retail vacancy in 2024.
| Partner | Role | 2024 metric |
|---|---|---|
| Grocery anchors | Stabilize rent rolls | $800B sales |
| Pharmacies/discount | Drive traffic/diversify | CVS 9,900; DG 19,600 |
| Lenders | Financing | Fed funds 5.25–5.50% |
| Municipal/dev | Entitlements/reposition | Retail vacancy 4.5% |
What is included in the product
Detailed Word Document
A comprehensive Business Model Canvas tailored to Retail Opportunity Investments, detailing customer segments, value propositions, channels, revenue streams, key partners, activities, resources, cost structure, and investor-focused metrics. Includes competitive advantage analysis and SWOT insights, organized for presentations, funding discussions, and validation of retail real estate strategies.
Customizable Excel Spreadsheet
High-level view of Retail Opportunity Investments’ business model highlighting tenant mix, lease economics, and portfolio risks in editable cells to quickly relieve analysis and alignment pain points for teams and boards.
Activities
Targeted acquisitions and dispositions
Sourcing grocery-anchored, infill centers in high-barrier West Coast markets like Los Angeles and San Francisco drives portfolio quality and resilience. Underwriting emphasizes tenant credit, trade-area density and rent spreads to preserve cash flow. Capital recycling exits non-core assets to fund higher-yield opportunities. Disciplined timing manages interest-rate and valuation cycles amid 2024 Fed funds at 5.25–5.50%.
Leasing and tenant mix optimization
Proactive leasing targets necessity-based categories to drive footfall, aiming to lower vacancy toward sub-5% levels; in 2024 operators prioritized grocers and pharmacies as anchors. Curating complements to anchors boosts cross-shopping and dwell time, with rent-share deals (5–10% of sales) common in 2024 to align risk and upside. Data-informed merchandising and 7–10% occupancy-cost targets strengthen sales-per-sqft and occupancy ratios.
Asset management and operations
Daily operations focus on curb appeal, safety and uptime to preserve shopper experience and limit revenue disruption. CAM budget management, vendor oversight and energy projects such as LED retrofits (typical energy savings ~30%) constrain operating expenses. Routine and preventative maintenance extends asset life, while KPI tracking of NOI, foot traffic and tenant health — with occupancy targets above 90% — guides performance.
Redevelopment and value-add projects
Re-tenanting boxes, pad splits and façade upgrades commonly boost achieved rents by 10–30% versus legacy leases, while entitlement work unlocks outparcel value and modern formats (drive-thrus, last-mile lockers) that can add $50k–$250k annual NOI per pad in 2024 markets. Capex prioritization focuses on projects targeting 12–20% IRRs; phased execution reduces downtime and tenant disruption, preserving cash flow.
- Rent uplift: 10–30%
- Outparcel NOI potential: $50k–$250k
- Target IRR: 12–20%
- Phased execution: lower vacancy loss
Financing and investor relations
Active balance sheet management targets loan-to-value of 40–60% and 12–24 months of liquidity to optimize leverage and flexibility. Strategic refinancing locks in favorable rates and duration amid 2024 market volatility, preserving cashflow. Transparent quarterly reporting plus ESG and community updates strengthen investor trust and access to capital.
- Target LTV 40–60%
- Liquidity buffer 12–24 months
- Quarterly reporting + ESG KPIs
- Refinance to match duration/rates
Grocery-anchored infill LA/SF: prioritize grocers, hold vacancy 5%
Sourcing grocery-anchored infill in LA/SF preserves cash flow; underwriting stresses tenant credit, trade-area density and 2024 Fed funds at 5.25–5.50%. Proactive leasing targets grocers/pharmacies to drive vacancy <5% and rent-share 5–10%; re-tenanting and pad work lift rents 10–30%. Active balance-sheet targets LTV 40–60% and 12–24 months liquidity; LED retrofits save ~30% energy.
| Metric | 2024 Value |
|---|---|
| Vacancy target | <5% |
| Rent uplift | 10–30% |
| Outparcel NOI | $50k–$250k |
| Target IRR | 12–20% |
| Target LTV | 40–60% |
Preview Before You Purchase
Business Model Canvas
The document previewed here is the actual Retail Opportunity Investments Business Model Canvas you will receive—no mockups or samples. Upon purchase you’ll get this same complete, editable file ready to use for strategy, presentation, and analysis in Word and Excel formats.
Description
Retail Opportunity Investments: Business Model Canvas Snapshot for Investors
Unlock the strategic blueprint behind Retail Opportunity Investments with our concise Business Model Canvas preview. This snapshot shows core value propositions, customer segments, and revenue levers that drive performance. Purchase the full Canvas for a section-by-section breakdown, financial implications, and editable Word/Excel files. Perfect for investors, strategists, and analysts seeking actionable insights.
Partnerships
Grocery anchor tenant alliances
Partnerships with creditworthy grocery chains such as Kroger, Albertsons and Publix secure daily foot traffic and stabilize rent rolls; US grocery sales were roughly $800 billion in 2024. Anchors boost center visibility and attract complementary tenants, improving tenant mix and sales per sq ft. Long-term anchor leases typically run 10–25 years, reducing turnover risk and supporting favorable financing. Co-marketing and coordinated events further enhance center performance and shopper frequency.
National and regional retailers
Relationships with pharmacies (CVS ~9,900 US stores, Walgreens ~8,000 in 2024), discount retailers (Dollar General ~19,600 stores in 2024), fitness (Planet Fitness ~2,600 US clubs) and service providers fill complementary categories and diversify income, reducing reliance on any single sector. Portfolio-wide deals can accelerate lease-up and renewals, while data-driven placement boosts sales productivity and tenant retention.
Debt and equity capital providers
Banks, life insurers and bond investors provide revolving credit and mortgage financing, with lending terms in 2024 shaped by occupancy, NOI trends and asset quality. With the Fed funds target averaging 5.25–5.50% in 2024, favorable pricing still required strong cashflows and low vacancy. Stable lender relationships enable opportunistic acquisitions and refinancing. Equity investors support growth via accretive public-market raises.
Leasing brokers and property service vendors
Leasing brokers expand deal flow and tenant reach in target submarkets, with brokered transactions accounting for a majority of retail leases in 2024 as investors prioritized local market expertise amidst slower transaction volumes.
Facility managers, landscapers, and security firms uphold property standards and reduce tenant churn; professional management typically cuts reactive maintenance costs and vacancy downtime.
Vendor SLAs ensure responsiveness and cost control through KPIs (response time, completion rate, cost per SQFT), protecting NOI and brand reputation.
- Broker networks: expanded deal flow, localized tenant sourcing
- Facility vendors: maintain standards, reduce churn
- SLAs: KPI-driven cost and response control
- Outcome: stronger brand and tenant satisfaction
Municipalities and developers
Municipalities and developers shape entitlements, zoning and redevelopment timelines; coordinated permitting and signage agreements can accelerate projects—U.S. retail vacancy was about 4.5% in 2024, heightening focus on repositioning. Co-development partners de-risk construction and re-tenanting, while community alignment improves acceptance and long-term NAV.
- Entitlements: municipal approval essential
- Permits/signage: unlock access and traffic improvements
- Co-development: shared capex/risk
- Community: boosts leasing and value
Grocery anchor and pharmacy partnerships stabilize rents, drive traffic, and enable deals
Partnerships with grocery anchors (US grocery sales ~$800B in 2024) and pharmacies/discount chains (CVS 9,900 stores, Walgreens 8,000, Dollar General 19,600 in 2024) secure traffic and diversify income. Lenders and equity (Fed funds 5.25–5.50% avg 2024) enable acquisitions and refinancing. Municipal and co-development partners reduce entitlement risk amid 4.5% retail vacancy in 2024.
| Partner | Role | 2024 metric |
|---|---|---|
| Grocery anchors | Stabilize rent rolls | $800B sales |
| Pharmacies/discount | Drive traffic/diversify | CVS 9,900; DG 19,600 |
| Lenders | Financing | Fed funds 5.25–5.50% |
| Municipal/dev | Entitlements/reposition | Retail vacancy 4.5% |
What is included in the product
Detailed Word Document
A comprehensive Business Model Canvas tailored to Retail Opportunity Investments, detailing customer segments, value propositions, channels, revenue streams, key partners, activities, resources, cost structure, and investor-focused metrics. Includes competitive advantage analysis and SWOT insights, organized for presentations, funding discussions, and validation of retail real estate strategies.
Customizable Excel Spreadsheet
High-level view of Retail Opportunity Investments’ business model highlighting tenant mix, lease economics, and portfolio risks in editable cells to quickly relieve analysis and alignment pain points for teams and boards.
Activities
Targeted acquisitions and dispositions
Sourcing grocery-anchored, infill centers in high-barrier West Coast markets like Los Angeles and San Francisco drives portfolio quality and resilience. Underwriting emphasizes tenant credit, trade-area density and rent spreads to preserve cash flow. Capital recycling exits non-core assets to fund higher-yield opportunities. Disciplined timing manages interest-rate and valuation cycles amid 2024 Fed funds at 5.25–5.50%.
Leasing and tenant mix optimization
Proactive leasing targets necessity-based categories to drive footfall, aiming to lower vacancy toward sub-5% levels; in 2024 operators prioritized grocers and pharmacies as anchors. Curating complements to anchors boosts cross-shopping and dwell time, with rent-share deals (5–10% of sales) common in 2024 to align risk and upside. Data-informed merchandising and 7–10% occupancy-cost targets strengthen sales-per-sqft and occupancy ratios.
Asset management and operations
Daily operations focus on curb appeal, safety and uptime to preserve shopper experience and limit revenue disruption. CAM budget management, vendor oversight and energy projects such as LED retrofits (typical energy savings ~30%) constrain operating expenses. Routine and preventative maintenance extends asset life, while KPI tracking of NOI, foot traffic and tenant health — with occupancy targets above 90% — guides performance.
Redevelopment and value-add projects
Re-tenanting boxes, pad splits and façade upgrades commonly boost achieved rents by 10–30% versus legacy leases, while entitlement work unlocks outparcel value and modern formats (drive-thrus, last-mile lockers) that can add $50k–$250k annual NOI per pad in 2024 markets. Capex prioritization focuses on projects targeting 12–20% IRRs; phased execution reduces downtime and tenant disruption, preserving cash flow.
- Rent uplift: 10–30%
- Outparcel NOI potential: $50k–$250k
- Target IRR: 12–20%
- Phased execution: lower vacancy loss
Financing and investor relations
Active balance sheet management targets loan-to-value of 40–60% and 12–24 months of liquidity to optimize leverage and flexibility. Strategic refinancing locks in favorable rates and duration amid 2024 market volatility, preserving cashflow. Transparent quarterly reporting plus ESG and community updates strengthen investor trust and access to capital.
- Target LTV 40–60%
- Liquidity buffer 12–24 months
- Quarterly reporting + ESG KPIs
- Refinance to match duration/rates
Grocery-anchored infill LA/SF: prioritize grocers, hold vacancy 5%
Sourcing grocery-anchored infill in LA/SF preserves cash flow; underwriting stresses tenant credit, trade-area density and 2024 Fed funds at 5.25–5.50%. Proactive leasing targets grocers/pharmacies to drive vacancy <5% and rent-share 5–10%; re-tenanting and pad work lift rents 10–30%. Active balance-sheet targets LTV 40–60% and 12–24 months liquidity; LED retrofits save ~30% energy.
| Metric | 2024 Value |
|---|---|
| Vacancy target | <5% |
| Rent uplift | 10–30% |
| Outparcel NOI | $50k–$250k |
| Target IRR | 12–20% |
| Target LTV | 40–60% |
Preview Before You Purchase
Business Model Canvas
The document previewed here is the actual Retail Opportunity Investments Business Model Canvas you will receive—no mockups or samples. Upon purchase you’ll get this same complete, editable file ready to use for strategy, presentation, and analysis in Word and Excel formats.











