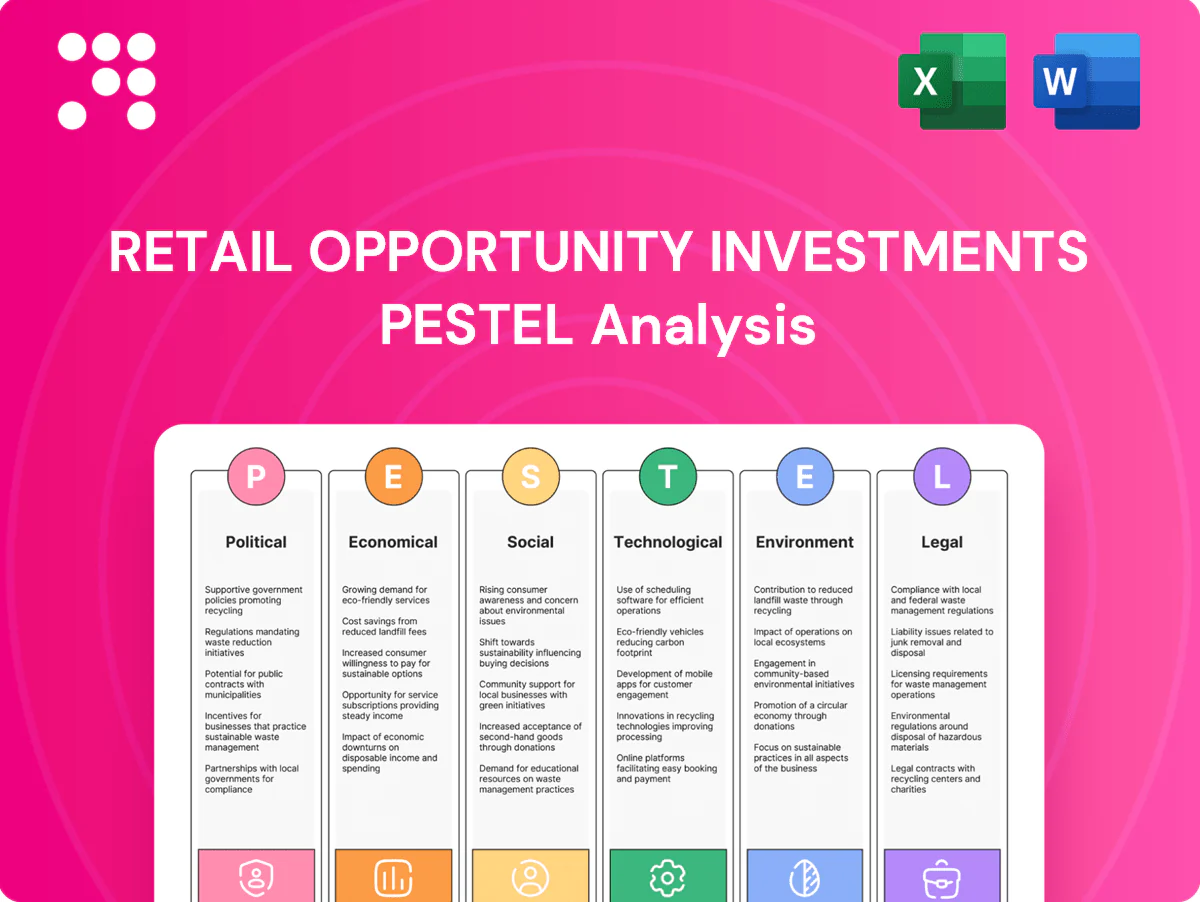
Retail Opportunity Investments PESTLE Analysis

Skip the Research. Get the Strategy.
Discover how political, economic, social, technological, legal and environmental forces shape Retail Opportunity Investments' outlook. Our concise PESTLE highlights key risks and opportunities to inform investment and strategy decisions. Purchase the full analysis to get actionable, downloadable insights now.
Political factors

Zoning and permitting regimes
Local land-use boards along the West Coast exercise strict control over retail site approvals and renovations, frequently creating multi-stage reviews that delay leasing and value-add plans. Lengthy permitting cycles can stretch months to over a year in complex jurisdictions. Active stakeholder engagement and entitlement expertise reduce timeline and cost risk. Cities such as Los Angeles and San Francisco cut parking minimums in 2022, altering project assumptions.
State and local tax policy
Changes in property tax assessments and transfer taxes—often up to 2% in major U.S. markets—directly reduce NOI and transaction yields by comparable margins; California's Proposition 13 ties reassessment to ownership change, so structuring around reassessment triggers is critical for acquisitions. Rising municipal levies and ballot measures increase recurring costs, while IRA energy tax credits can offset about 30% of upgrade costs.

Public safety and urban policy
City-level policing, homelessness, and retail-theft policies directly affect tenant sales and occupancy by shaping perceived safety and loss rates. Visible improvements such as lighting and patrols measurably boost shopper confidence and dwell time. Owners frequently co-fund security and CPTED upgrades to protect rents and sales. Over 1,000 BIDs nationwide provide models for policy collaboration to stabilize trade areas.

Infrastructure and transit investments
- IIJA $1.2 trillion
- Ridership ~75% of 2019 (2024)
- Last‑mile/curb mgmt boosts grocery visits
- Align capex timing with public works
Incentives and redevelopment priorities
Local governments often target revitalization of older strip centers with incentives such as the federal 20% historic rehabilitation tax credit and municipal façade grants commonly ranging from 10,000–100,000 USD; priority typically favors necessity retail and mixed-use conversions. Combining façade grants, density bonuses (often up to 35% in some U.S. jurisdictions) and tax credits can boost project IRRs by roughly 200–500 basis points; political will determines program scale and permit timelines.
- Incentives: federal 20% rehab tax credit
- Façade grants: 10,000–100,000 USD
- Density bonuses: up to 35% in some jurisdictions
- IRR uplift: ~200–500 bps
- Political will: affects scale and permit speed
Policy risks trim yields; IIJA $1.2T and IRA credits lift retail IRRs 200-500 bps
Political factors materially shape retail ROI: land‑use delays (permits >12 months in complex West Coast jurisdictions) and transfer taxes (up to 2%) cut yields, while IIJA $1.2T transit spending and 2024 ridership ~75% of 2019 support rents. Incentives—IRA energy credits (~30% of upgrade cost), federal 20% rehab tax credit, façade grants ($10k–$100k)—can lift IRRs ~200–500 bps.
| Metric | Value |
|---|---|
| IIJA | $1.2T |
| Transit ridership (2024) | ~75% of 2019 |
| Transfer tax | Up to 2% |
| IRA energy credit | ~30% capex |
| Rehab tax credit | 20% |
What is included in the product
 Detailed Word Document
Explores how macro-environmental factors uniquely affect Retail Opportunity Investments across Political, Economic, Social, Technological, Environmental, and Legal dimensions, with data-backed trends and region-specific insights to identify threats, opportunities, and forward-looking scenarios for executives, investors, and strategists.

 Customizable Excel Spreadsheet
Condenses the Retail Opportunity Investments PESTLE into a single-page reference, visually segmented by category for quick stakeholder alignment and slide-ready insertion; editable notes let teams adapt insights to region or business line.
Economic factors

Interest rates and cap rates
REIT valuations and acquisition math are highly sensitive to funding costs: with the Fed funds rate at 5.25–5.50% (July 2025) and 10‑yr Treasury around 4.1%, financing pushes returns required by buyers. Rising rates have widened cap‑rate spreads—retail cap rates near 7% in early 2025—slowing deal flow as pricing gaps persist. Balance sheet discipline and staggered maturities protect dividends, while impending refinancing windows dictate disposition versus hold decisions.
Consumer demand for essentials
Grocery-anchored centers benefit from non-discretionary spending, keeping basket size and foot-traffic resilient and supporting tenant health and rent collections. Empirical trends through 2024 show essential grocery demand outpaced discretionary retail, cushioning occupancy and sales volatility. Inflation (CPI ~3.4% in 2024) can lift nominal sales but squeezes margins for tenants. Rent steps indexed to CPI provide a partial hedge against rising operating costs.

Tenant credit and small business health
Local service and food tenants face wage and input cost pressures, with food-away-from-home CPI rising about 4.0% YoY in 2024, squeezing margins for small operators.
Strong anchor performance — malls and grocers posted roughly 3–4% same-store sales gains in 2024 — backstops inline tenant traffic and reduces churn.
Proactive leasing and flexible formats (pop-ups, smaller footprints) lower vacancy friction, helping keep neighborhood-center vacancy near 5.1% in 2024.
Monitoring tenant credit metrics and rent coverage ratios enables early interventions and blend-and-extend strategies to limit forced turnovers and preserve cash flow.

Labor and construction costs
Elevated materials and labor costs—up about 7% year-over-year in 2024—push TI and redevelopment budgets higher, compressing returns as longer lead times delay lease-up and cash flow timing. Phased capex and standardized spec levels reduce exposure to spot-price spikes and scheduling risk. Strategic vendor partnerships and bulk procurement have cut project unit costs by mid-single digits in recent programs.
- TI/redev budgets: pressure from +7% 2024 cost inflator
- Lease-up: prolonged by extended lead times, lowering short-term IRR
- Controls: phased capex and spec standards limit overruns
- Sourcing: vendor deals and bulk buys reduce unit costs ~3–6%
E-commerce and omnichannel impacts
Global e-commerce reached about 22.3% of retail sales in 2024 while US online grocery penetration is ~11%, shifting demand but boosting grocery click-and-collect; omnichannel tenants show ~20% higher visit frequency, keeping centers relevant. Allocating 5–10% of parking for pickup sustains traffic with minimal TI; undifferentiated soft goods can see turnover rates up to twice that of experiential tenants.
- e‑commerce share 22.3% (2024)
- US online grocery ~11%
- Omnichannel +20% visits
- Pickup parking 5–10%
- Soft goods turnover up to 2x
Policy risks trim yields; IIJA $1.2T and IRA credits lift retail IRRs 200-500 bps
Higher funding costs (Fed funds 5.25–5.50% July 2025; 10y ~4.1%) lift required returns and keep retail cap rates near 7% (early 2025), slowing transactions. Grocery-anchored resilience, CPI ~3.4% (2024) and omnichannel gains (e‑commerce 22.3%, online grocery 11% in 2024) support occupancy despite TI cost inflation ~+7% (2024) and 5.1% vacancy (2024).
| Metric | Value |
|---|---|
| Fed funds (Jul 2025) | 5.25–5.50% |
| 10‑yr Treasury | ~4.1% |
| Retail cap rate | ~7% (early 2025) |
| CPI (2024) | 3.4% |
| E‑commerce (2024) | 22.3% |
| Online grocery (US, 2024) | ~11% |
| Vacancy (neighborhood, 2024) | 5.1% |
| TI/redev cost inflator (2024) | +7% |
Preview the Actual Deliverable
Retail Opportunity Investments PESTLE Analysis
This Retail Opportunity Investments PESTLE Analysis delivers concise macro-environmental insights tailored for retail real estate investors and strategists. The preview shown here is the exact document you’ll receive after purchase—fully formatted and ready to use. Use it for risk assessment, strategic planning, and opportunity identification immediately after download.

Skip the Research. Get the Strategy.
Discover how political, economic, social, technological, legal and environmental forces shape Retail Opportunity Investments' outlook. Our concise PESTLE highlights key risks and opportunities to inform investment and strategy decisions. Purchase the full analysis to get actionable, downloadable insights now.
Political factors
Zoning and permitting regimes
Local land-use boards along the West Coast exercise strict control over retail site approvals and renovations, frequently creating multi-stage reviews that delay leasing and value-add plans. Lengthy permitting cycles can stretch months to over a year in complex jurisdictions. Active stakeholder engagement and entitlement expertise reduce timeline and cost risk. Cities such as Los Angeles and San Francisco cut parking minimums in 2022, altering project assumptions.
State and local tax policy
Changes in property tax assessments and transfer taxes—often up to 2% in major U.S. markets—directly reduce NOI and transaction yields by comparable margins; California's Proposition 13 ties reassessment to ownership change, so structuring around reassessment triggers is critical for acquisitions. Rising municipal levies and ballot measures increase recurring costs, while IRA energy tax credits can offset about 30% of upgrade costs.
Public safety and urban policy
City-level policing, homelessness, and retail-theft policies directly affect tenant sales and occupancy by shaping perceived safety and loss rates. Visible improvements such as lighting and patrols measurably boost shopper confidence and dwell time. Owners frequently co-fund security and CPTED upgrades to protect rents and sales. Over 1,000 BIDs nationwide provide models for policy collaboration to stabilize trade areas.
Infrastructure and transit investments
- IIJA $1.2 trillion
- Ridership ~75% of 2019 (2024)
- Last‑mile/curb mgmt boosts grocery visits
- Align capex timing with public works
Incentives and redevelopment priorities
Local governments often target revitalization of older strip centers with incentives such as the federal 20% historic rehabilitation tax credit and municipal façade grants commonly ranging from 10,000–100,000 USD; priority typically favors necessity retail and mixed-use conversions. Combining façade grants, density bonuses (often up to 35% in some U.S. jurisdictions) and tax credits can boost project IRRs by roughly 200–500 basis points; political will determines program scale and permit timelines.
- Incentives: federal 20% rehab tax credit
- Façade grants: 10,000–100,000 USD
- Density bonuses: up to 35% in some jurisdictions
- IRR uplift: ~200–500 bps
- Political will: affects scale and permit speed
Policy risks trim yields; IIJA $1.2T and IRA credits lift retail IRRs 200-500 bps
Political factors materially shape retail ROI: land‑use delays (permits >12 months in complex West Coast jurisdictions) and transfer taxes (up to 2%) cut yields, while IIJA $1.2T transit spending and 2024 ridership ~75% of 2019 support rents. Incentives—IRA energy credits (~30% of upgrade cost), federal 20% rehab tax credit, façade grants ($10k–$100k)—can lift IRRs ~200–500 bps.
| Metric | Value |
|---|---|
| IIJA | $1.2T |
| Transit ridership (2024) | ~75% of 2019 |
| Transfer tax | Up to 2% |
| IRA energy credit | ~30% capex |
| Rehab tax credit | 20% |
What is included in the product
Detailed Word Document
Explores how macro-environmental factors uniquely affect Retail Opportunity Investments across Political, Economic, Social, Technological, Environmental, and Legal dimensions, with data-backed trends and region-specific insights to identify threats, opportunities, and forward-looking scenarios for executives, investors, and strategists.
Customizable Excel Spreadsheet
Condenses the Retail Opportunity Investments PESTLE into a single-page reference, visually segmented by category for quick stakeholder alignment and slide-ready insertion; editable notes let teams adapt insights to region or business line.
Economic factors
Interest rates and cap rates
REIT valuations and acquisition math are highly sensitive to funding costs: with the Fed funds rate at 5.25–5.50% (July 2025) and 10‑yr Treasury around 4.1%, financing pushes returns required by buyers. Rising rates have widened cap‑rate spreads—retail cap rates near 7% in early 2025—slowing deal flow as pricing gaps persist. Balance sheet discipline and staggered maturities protect dividends, while impending refinancing windows dictate disposition versus hold decisions.
Consumer demand for essentials
Grocery-anchored centers benefit from non-discretionary spending, keeping basket size and foot-traffic resilient and supporting tenant health and rent collections. Empirical trends through 2024 show essential grocery demand outpaced discretionary retail, cushioning occupancy and sales volatility. Inflation (CPI ~3.4% in 2024) can lift nominal sales but squeezes margins for tenants. Rent steps indexed to CPI provide a partial hedge against rising operating costs.
Tenant credit and small business health
Local service and food tenants face wage and input cost pressures, with food-away-from-home CPI rising about 4.0% YoY in 2024, squeezing margins for small operators.
Strong anchor performance — malls and grocers posted roughly 3–4% same-store sales gains in 2024 — backstops inline tenant traffic and reduces churn.
Proactive leasing and flexible formats (pop-ups, smaller footprints) lower vacancy friction, helping keep neighborhood-center vacancy near 5.1% in 2024.
Monitoring tenant credit metrics and rent coverage ratios enables early interventions and blend-and-extend strategies to limit forced turnovers and preserve cash flow.
Labor and construction costs
Elevated materials and labor costs—up about 7% year-over-year in 2024—push TI and redevelopment budgets higher, compressing returns as longer lead times delay lease-up and cash flow timing. Phased capex and standardized spec levels reduce exposure to spot-price spikes and scheduling risk. Strategic vendor partnerships and bulk procurement have cut project unit costs by mid-single digits in recent programs.
- TI/redev budgets: pressure from +7% 2024 cost inflator
- Lease-up: prolonged by extended lead times, lowering short-term IRR
- Controls: phased capex and spec standards limit overruns
- Sourcing: vendor deals and bulk buys reduce unit costs ~3–6%
E-commerce and omnichannel impacts
Global e-commerce reached about 22.3% of retail sales in 2024 while US online grocery penetration is ~11%, shifting demand but boosting grocery click-and-collect; omnichannel tenants show ~20% higher visit frequency, keeping centers relevant. Allocating 5–10% of parking for pickup sustains traffic with minimal TI; undifferentiated soft goods can see turnover rates up to twice that of experiential tenants.
- e‑commerce share 22.3% (2024)
- US online grocery ~11%
- Omnichannel +20% visits
- Pickup parking 5–10%
- Soft goods turnover up to 2x
Policy risks trim yields; IIJA $1.2T and IRA credits lift retail IRRs 200-500 bps
Higher funding costs (Fed funds 5.25–5.50% July 2025; 10y ~4.1%) lift required returns and keep retail cap rates near 7% (early 2025), slowing transactions. Grocery-anchored resilience, CPI ~3.4% (2024) and omnichannel gains (e‑commerce 22.3%, online grocery 11% in 2024) support occupancy despite TI cost inflation ~+7% (2024) and 5.1% vacancy (2024).
| Metric | Value |
|---|---|
| Fed funds (Jul 2025) | 5.25–5.50% |
| 10‑yr Treasury | ~4.1% |
| Retail cap rate | ~7% (early 2025) |
| CPI (2024) | 3.4% |
| E‑commerce (2024) | 22.3% |
| Online grocery (US, 2024) | ~11% |
| Vacancy (neighborhood, 2024) | 5.1% |
| TI/redev cost inflator (2024) | +7% |
Preview the Actual Deliverable
Retail Opportunity Investments PESTLE Analysis
This Retail Opportunity Investments PESTLE Analysis delivers concise macro-environmental insights tailored for retail real estate investors and strategists. The preview shown here is the exact document you’ll receive after purchase—fully formatted and ready to use. Use it for risk assessment, strategic planning, and opportunity identification immediately after download.
Description
Skip the Research. Get the Strategy.
Discover how political, economic, social, technological, legal and environmental forces shape Retail Opportunity Investments' outlook. Our concise PESTLE highlights key risks and opportunities to inform investment and strategy decisions. Purchase the full analysis to get actionable, downloadable insights now.
Political factors
Zoning and permitting regimes
Local land-use boards along the West Coast exercise strict control over retail site approvals and renovations, frequently creating multi-stage reviews that delay leasing and value-add plans. Lengthy permitting cycles can stretch months to over a year in complex jurisdictions. Active stakeholder engagement and entitlement expertise reduce timeline and cost risk. Cities such as Los Angeles and San Francisco cut parking minimums in 2022, altering project assumptions.
State and local tax policy
Changes in property tax assessments and transfer taxes—often up to 2% in major U.S. markets—directly reduce NOI and transaction yields by comparable margins; California's Proposition 13 ties reassessment to ownership change, so structuring around reassessment triggers is critical for acquisitions. Rising municipal levies and ballot measures increase recurring costs, while IRA energy tax credits can offset about 30% of upgrade costs.
Public safety and urban policy
City-level policing, homelessness, and retail-theft policies directly affect tenant sales and occupancy by shaping perceived safety and loss rates. Visible improvements such as lighting and patrols measurably boost shopper confidence and dwell time. Owners frequently co-fund security and CPTED upgrades to protect rents and sales. Over 1,000 BIDs nationwide provide models for policy collaboration to stabilize trade areas.
Infrastructure and transit investments
- IIJA $1.2 trillion
- Ridership ~75% of 2019 (2024)
- Last‑mile/curb mgmt boosts grocery visits
- Align capex timing with public works
Incentives and redevelopment priorities
Local governments often target revitalization of older strip centers with incentives such as the federal 20% historic rehabilitation tax credit and municipal façade grants commonly ranging from 10,000–100,000 USD; priority typically favors necessity retail and mixed-use conversions. Combining façade grants, density bonuses (often up to 35% in some U.S. jurisdictions) and tax credits can boost project IRRs by roughly 200–500 basis points; political will determines program scale and permit timelines.
- Incentives: federal 20% rehab tax credit
- Façade grants: 10,000–100,000 USD
- Density bonuses: up to 35% in some jurisdictions
- IRR uplift: ~200–500 bps
- Political will: affects scale and permit speed
Policy risks trim yields; IIJA $1.2T and IRA credits lift retail IRRs 200-500 bps
Political factors materially shape retail ROI: land‑use delays (permits >12 months in complex West Coast jurisdictions) and transfer taxes (up to 2%) cut yields, while IIJA $1.2T transit spending and 2024 ridership ~75% of 2019 support rents. Incentives—IRA energy credits (~30% of upgrade cost), federal 20% rehab tax credit, façade grants ($10k–$100k)—can lift IRRs ~200–500 bps.
| Metric | Value |
|---|---|
| IIJA | $1.2T |
| Transit ridership (2024) | ~75% of 2019 |
| Transfer tax | Up to 2% |
| IRA energy credit | ~30% capex |
| Rehab tax credit | 20% |
What is included in the product
Detailed Word Document
Explores how macro-environmental factors uniquely affect Retail Opportunity Investments across Political, Economic, Social, Technological, Environmental, and Legal dimensions, with data-backed trends and region-specific insights to identify threats, opportunities, and forward-looking scenarios for executives, investors, and strategists.
Customizable Excel Spreadsheet
Condenses the Retail Opportunity Investments PESTLE into a single-page reference, visually segmented by category for quick stakeholder alignment and slide-ready insertion; editable notes let teams adapt insights to region or business line.
Economic factors
Interest rates and cap rates
REIT valuations and acquisition math are highly sensitive to funding costs: with the Fed funds rate at 5.25–5.50% (July 2025) and 10‑yr Treasury around 4.1%, financing pushes returns required by buyers. Rising rates have widened cap‑rate spreads—retail cap rates near 7% in early 2025—slowing deal flow as pricing gaps persist. Balance sheet discipline and staggered maturities protect dividends, while impending refinancing windows dictate disposition versus hold decisions.
Consumer demand for essentials
Grocery-anchored centers benefit from non-discretionary spending, keeping basket size and foot-traffic resilient and supporting tenant health and rent collections. Empirical trends through 2024 show essential grocery demand outpaced discretionary retail, cushioning occupancy and sales volatility. Inflation (CPI ~3.4% in 2024) can lift nominal sales but squeezes margins for tenants. Rent steps indexed to CPI provide a partial hedge against rising operating costs.
Tenant credit and small business health
Local service and food tenants face wage and input cost pressures, with food-away-from-home CPI rising about 4.0% YoY in 2024, squeezing margins for small operators.
Strong anchor performance — malls and grocers posted roughly 3–4% same-store sales gains in 2024 — backstops inline tenant traffic and reduces churn.
Proactive leasing and flexible formats (pop-ups, smaller footprints) lower vacancy friction, helping keep neighborhood-center vacancy near 5.1% in 2024.
Monitoring tenant credit metrics and rent coverage ratios enables early interventions and blend-and-extend strategies to limit forced turnovers and preserve cash flow.
Labor and construction costs
Elevated materials and labor costs—up about 7% year-over-year in 2024—push TI and redevelopment budgets higher, compressing returns as longer lead times delay lease-up and cash flow timing. Phased capex and standardized spec levels reduce exposure to spot-price spikes and scheduling risk. Strategic vendor partnerships and bulk procurement have cut project unit costs by mid-single digits in recent programs.
- TI/redev budgets: pressure from +7% 2024 cost inflator
- Lease-up: prolonged by extended lead times, lowering short-term IRR
- Controls: phased capex and spec standards limit overruns
- Sourcing: vendor deals and bulk buys reduce unit costs ~3–6%
E-commerce and omnichannel impacts
Global e-commerce reached about 22.3% of retail sales in 2024 while US online grocery penetration is ~11%, shifting demand but boosting grocery click-and-collect; omnichannel tenants show ~20% higher visit frequency, keeping centers relevant. Allocating 5–10% of parking for pickup sustains traffic with minimal TI; undifferentiated soft goods can see turnover rates up to twice that of experiential tenants.
- e‑commerce share 22.3% (2024)
- US online grocery ~11%
- Omnichannel +20% visits
- Pickup parking 5–10%
- Soft goods turnover up to 2x
Policy risks trim yields; IIJA $1.2T and IRA credits lift retail IRRs 200-500 bps
Higher funding costs (Fed funds 5.25–5.50% July 2025; 10y ~4.1%) lift required returns and keep retail cap rates near 7% (early 2025), slowing transactions. Grocery-anchored resilience, CPI ~3.4% (2024) and omnichannel gains (e‑commerce 22.3%, online grocery 11% in 2024) support occupancy despite TI cost inflation ~+7% (2024) and 5.1% vacancy (2024).
| Metric | Value |
|---|---|
| Fed funds (Jul 2025) | 5.25–5.50% |
| 10‑yr Treasury | ~4.1% |
| Retail cap rate | ~7% (early 2025) |
| CPI (2024) | 3.4% |
| E‑commerce (2024) | 22.3% |
| Online grocery (US, 2024) | ~11% |
| Vacancy (neighborhood, 2024) | 5.1% |
| TI/redev cost inflator (2024) | +7% |
Preview the Actual Deliverable
Retail Opportunity Investments PESTLE Analysis
This Retail Opportunity Investments PESTLE Analysis delivers concise macro-environmental insights tailored for retail real estate investors and strategists. The preview shown here is the exact document you’ll receive after purchase—fully formatted and ready to use. Use it for risk assessment, strategic planning, and opportunity identification immediately after download.











