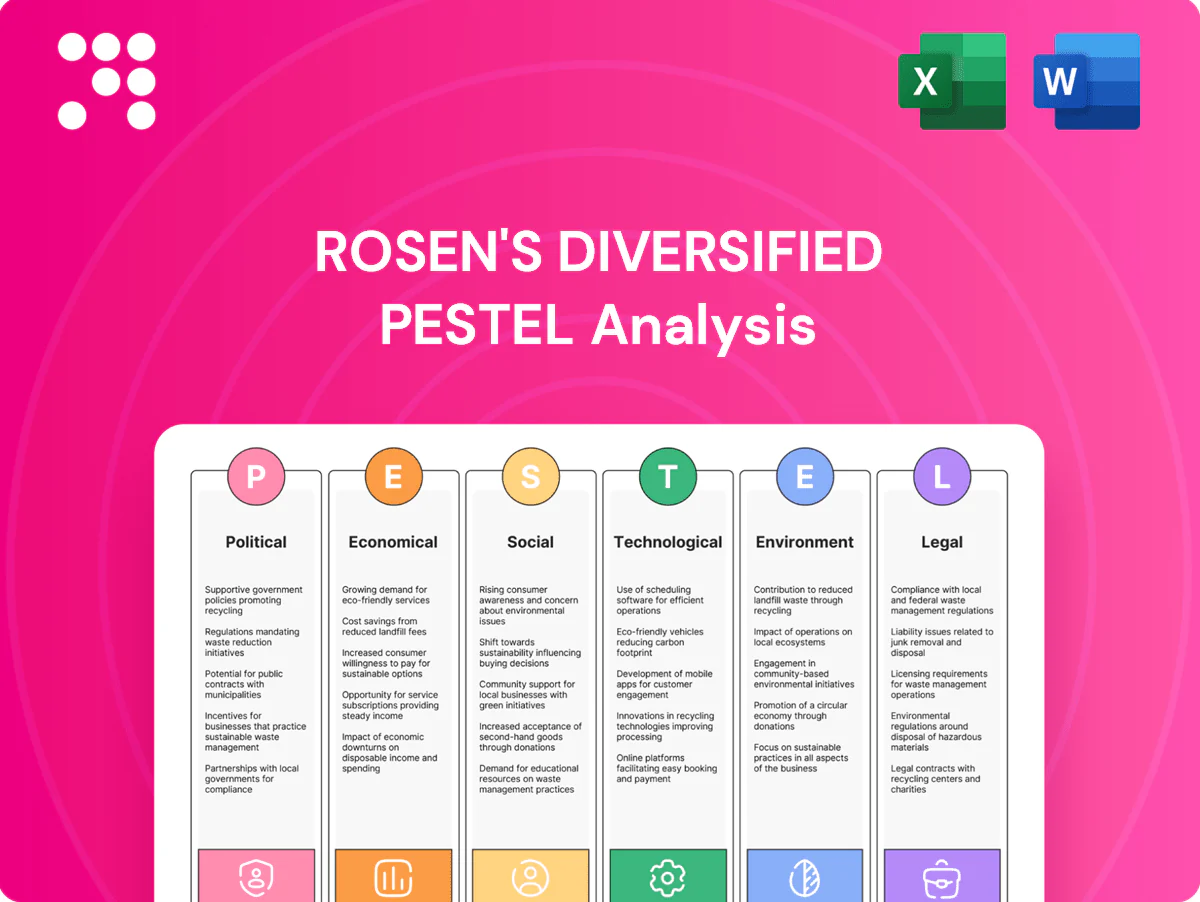
Rosen's Diversified PESTLE Analysis

Your Competitive Advantage Starts with This Report
Gain a competitive edge with our PESTLE Analysis of Rosen's Diversified. Discover how political, economic, social, technological, legal and environmental forces shape its strategy and risk profile. Buy the full, editable report to access deep-dive insights and ready-made slides for immediate use.
Political factors

Biofuel mandates and farm policy
US Renewable Fuel Standard caps conventional ethanol at a 15 billion gallon statutory limit while roughly 40 percent of US corn production is historically used for ethanol, directly linking RFS volumes and Farm Bill supports to ethanol margins and corn availability. Changes to blending targets or tax incentives can materially shift refinery and plant throughput and thus capacity utilization. Strong industry advocacy and regulatory compliance agility mitigate downside risk. Diversification into other energy and food markets buffers policy shocks.
Trade policy and tariffs on meat and grain
Export access for beef and pork and import costs for feed/grain hinge on tariffs and quotas that shift landed prices and margins; China alone accounts for roughly 25% of global pork imports, concentrating tariff risk. Sanitary-phytosanitary rules frequently operate as de facto non-tariff barriers, delaying shipments and cutting volumes. Diplomatic tensions (trade disputes, sanctions) transmit quickly into price swings and volume drops, while active hedging on CME futures and diversified export destinations reduce revenue volatility.

State and local incentives and zoning
Siting plants and real estate projects hinges on permits, tax abatements and community approvals; states and localities often layer incentives around federal programs like the Inflation Reduction Act, which allocates about 369 billion dollars for clean energy. Competing jurisdictions bid for jobs and investment, but political turnover can reverse commitments; proactive stakeholder engagement secures continuity.

Labor and immigration policy
- labor_share: ~40% foreign-born
- wage_level: ~$17/hr (2024)
- automation_impact: up to -30% labor needs
- compliance_value: lowers enforcement risk/preserves contracts
Food security and public health priorities
- focus on domestic processors
- COVID-era plant disruptions led to FSIS continuity actions
- USDA/FSIS coordination essential
- policy-backed support for redundancy and regional capacity
RFS cap 15bn tightens corn for feed; China pork risk, packer concentration, IRA
RFS caps conventional ethanol at 15bn gal; ~40% of US corn historically goes to ethanol, linking policy to feed/corn availability.
Tariffs, SPS rules and China (≈25% of global pork imports) concentrate export risk; trade disputes cause price/volume swings.
Meatpacking: ~40% foreign-born workforce, avg wage ≈$17/hr (2024); automation can cut labor needs up to 30%.
US beef slaughter is highly concentrated (4 firms ≈85% capacity); IRA ~$369bn boosts clean-energy/site incentives.
| Metric | Value |
|---|---|
| RFS cap | 15bn gal |
| Corn→ethanol | ~40% |
| China pork share | ~25% |
| Foreign-born labor | ~40% |
| Avg wage (2024) | $17/hr |
| Concentration | 4 firms ≈85% |
| IRA | $369bn |
What is included in the product
 Detailed Word Document
Explores how Political, Economic, Social, Technological, Environmental, and Legal factors uniquely affect Rosen's Diversified, with data-backed insights and forward-looking implications to help executives and investors identify risks, opportunities, and strategic actions.

 Customizable Excel Spreadsheet
Rosen's Diversified PESTLE condenses complex external risks into a clean, editable summary that’s slide-ready and easily shareable, easing alignment across teams and speeding strategic decision-making.
Economic factors

Commodity price volatility (livestock, corn, natural gas)
Volatility in corn (Dec 2024 futures ~4.70 USD/bu), live cattle (mid‑2024 cash ~169 USD/cwt) and Henry Hub natural gas (~2.80 USD/MMBtu in Jan 2025) drives margin compression in meat and ethanol processing. Basis risk and energy cost swings compound variability, forcing active hedging and flexible feedstock sourcing. Scale and storage optionality materially enhance resilience.
Consumer income and protein demand
Disposable income cycles shift premium versus value protein mixes: post-pandemic normalization and a US personal saving rate near 3.7% in 2024 pushed some consumers toward lower-cost cuts while premium segments still grow. Downturns typically move baskets to value proteins as price-sensitive shoppers trade down; premium cuts can be 2–3x costlier than value cuts. Brand architecture should span price points to capture both tiers, and balancing foodservice (about 55% of US food spend in recent years) versus retail reduces volatility across cycles.

Interest rates and real estate cycles
Higher policy rates—benchmark U.S. fed funds around 5.25–5.50% in 2024–25—raise capex hurdles and depress development valuations, with office and multifamily cap rates moving up roughly 100–200 bps to mid-5s–7s. Construction cost inflation, while easing, still adds 2–4% to budgets and shifts project IRRs. Staggered pipelines and JV structures limit timing and equity exposure; fixed-rate financing secures cashflow predictability.

Fuel prices and logistics costs
Diesel and freight rates drive inbound grain and outbound meat costs; US diesel averaged about 4.0 USD/gal in 2024 and ocean/container rates remained ~60% below 2021 peaks, constraining margins. Network design and modal mix limit inflation pass-through; ethanol prices tracked gasoline closely in 2024–25. Long-term contracts (covering ~50–70% of volumes) stabilize margins.
- Diesel: ~4.0 USD/gal (2024 EIA)
- Container/freight: ~60% down vs 2021
- Contracts cover ~50–70% volumes
Labor availability and wage inflation
Tight labor markets — U.S. unemployment near 3.7% mid‑2025 — raise processing costs and constrain throughput via vacancies and overtime; wage inflation (roughly 3–4% YoY in 2024–25) compresses margins. Targeted training, retention and localized recruiting have cut turnover in some studies by up to 15%, while rising wages shorten automation payback periods. Multi‑site flexibility lets firms reallocate capacity to higher‑throughput locations.
- Tight labor: unemployment ~3.7% (mid‑2025)
- Wage inflation: ~3–4% YoY (2024–25)
- Turnover reduction: up to 15% via HR programs
- Automation ROI improves as wages rise
- Multi‑site capacity reallocation
RFS cap 15bn tightens corn for feed; China pork risk, packer concentration, IRA
Commodity and energy volatility (corn ~4.70 USD/bu Dec‑24; Henry Hub ~2.8 USD/MMBtu Jan‑25) compresses meat and ethanol margins, forcing active hedging and feedstock optionality. Higher policy rates (fed funds ~5.25–5.50% 2024–25) and construction inflation raise capex hurdles; fixed‑rate financing and JV staging mitigate risk. Tight labor (unemployment ~3.7% mid‑2025) and wage inflation (3–4% YoY) increase operating cost pressure.
| Metric | Value (latest) |
|---|---|
| Corn futures | ~4.70 USD/bu (Dec‑24) |
| Henry Hub | ~2.80 USD/MMBtu (Jan‑25) |
| Fed funds | 5.25–5.50% (2024–25) |
| Unemployment | ~3.7% (mid‑2025) |
| Diesel | ~4.0 USD/gal (2024) |
What You See Is What You Get
Rosen's Diversified PESTLE Analysis
The preview shown here is the exact Rosen's Diversified PESTLE Analysis you’ll receive after purchase—fully formatted and ready to use. The layout, content, and structure visible are exactly the final file, professionally structured with no placeholders. After checkout you’ll instantly download this same document, ready for immediate application.

Your Competitive Advantage Starts with This Report
Gain a competitive edge with our PESTLE Analysis of Rosen's Diversified. Discover how political, economic, social, technological, legal and environmental forces shape its strategy and risk profile. Buy the full, editable report to access deep-dive insights and ready-made slides for immediate use.
Political factors
Biofuel mandates and farm policy
US Renewable Fuel Standard caps conventional ethanol at a 15 billion gallon statutory limit while roughly 40 percent of US corn production is historically used for ethanol, directly linking RFS volumes and Farm Bill supports to ethanol margins and corn availability. Changes to blending targets or tax incentives can materially shift refinery and plant throughput and thus capacity utilization. Strong industry advocacy and regulatory compliance agility mitigate downside risk. Diversification into other energy and food markets buffers policy shocks.
Trade policy and tariffs on meat and grain
Export access for beef and pork and import costs for feed/grain hinge on tariffs and quotas that shift landed prices and margins; China alone accounts for roughly 25% of global pork imports, concentrating tariff risk. Sanitary-phytosanitary rules frequently operate as de facto non-tariff barriers, delaying shipments and cutting volumes. Diplomatic tensions (trade disputes, sanctions) transmit quickly into price swings and volume drops, while active hedging on CME futures and diversified export destinations reduce revenue volatility.
State and local incentives and zoning
Siting plants and real estate projects hinges on permits, tax abatements and community approvals; states and localities often layer incentives around federal programs like the Inflation Reduction Act, which allocates about 369 billion dollars for clean energy. Competing jurisdictions bid for jobs and investment, but political turnover can reverse commitments; proactive stakeholder engagement secures continuity.
Labor and immigration policy
- labor_share: ~40% foreign-born
- wage_level: ~$17/hr (2024)
- automation_impact: up to -30% labor needs
- compliance_value: lowers enforcement risk/preserves contracts
Food security and public health priorities
- focus on domestic processors
- COVID-era plant disruptions led to FSIS continuity actions
- USDA/FSIS coordination essential
- policy-backed support for redundancy and regional capacity
RFS cap 15bn tightens corn for feed; China pork risk, packer concentration, IRA
RFS caps conventional ethanol at 15bn gal; ~40% of US corn historically goes to ethanol, linking policy to feed/corn availability.
Tariffs, SPS rules and China (≈25% of global pork imports) concentrate export risk; trade disputes cause price/volume swings.
Meatpacking: ~40% foreign-born workforce, avg wage ≈$17/hr (2024); automation can cut labor needs up to 30%.
US beef slaughter is highly concentrated (4 firms ≈85% capacity); IRA ~$369bn boosts clean-energy/site incentives.
| Metric | Value |
|---|---|
| RFS cap | 15bn gal |
| Corn→ethanol | ~40% |
| China pork share | ~25% |
| Foreign-born labor | ~40% |
| Avg wage (2024) | $17/hr |
| Concentration | 4 firms ≈85% |
| IRA | $369bn |
What is included in the product
Detailed Word Document
Explores how Political, Economic, Social, Technological, Environmental, and Legal factors uniquely affect Rosen's Diversified, with data-backed insights and forward-looking implications to help executives and investors identify risks, opportunities, and strategic actions.
Customizable Excel Spreadsheet
Rosen's Diversified PESTLE condenses complex external risks into a clean, editable summary that’s slide-ready and easily shareable, easing alignment across teams and speeding strategic decision-making.
Economic factors
Commodity price volatility (livestock, corn, natural gas)
Volatility in corn (Dec 2024 futures ~4.70 USD/bu), live cattle (mid‑2024 cash ~169 USD/cwt) and Henry Hub natural gas (~2.80 USD/MMBtu in Jan 2025) drives margin compression in meat and ethanol processing. Basis risk and energy cost swings compound variability, forcing active hedging and flexible feedstock sourcing. Scale and storage optionality materially enhance resilience.
Consumer income and protein demand
Disposable income cycles shift premium versus value protein mixes: post-pandemic normalization and a US personal saving rate near 3.7% in 2024 pushed some consumers toward lower-cost cuts while premium segments still grow. Downturns typically move baskets to value proteins as price-sensitive shoppers trade down; premium cuts can be 2–3x costlier than value cuts. Brand architecture should span price points to capture both tiers, and balancing foodservice (about 55% of US food spend in recent years) versus retail reduces volatility across cycles.
Interest rates and real estate cycles
Higher policy rates—benchmark U.S. fed funds around 5.25–5.50% in 2024–25—raise capex hurdles and depress development valuations, with office and multifamily cap rates moving up roughly 100–200 bps to mid-5s–7s. Construction cost inflation, while easing, still adds 2–4% to budgets and shifts project IRRs. Staggered pipelines and JV structures limit timing and equity exposure; fixed-rate financing secures cashflow predictability.
Fuel prices and logistics costs
Diesel and freight rates drive inbound grain and outbound meat costs; US diesel averaged about 4.0 USD/gal in 2024 and ocean/container rates remained ~60% below 2021 peaks, constraining margins. Network design and modal mix limit inflation pass-through; ethanol prices tracked gasoline closely in 2024–25. Long-term contracts (covering ~50–70% of volumes) stabilize margins.
- Diesel: ~4.0 USD/gal (2024 EIA)
- Container/freight: ~60% down vs 2021
- Contracts cover ~50–70% volumes
Labor availability and wage inflation
Tight labor markets — U.S. unemployment near 3.7% mid‑2025 — raise processing costs and constrain throughput via vacancies and overtime; wage inflation (roughly 3–4% YoY in 2024–25) compresses margins. Targeted training, retention and localized recruiting have cut turnover in some studies by up to 15%, while rising wages shorten automation payback periods. Multi‑site flexibility lets firms reallocate capacity to higher‑throughput locations.
- Tight labor: unemployment ~3.7% (mid‑2025)
- Wage inflation: ~3–4% YoY (2024–25)
- Turnover reduction: up to 15% via HR programs
- Automation ROI improves as wages rise
- Multi‑site capacity reallocation
RFS cap 15bn tightens corn for feed; China pork risk, packer concentration, IRA
Commodity and energy volatility (corn ~4.70 USD/bu Dec‑24; Henry Hub ~2.8 USD/MMBtu Jan‑25) compresses meat and ethanol margins, forcing active hedging and feedstock optionality. Higher policy rates (fed funds ~5.25–5.50% 2024–25) and construction inflation raise capex hurdles; fixed‑rate financing and JV staging mitigate risk. Tight labor (unemployment ~3.7% mid‑2025) and wage inflation (3–4% YoY) increase operating cost pressure.
| Metric | Value (latest) |
|---|---|
| Corn futures | ~4.70 USD/bu (Dec‑24) |
| Henry Hub | ~2.80 USD/MMBtu (Jan‑25) |
| Fed funds | 5.25–5.50% (2024–25) |
| Unemployment | ~3.7% (mid‑2025) |
| Diesel | ~4.0 USD/gal (2024) |
What You See Is What You Get
Rosen's Diversified PESTLE Analysis
The preview shown here is the exact Rosen's Diversified PESTLE Analysis you’ll receive after purchase—fully formatted and ready to use. The layout, content, and structure visible are exactly the final file, professionally structured with no placeholders. After checkout you’ll instantly download this same document, ready for immediate application.
Original: $10.00
-65%$10.00
$3.50Description
Your Competitive Advantage Starts with This Report
Gain a competitive edge with our PESTLE Analysis of Rosen's Diversified. Discover how political, economic, social, technological, legal and environmental forces shape its strategy and risk profile. Buy the full, editable report to access deep-dive insights and ready-made slides for immediate use.
Political factors
Biofuel mandates and farm policy
US Renewable Fuel Standard caps conventional ethanol at a 15 billion gallon statutory limit while roughly 40 percent of US corn production is historically used for ethanol, directly linking RFS volumes and Farm Bill supports to ethanol margins and corn availability. Changes to blending targets or tax incentives can materially shift refinery and plant throughput and thus capacity utilization. Strong industry advocacy and regulatory compliance agility mitigate downside risk. Diversification into other energy and food markets buffers policy shocks.
Trade policy and tariffs on meat and grain
Export access for beef and pork and import costs for feed/grain hinge on tariffs and quotas that shift landed prices and margins; China alone accounts for roughly 25% of global pork imports, concentrating tariff risk. Sanitary-phytosanitary rules frequently operate as de facto non-tariff barriers, delaying shipments and cutting volumes. Diplomatic tensions (trade disputes, sanctions) transmit quickly into price swings and volume drops, while active hedging on CME futures and diversified export destinations reduce revenue volatility.
State and local incentives and zoning
Siting plants and real estate projects hinges on permits, tax abatements and community approvals; states and localities often layer incentives around federal programs like the Inflation Reduction Act, which allocates about 369 billion dollars for clean energy. Competing jurisdictions bid for jobs and investment, but political turnover can reverse commitments; proactive stakeholder engagement secures continuity.
Labor and immigration policy
- labor_share: ~40% foreign-born
- wage_level: ~$17/hr (2024)
- automation_impact: up to -30% labor needs
- compliance_value: lowers enforcement risk/preserves contracts
Food security and public health priorities
- focus on domestic processors
- COVID-era plant disruptions led to FSIS continuity actions
- USDA/FSIS coordination essential
- policy-backed support for redundancy and regional capacity
RFS cap 15bn tightens corn for feed; China pork risk, packer concentration, IRA
RFS caps conventional ethanol at 15bn gal; ~40% of US corn historically goes to ethanol, linking policy to feed/corn availability.
Tariffs, SPS rules and China (≈25% of global pork imports) concentrate export risk; trade disputes cause price/volume swings.
Meatpacking: ~40% foreign-born workforce, avg wage ≈$17/hr (2024); automation can cut labor needs up to 30%.
US beef slaughter is highly concentrated (4 firms ≈85% capacity); IRA ~$369bn boosts clean-energy/site incentives.
| Metric | Value |
|---|---|
| RFS cap | 15bn gal |
| Corn→ethanol | ~40% |
| China pork share | ~25% |
| Foreign-born labor | ~40% |
| Avg wage (2024) | $17/hr |
| Concentration | 4 firms ≈85% |
| IRA | $369bn |
What is included in the product
Detailed Word Document
Explores how Political, Economic, Social, Technological, Environmental, and Legal factors uniquely affect Rosen's Diversified, with data-backed insights and forward-looking implications to help executives and investors identify risks, opportunities, and strategic actions.
Customizable Excel Spreadsheet
Rosen's Diversified PESTLE condenses complex external risks into a clean, editable summary that’s slide-ready and easily shareable, easing alignment across teams and speeding strategic decision-making.
Economic factors
Commodity price volatility (livestock, corn, natural gas)
Volatility in corn (Dec 2024 futures ~4.70 USD/bu), live cattle (mid‑2024 cash ~169 USD/cwt) and Henry Hub natural gas (~2.80 USD/MMBtu in Jan 2025) drives margin compression in meat and ethanol processing. Basis risk and energy cost swings compound variability, forcing active hedging and flexible feedstock sourcing. Scale and storage optionality materially enhance resilience.
Consumer income and protein demand
Disposable income cycles shift premium versus value protein mixes: post-pandemic normalization and a US personal saving rate near 3.7% in 2024 pushed some consumers toward lower-cost cuts while premium segments still grow. Downturns typically move baskets to value proteins as price-sensitive shoppers trade down; premium cuts can be 2–3x costlier than value cuts. Brand architecture should span price points to capture both tiers, and balancing foodservice (about 55% of US food spend in recent years) versus retail reduces volatility across cycles.
Interest rates and real estate cycles
Higher policy rates—benchmark U.S. fed funds around 5.25–5.50% in 2024–25—raise capex hurdles and depress development valuations, with office and multifamily cap rates moving up roughly 100–200 bps to mid-5s–7s. Construction cost inflation, while easing, still adds 2–4% to budgets and shifts project IRRs. Staggered pipelines and JV structures limit timing and equity exposure; fixed-rate financing secures cashflow predictability.
Fuel prices and logistics costs
Diesel and freight rates drive inbound grain and outbound meat costs; US diesel averaged about 4.0 USD/gal in 2024 and ocean/container rates remained ~60% below 2021 peaks, constraining margins. Network design and modal mix limit inflation pass-through; ethanol prices tracked gasoline closely in 2024–25. Long-term contracts (covering ~50–70% of volumes) stabilize margins.
- Diesel: ~4.0 USD/gal (2024 EIA)
- Container/freight: ~60% down vs 2021
- Contracts cover ~50–70% volumes
Labor availability and wage inflation
Tight labor markets — U.S. unemployment near 3.7% mid‑2025 — raise processing costs and constrain throughput via vacancies and overtime; wage inflation (roughly 3–4% YoY in 2024–25) compresses margins. Targeted training, retention and localized recruiting have cut turnover in some studies by up to 15%, while rising wages shorten automation payback periods. Multi‑site flexibility lets firms reallocate capacity to higher‑throughput locations.
- Tight labor: unemployment ~3.7% (mid‑2025)
- Wage inflation: ~3–4% YoY (2024–25)
- Turnover reduction: up to 15% via HR programs
- Automation ROI improves as wages rise
- Multi‑site capacity reallocation
RFS cap 15bn tightens corn for feed; China pork risk, packer concentration, IRA
Commodity and energy volatility (corn ~4.70 USD/bu Dec‑24; Henry Hub ~2.8 USD/MMBtu Jan‑25) compresses meat and ethanol margins, forcing active hedging and feedstock optionality. Higher policy rates (fed funds ~5.25–5.50% 2024–25) and construction inflation raise capex hurdles; fixed‑rate financing and JV staging mitigate risk. Tight labor (unemployment ~3.7% mid‑2025) and wage inflation (3–4% YoY) increase operating cost pressure.
| Metric | Value (latest) |
|---|---|
| Corn futures | ~4.70 USD/bu (Dec‑24) |
| Henry Hub | ~2.80 USD/MMBtu (Jan‑25) |
| Fed funds | 5.25–5.50% (2024–25) |
| Unemployment | ~3.7% (mid‑2025) |
| Diesel | ~4.0 USD/gal (2024) |
What You See Is What You Get
Rosen's Diversified PESTLE Analysis
The preview shown here is the exact Rosen's Diversified PESTLE Analysis you’ll receive after purchase—fully formatted and ready to use. The layout, content, and structure visible are exactly the final file, professionally structured with no placeholders. After checkout you’ll instantly download this same document, ready for immediate application.











