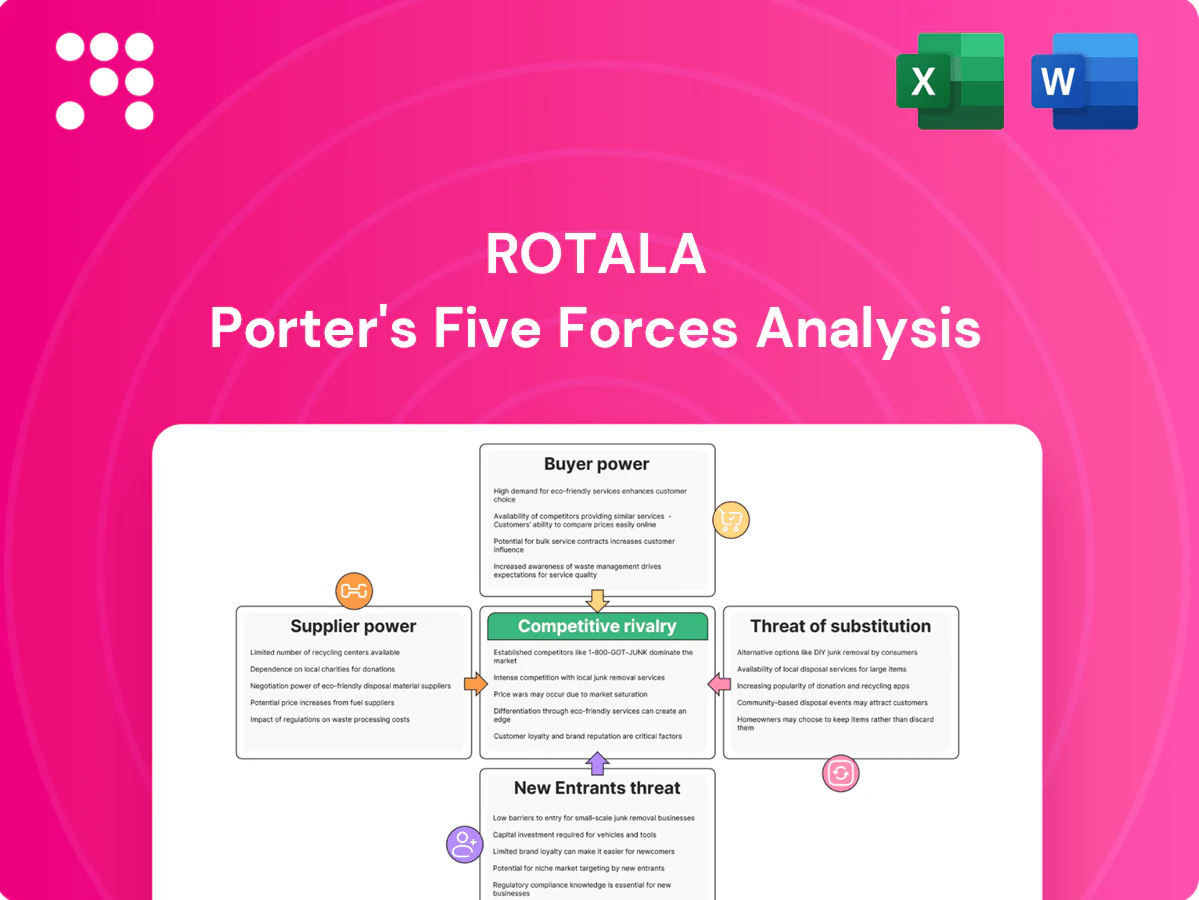
Rotala Porter's Five Forces Analysis

A Must-Have Tool for Decision-Makers
Rotala’s Porter's Five Forces snapshot highlights supplier leverage, buyer power, new-entrant threats, substitutes and rivalry shaping its transport operations. It flags strategic pressures—fleet and maintenance costs, contract tendering and regulatory risk—that directly affect margins and growth. This preview is just the beginning. The full analysis provides a complete strategic snapshot with force-by-force ratings, visuals, and business implications tailored to Rotala.
Suppliers Bargaining Power

Concentrated vehicle OEMs
Concentrated OEMs such as Alexander Dennis, Wrightbus and Volvo give suppliers leverage over price, lead times and specifications; Rotala gains negotiating power with 3–7 year framework orders but loses it during EV demand spikes in 2024. Long replacement cycles (typically 12–15 years) lock standards and limit switching. Warranty and aftersales terms are often restrictive (commonly 2–5 year coverage), increasing lifecycle cost risk.
Fuel and energy dependence
Diesel suppliers set commodity-driven prices tied to Brent crude (averaging about $85–90/bbl in 2024), while Rotala’s depots face utility exposure from industrial electricity (~€0.18–0.22/kWh in 2024) for charging and operations. Hedging fuel can smooth cash flow but cannot remove market-driven volatility. Transition to low‑emission fleets raises one‑off charger and grid‑capacity costs (depot upgrades often in the £0.2–1.0m range). Supply shocks are typically absorbed slowly through regulated fare adjustments.

Critical parts and maintenance
Specialist components (batteries, drivetrains, telematics) are often single‑sourced, with the top five battery makers holding roughly 80% of market share and China accounting for about 75% of global Li‑ion cell capacity in 2024 (IEA). Downtime risk drives greater reliance on OEM service contracts and paid spares support. Inventory buffering of critical spares ties up working capital and exposes operators to obsolescence. SLA penalties amplify the financial impact of spares delays.

Labor as a quasi-supplier
Driver availability in the UK remains tight with an estimated shortfall around 100,000 drivers (RHA, 2023–24), driving wage inflation of roughly 10–15% and tighter scheduling; unions and regulation (CPC, working-time rules) raise switching costs and shape terms. Training and licensing typically add 6–12 weeks of lead time, while retention challenges and reliance on overtime amplify worker bargaining power and operational costs.
- shortage: ~100,000 drivers (RHA 2023–24)
- wage inflation: ~10–15% (2023)
- training/licensing lead time: 6–12 weeks
- unions/regulation: higher switching costs
- retention/overtime: increased bargaining leverage
Software and ticketing platforms
ETM, scheduling and real-time info systems are highly concentrated, creating integration lock-in; data standards and interoperability mitigate but migrations still require costly system and staff changes. SaaS pricing escalators (commonly 3–6% p.a.) and service fees squeeze operator margins, while reliability clauses often transfer downtime and penalty risk onto operators; global SaaS revenue surpassed $200 billion in 2024.
- Concentration: integration lock-in
- Interoperability: reduces but costly transitions
- Pricing: SaaS escalators 3–6% p.a.
- Risk: reliability clauses shift downtime to operators
- Market: global SaaS > $200bn (2024)
Supplier leverage: top5 batteries ~80%; China ~75%
Suppliers hold strong bargaining power: concentrated OEMs and single‑sourced EV components (top‑5 batteries ~80%, China ~75% capacity in 2024) limit switching; framework orders (3–7y) help but EV demand spikes in 2024 shift leverage. Commodity inputs drive cost volatility (Brent $85–90/bbl; industrial power €0.18–0.22/kWh) while depot upgrades (£0.2–1.0m) and long replacement cycles (12–15y) raise switching costs.
| Metric | 2024/Source |
|---|---|
| Brent | $85–90/bbl |
| Power | €0.18–0.22/kWh |
| Battery share | Top5 ~80% / China ~75% |
| Depot upgrade | £0.2–1.0m |
What is included in the product
 Detailed Word Document
Tailored Porter’s Five Forces analysis for Rotala: evaluates competitive rivalry, buyer and supplier power, threat of new entrants and substitutes, and identifies disruptive forces and entry barriers shaping pricing, profitability and strategic options.

 Customizable Excel Spreadsheet
A concise one-sheet Porter's Five Forces for Rotala—visualizes competitive intensity, supplier/buyer power, substitutes and entry threats so management quickly pinpoints strategic pain points and prioritizes actions.
Customers Bargaining Power

Local authority contracting
In 2024 councils continued to tender supported routes and school services, using competitive bids to exert downward price pressure on operators. Contract renewals, commonly every 3–5 years, create regular switching opportunities for competitors. KPI regimes and performance penalties, often up to around 5% of contract value, shift operational risk onto operators and budget cycles frequently compress margins.
Corporate and shuttle clients
Corporate and shuttle clients negotiate bespoke routing, service levels and pricing, leveraging Rotalas scale—as of 2024 the group operated c.760 vehicles—into tighter SLAs and periodic rebids for multi-year agreements that boost utilization but invite renegotiation. Reliability and branding commitments create differentiation yet increase penalties and operational constraints, while volume concentration among several large corporate customers raises client leverage.

Passenger price sensitivity
Discretionary Rotala riders are highly fare- and frequency-sensitive, especially off-peak, with UK bus patronage recovering to around 80% of 2019 levels (DfT 2023), amplifying price elasticity among casual users. Capped fares and concession schemes materially dampen price responsiveness by anchoring expectations and reducing marginal fare flexibility. Service quality and punctuality remain key drivers of switching to car or rail, while promotions and app-based discounts can curb churn but compress yield and increase marketing and tech costs.

Franchising dynamics
Franchising, seen in UK city deals such as Greater Manchester, shifts revenue risk from operators to local authorities as buyers specify routes, frequencies and vehicle standards, and use competitive tendering that compresses operator margins while stabilising cash flows when contracts are won.
- Buyers set routes/standards
- Revenue risk reallocated to authorities
- Competitive tendering compresses margins
- Contracts stabilise cash flow
- Losing contracts creates idle capacity risk
Multi-homing behavior
Customers increasingly multi-home across buses, rail, ride-hail and cycling; a 2024 UK transport snapshot showed bus ridership at ~65% of 2019 levels while surveys found roughly 30% of urban commuters regularly combine modes, lowering switching costs and weakening loyalty. Integrated ticketing initiatives have reduced churn in pilots by up to 15% and anchor price expectations, while real-time journey apps raise transparency on alternatives and price comparisons.
- Multi-homing: ~30% urban multimodal users (2024)
- Bus demand: ~65% of 2019 levels (2024)
- Integrated ticketing: ≤15% churn reduction in pilots
- Real-time info: increases alternative transparency and price sensitivity
Councils' tenders and KPI fines up to 5% boost buyer leverage; ridership ~65%
Councils' 3–5yr tenders and KPI penalties (up to ~5% of contract value) give buyers strong price leverage in 2024. Corporate clients use Rotala's c.760-vehicle scale to secure tighter SLAs and rebids, concentrating volume and bargaining power. Casual riders remain price-sensitive with UK bus use ~65% of 2019 and ~30% urban multimodal users, lowering loyalty.
| Metric (2024) | Value |
|---|---|
| Fleet size | c.760 |
| Bus demand vs 2019 | ~65% |
| Urban multimodal users | ~30% |
| Penalty levels | up to ~5% |
Full Version Awaits
Rotala Porter's Five Forces Analysis
The Rotala Porter’s Five Forces Analysis evaluates competitive rivalry, supplier and buyer power, threats of new entrants and substitutes, and industry dynamics to inform strategic decisions. It includes data-driven insights and implications for valuation and operations. This preview shows the exact document you'll receive immediately after purchase—no surprises, no placeholders.

A Must-Have Tool for Decision-Makers
Rotala’s Porter's Five Forces snapshot highlights supplier leverage, buyer power, new-entrant threats, substitutes and rivalry shaping its transport operations. It flags strategic pressures—fleet and maintenance costs, contract tendering and regulatory risk—that directly affect margins and growth. This preview is just the beginning. The full analysis provides a complete strategic snapshot with force-by-force ratings, visuals, and business implications tailored to Rotala.
Suppliers Bargaining Power
Concentrated vehicle OEMs
Concentrated OEMs such as Alexander Dennis, Wrightbus and Volvo give suppliers leverage over price, lead times and specifications; Rotala gains negotiating power with 3–7 year framework orders but loses it during EV demand spikes in 2024. Long replacement cycles (typically 12–15 years) lock standards and limit switching. Warranty and aftersales terms are often restrictive (commonly 2–5 year coverage), increasing lifecycle cost risk.
Fuel and energy dependence
Diesel suppliers set commodity-driven prices tied to Brent crude (averaging about $85–90/bbl in 2024), while Rotala’s depots face utility exposure from industrial electricity (~€0.18–0.22/kWh in 2024) for charging and operations. Hedging fuel can smooth cash flow but cannot remove market-driven volatility. Transition to low‑emission fleets raises one‑off charger and grid‑capacity costs (depot upgrades often in the £0.2–1.0m range). Supply shocks are typically absorbed slowly through regulated fare adjustments.
Critical parts and maintenance
Specialist components (batteries, drivetrains, telematics) are often single‑sourced, with the top five battery makers holding roughly 80% of market share and China accounting for about 75% of global Li‑ion cell capacity in 2024 (IEA). Downtime risk drives greater reliance on OEM service contracts and paid spares support. Inventory buffering of critical spares ties up working capital and exposes operators to obsolescence. SLA penalties amplify the financial impact of spares delays.
Labor as a quasi-supplier
Driver availability in the UK remains tight with an estimated shortfall around 100,000 drivers (RHA, 2023–24), driving wage inflation of roughly 10–15% and tighter scheduling; unions and regulation (CPC, working-time rules) raise switching costs and shape terms. Training and licensing typically add 6–12 weeks of lead time, while retention challenges and reliance on overtime amplify worker bargaining power and operational costs.
- shortage: ~100,000 drivers (RHA 2023–24)
- wage inflation: ~10–15% (2023)
- training/licensing lead time: 6–12 weeks
- unions/regulation: higher switching costs
- retention/overtime: increased bargaining leverage
Software and ticketing platforms
ETM, scheduling and real-time info systems are highly concentrated, creating integration lock-in; data standards and interoperability mitigate but migrations still require costly system and staff changes. SaaS pricing escalators (commonly 3–6% p.a.) and service fees squeeze operator margins, while reliability clauses often transfer downtime and penalty risk onto operators; global SaaS revenue surpassed $200 billion in 2024.
- Concentration: integration lock-in
- Interoperability: reduces but costly transitions
- Pricing: SaaS escalators 3–6% p.a.
- Risk: reliability clauses shift downtime to operators
- Market: global SaaS > $200bn (2024)
Supplier leverage: top5 batteries ~80%; China ~75%
Suppliers hold strong bargaining power: concentrated OEMs and single‑sourced EV components (top‑5 batteries ~80%, China ~75% capacity in 2024) limit switching; framework orders (3–7y) help but EV demand spikes in 2024 shift leverage. Commodity inputs drive cost volatility (Brent $85–90/bbl; industrial power €0.18–0.22/kWh) while depot upgrades (£0.2–1.0m) and long replacement cycles (12–15y) raise switching costs.
| Metric | 2024/Source |
|---|---|
| Brent | $85–90/bbl |
| Power | €0.18–0.22/kWh |
| Battery share | Top5 ~80% / China ~75% |
| Depot upgrade | £0.2–1.0m |
What is included in the product
Detailed Word Document
Tailored Porter’s Five Forces analysis for Rotala: evaluates competitive rivalry, buyer and supplier power, threat of new entrants and substitutes, and identifies disruptive forces and entry barriers shaping pricing, profitability and strategic options.
Customizable Excel Spreadsheet
A concise one-sheet Porter's Five Forces for Rotala—visualizes competitive intensity, supplier/buyer power, substitutes and entry threats so management quickly pinpoints strategic pain points and prioritizes actions.
Customers Bargaining Power
Local authority contracting
In 2024 councils continued to tender supported routes and school services, using competitive bids to exert downward price pressure on operators. Contract renewals, commonly every 3–5 years, create regular switching opportunities for competitors. KPI regimes and performance penalties, often up to around 5% of contract value, shift operational risk onto operators and budget cycles frequently compress margins.
Corporate and shuttle clients
Corporate and shuttle clients negotiate bespoke routing, service levels and pricing, leveraging Rotalas scale—as of 2024 the group operated c.760 vehicles—into tighter SLAs and periodic rebids for multi-year agreements that boost utilization but invite renegotiation. Reliability and branding commitments create differentiation yet increase penalties and operational constraints, while volume concentration among several large corporate customers raises client leverage.
Passenger price sensitivity
Discretionary Rotala riders are highly fare- and frequency-sensitive, especially off-peak, with UK bus patronage recovering to around 80% of 2019 levels (DfT 2023), amplifying price elasticity among casual users. Capped fares and concession schemes materially dampen price responsiveness by anchoring expectations and reducing marginal fare flexibility. Service quality and punctuality remain key drivers of switching to car or rail, while promotions and app-based discounts can curb churn but compress yield and increase marketing and tech costs.
Franchising dynamics
Franchising, seen in UK city deals such as Greater Manchester, shifts revenue risk from operators to local authorities as buyers specify routes, frequencies and vehicle standards, and use competitive tendering that compresses operator margins while stabilising cash flows when contracts are won.
- Buyers set routes/standards
- Revenue risk reallocated to authorities
- Competitive tendering compresses margins
- Contracts stabilise cash flow
- Losing contracts creates idle capacity risk
Multi-homing behavior
Customers increasingly multi-home across buses, rail, ride-hail and cycling; a 2024 UK transport snapshot showed bus ridership at ~65% of 2019 levels while surveys found roughly 30% of urban commuters regularly combine modes, lowering switching costs and weakening loyalty. Integrated ticketing initiatives have reduced churn in pilots by up to 15% and anchor price expectations, while real-time journey apps raise transparency on alternatives and price comparisons.
- Multi-homing: ~30% urban multimodal users (2024)
- Bus demand: ~65% of 2019 levels (2024)
- Integrated ticketing: ≤15% churn reduction in pilots
- Real-time info: increases alternative transparency and price sensitivity
Councils' tenders and KPI fines up to 5% boost buyer leverage; ridership ~65%
Councils' 3–5yr tenders and KPI penalties (up to ~5% of contract value) give buyers strong price leverage in 2024. Corporate clients use Rotala's c.760-vehicle scale to secure tighter SLAs and rebids, concentrating volume and bargaining power. Casual riders remain price-sensitive with UK bus use ~65% of 2019 and ~30% urban multimodal users, lowering loyalty.
| Metric (2024) | Value |
|---|---|
| Fleet size | c.760 |
| Bus demand vs 2019 | ~65% |
| Urban multimodal users | ~30% |
| Penalty levels | up to ~5% |
Full Version Awaits
Rotala Porter's Five Forces Analysis
The Rotala Porter’s Five Forces Analysis evaluates competitive rivalry, supplier and buyer power, threats of new entrants and substitutes, and industry dynamics to inform strategic decisions. It includes data-driven insights and implications for valuation and operations. This preview shows the exact document you'll receive immediately after purchase—no surprises, no placeholders.
Original: $10.00
-65%$10.00
$3.50Description
A Must-Have Tool for Decision-Makers
Rotala’s Porter's Five Forces snapshot highlights supplier leverage, buyer power, new-entrant threats, substitutes and rivalry shaping its transport operations. It flags strategic pressures—fleet and maintenance costs, contract tendering and regulatory risk—that directly affect margins and growth. This preview is just the beginning. The full analysis provides a complete strategic snapshot with force-by-force ratings, visuals, and business implications tailored to Rotala.
Suppliers Bargaining Power
Concentrated vehicle OEMs
Concentrated OEMs such as Alexander Dennis, Wrightbus and Volvo give suppliers leverage over price, lead times and specifications; Rotala gains negotiating power with 3–7 year framework orders but loses it during EV demand spikes in 2024. Long replacement cycles (typically 12–15 years) lock standards and limit switching. Warranty and aftersales terms are often restrictive (commonly 2–5 year coverage), increasing lifecycle cost risk.
Fuel and energy dependence
Diesel suppliers set commodity-driven prices tied to Brent crude (averaging about $85–90/bbl in 2024), while Rotala’s depots face utility exposure from industrial electricity (~€0.18–0.22/kWh in 2024) for charging and operations. Hedging fuel can smooth cash flow but cannot remove market-driven volatility. Transition to low‑emission fleets raises one‑off charger and grid‑capacity costs (depot upgrades often in the £0.2–1.0m range). Supply shocks are typically absorbed slowly through regulated fare adjustments.
Critical parts and maintenance
Specialist components (batteries, drivetrains, telematics) are often single‑sourced, with the top five battery makers holding roughly 80% of market share and China accounting for about 75% of global Li‑ion cell capacity in 2024 (IEA). Downtime risk drives greater reliance on OEM service contracts and paid spares support. Inventory buffering of critical spares ties up working capital and exposes operators to obsolescence. SLA penalties amplify the financial impact of spares delays.
Labor as a quasi-supplier
Driver availability in the UK remains tight with an estimated shortfall around 100,000 drivers (RHA, 2023–24), driving wage inflation of roughly 10–15% and tighter scheduling; unions and regulation (CPC, working-time rules) raise switching costs and shape terms. Training and licensing typically add 6–12 weeks of lead time, while retention challenges and reliance on overtime amplify worker bargaining power and operational costs.
- shortage: ~100,000 drivers (RHA 2023–24)
- wage inflation: ~10–15% (2023)
- training/licensing lead time: 6–12 weeks
- unions/regulation: higher switching costs
- retention/overtime: increased bargaining leverage
Software and ticketing platforms
ETM, scheduling and real-time info systems are highly concentrated, creating integration lock-in; data standards and interoperability mitigate but migrations still require costly system and staff changes. SaaS pricing escalators (commonly 3–6% p.a.) and service fees squeeze operator margins, while reliability clauses often transfer downtime and penalty risk onto operators; global SaaS revenue surpassed $200 billion in 2024.
- Concentration: integration lock-in
- Interoperability: reduces but costly transitions
- Pricing: SaaS escalators 3–6% p.a.
- Risk: reliability clauses shift downtime to operators
- Market: global SaaS > $200bn (2024)
Supplier leverage: top5 batteries ~80%; China ~75%
Suppliers hold strong bargaining power: concentrated OEMs and single‑sourced EV components (top‑5 batteries ~80%, China ~75% capacity in 2024) limit switching; framework orders (3–7y) help but EV demand spikes in 2024 shift leverage. Commodity inputs drive cost volatility (Brent $85–90/bbl; industrial power €0.18–0.22/kWh) while depot upgrades (£0.2–1.0m) and long replacement cycles (12–15y) raise switching costs.
| Metric | 2024/Source |
|---|---|
| Brent | $85–90/bbl |
| Power | €0.18–0.22/kWh |
| Battery share | Top5 ~80% / China ~75% |
| Depot upgrade | £0.2–1.0m |
What is included in the product
Detailed Word Document
Tailored Porter’s Five Forces analysis for Rotala: evaluates competitive rivalry, buyer and supplier power, threat of new entrants and substitutes, and identifies disruptive forces and entry barriers shaping pricing, profitability and strategic options.
Customizable Excel Spreadsheet
A concise one-sheet Porter's Five Forces for Rotala—visualizes competitive intensity, supplier/buyer power, substitutes and entry threats so management quickly pinpoints strategic pain points and prioritizes actions.
Customers Bargaining Power
Local authority contracting
In 2024 councils continued to tender supported routes and school services, using competitive bids to exert downward price pressure on operators. Contract renewals, commonly every 3–5 years, create regular switching opportunities for competitors. KPI regimes and performance penalties, often up to around 5% of contract value, shift operational risk onto operators and budget cycles frequently compress margins.
Corporate and shuttle clients
Corporate and shuttle clients negotiate bespoke routing, service levels and pricing, leveraging Rotalas scale—as of 2024 the group operated c.760 vehicles—into tighter SLAs and periodic rebids for multi-year agreements that boost utilization but invite renegotiation. Reliability and branding commitments create differentiation yet increase penalties and operational constraints, while volume concentration among several large corporate customers raises client leverage.
Passenger price sensitivity
Discretionary Rotala riders are highly fare- and frequency-sensitive, especially off-peak, with UK bus patronage recovering to around 80% of 2019 levels (DfT 2023), amplifying price elasticity among casual users. Capped fares and concession schemes materially dampen price responsiveness by anchoring expectations and reducing marginal fare flexibility. Service quality and punctuality remain key drivers of switching to car or rail, while promotions and app-based discounts can curb churn but compress yield and increase marketing and tech costs.
Franchising dynamics
Franchising, seen in UK city deals such as Greater Manchester, shifts revenue risk from operators to local authorities as buyers specify routes, frequencies and vehicle standards, and use competitive tendering that compresses operator margins while stabilising cash flows when contracts are won.
- Buyers set routes/standards
- Revenue risk reallocated to authorities
- Competitive tendering compresses margins
- Contracts stabilise cash flow
- Losing contracts creates idle capacity risk
Multi-homing behavior
Customers increasingly multi-home across buses, rail, ride-hail and cycling; a 2024 UK transport snapshot showed bus ridership at ~65% of 2019 levels while surveys found roughly 30% of urban commuters regularly combine modes, lowering switching costs and weakening loyalty. Integrated ticketing initiatives have reduced churn in pilots by up to 15% and anchor price expectations, while real-time journey apps raise transparency on alternatives and price comparisons.
- Multi-homing: ~30% urban multimodal users (2024)
- Bus demand: ~65% of 2019 levels (2024)
- Integrated ticketing: ≤15% churn reduction in pilots
- Real-time info: increases alternative transparency and price sensitivity
Councils' tenders and KPI fines up to 5% boost buyer leverage; ridership ~65%
Councils' 3–5yr tenders and KPI penalties (up to ~5% of contract value) give buyers strong price leverage in 2024. Corporate clients use Rotala's c.760-vehicle scale to secure tighter SLAs and rebids, concentrating volume and bargaining power. Casual riders remain price-sensitive with UK bus use ~65% of 2019 and ~30% urban multimodal users, lowering loyalty.
| Metric (2024) | Value |
|---|---|
| Fleet size | c.760 |
| Bus demand vs 2019 | ~65% |
| Urban multimodal users | ~30% |
| Penalty levels | up to ~5% |
Full Version Awaits
Rotala Porter's Five Forces Analysis
The Rotala Porter’s Five Forces Analysis evaluates competitive rivalry, supplier and buyer power, threats of new entrants and substitutes, and industry dynamics to inform strategic decisions. It includes data-driven insights and implications for valuation and operations. This preview shows the exact document you'll receive immediately after purchase—no surprises, no placeholders.











