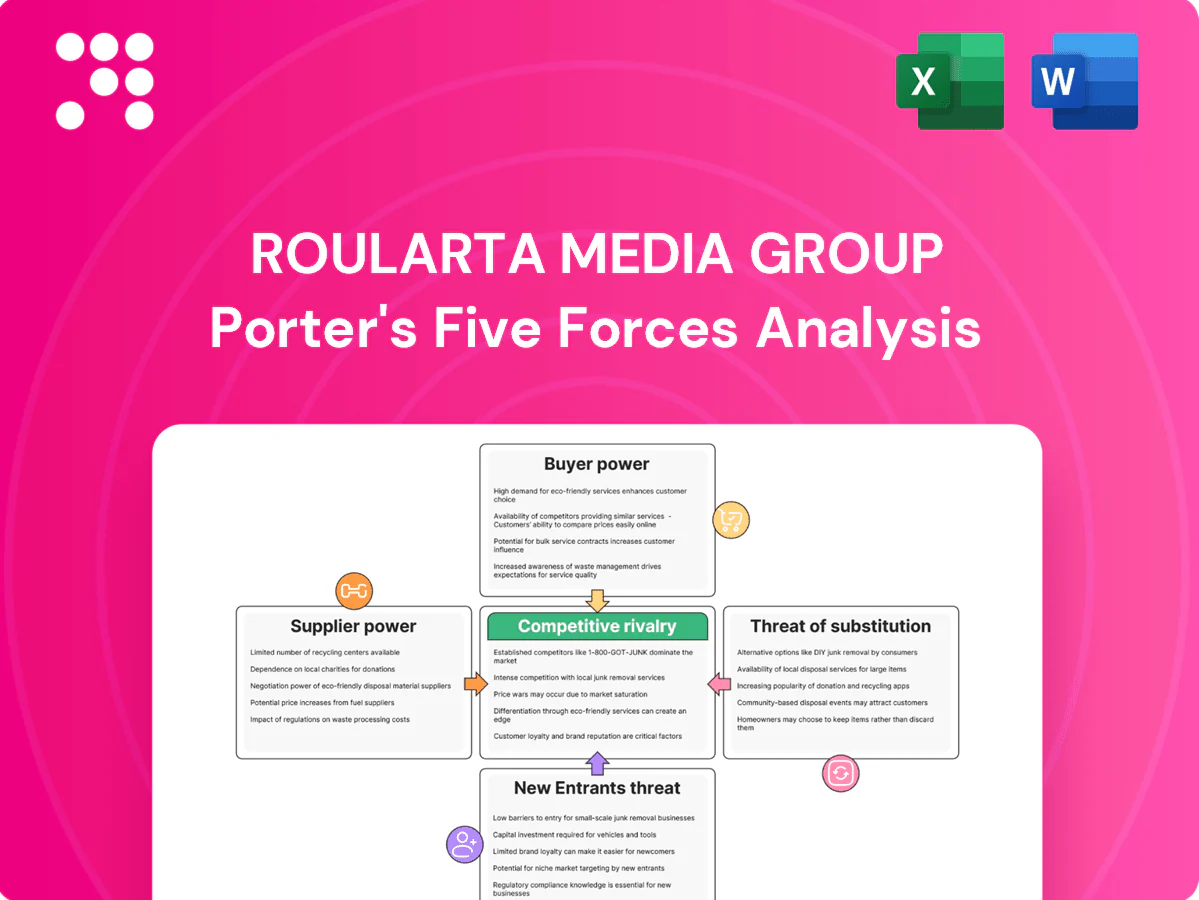
Roularta Media Group Porter's Five Forces Analysis

A Must-Have Tool for Decision-Makers
Roularta Media Group faces moderate buyer power and growing substitute threats from digital platforms, while its strong brand and distribution create moderate barriers to entry; supplier influence remains limited. Competitive rivalry is intense as legacy print pressures accelerate digital transformation and monetization challenges. This brief snapshot only scratches the surface—unlock the full Porter's Five Forces Analysis for detailed, actionable insights.
Suppliers Bargaining Power

Concentration in paper, print, and distribution
European newsprint mills, print houses and postal/logistics providers are relatively concentrated, with European newsprint capacity around 6 million tonnes in 2024, giving suppliers negotiating leverage on price and terms. Energy and pulp cost swings are often passed through to publishers, magnifying cost volatility. Capacity constraints or strikes can disrupt schedules and raise costs materially. Long-term contracts, typically 3–5 years, temper volatility but limit flexibility.
Dependence on freelance and content creators
Roularta depends heavily on freelance journalists, photographers and agencies for specialized content, with star contributors able to command premium rates that squeeze margins; Roularta reported group revenue of about €349m in 2023, increasing pressure to control costs. Tight labor markets and IP/syndication negotiations raise supplier power further, while investing in in-house talent and multi-use content libraries can blunt this influence.

Digital tech stack and platform vendors
CDNs, CMS, analytics, ad-tech and cloud providers create strong switching costs and technical lock-in for Roularta; in 2024 AWS (32%), Azure (22%) and GCP (11%) dominated cloud, while programmatic ad-tech take rates commonly range 20–30%, enabling vendors to impose fees and restrictive data terms. Complex integrations across stacks deepen dependency, whereas open-source and modular/headless architectures reduce vendor leverage and exit costs.

App stores and OS ecosystems
Apple and Google control mobile distribution, charging standard commissions of 30% (15% for small businesses) and restricting data access, so policy shifts can directly hit subscriptions and ad revenues.
Privacy moves like Apple’s ATT (post-2021) cut third-party tracking reach, reducing ad targeting; platform review visibility and rules amplify supplier power, while web-first UX and direct billing lower dependence.
Data and third-party content licensors
Licenses for images, data and syndicated articles drive Roularta’s content cost base and scarce high-quality archives and datasets give licensors leverage, tightening terms and pricing and potentially raising margins pressure. Usage restrictions from third parties can limit product innovation and multi-platform reuse, while negotiating bundled rights and investing in proprietary data reduce supplier exposure and long-term licensing spend.
- High supplier leverage due to scarce archives
- Usage limits hinder new formats
- Bundled rights lower unit costs
- Proprietary data cuts dependency
Supplier squeeze: newsprint, cloud 32%/22%/11%, app fees, tracking
Suppliers (newsprint, logistics, freelancers, cloud, platforms, licensors) exert high leverage: European newsprint ~6m t (2024), Roularta revenue €349m (2023). Cloud share AWS 32%/Azure 22%/GCP 11% (2024) and app fees 30%/15% raise costs; ATT cut tracking ~25–30%. Bundled rights and proprietary content reduce exposure.
| Item | 2023/24 |
|---|---|
| Revenue | €349m (2023) |
| Newsprint | 6m t (2024) |
| AWS/Azure/GCP | 32%/22%/11% (2024) |
What is included in the product
 Detailed Word Document
Concise Porter's Five Forces analysis of Roularta Media Group, examining competitive rivalry, buyer and supplier power, threat of substitutes and new entrants, and highlighting disruptive trends and strategic defenses to protect margins.

 Customizable Excel Spreadsheet
A clear, one-sheet Porter’s Five Forces summary for Roularta Media Group—perfect for quick strategic decisions and boardroom slides. Customize pressure levels and swap in your own data to reflect evolving market trends or regulatory shifts.
Customers Bargaining Power

Advertisers’ pricing leverage
Brands and agencies multi-home across Belgian and EU media, increasing buyer choice; programmatic buying—accounting for roughly 70%+ of European display in 2024—boosts price transparency and downward CPM pressure. Large advertisers secure volume discounts and integrated deals with publishers like Roularta, while publishers that prove differentiated audiences and measurable performance can reclaim pricing power and sustain higher CPMs.
Readers’ low switching costs
Consumers switch quickly among free and paid news/lifestyle sources, with paywall conversion rates typically 1–3% and annual churn in digital subscriptions often near 25–35%, increasing price sensitivity via intro offers and promotional cycles. Bundles and premium features can lift ARPU by roughly 20–40% versus single-product buyers. Strong brand trust and unique local content provide a 10–15 percentage point retention advantage that partially offsets low switching costs.

Agency and intermediary influence
Media agencies steer Roularta’s clients toward measurable, cross-channel plans, with programmatic and multichannel buying accounting for over half of digital display spend by 2023, increasing reliance on intermediaries.
Rising demand for third-party verification and brand safety drives compliance costs and integration expenses for publishers.
Large buyers’ clout can compress margins, though Roularta’s move toward first-party data and outcome-based sales reduces intermediary power and improves direct monetization.

Programmatic buyers and algorithms
Programmatic buyers and algorithms have commoditized Roularta’s inventory—programmatic made up approx 85% of global digital display spend in 2024—rewarding lowest-cost reach while header bidding (adopted by ~70% of publishers in 2024) increases auction competition and pressures yields. Buyers optimize to ROAS, demanding performance guarantees and shifting spend to measurable placements, but Roularta’s contextual excellence and identity-light solutions have secured CPM premiums of ~15–25% for first-party/contextual inventory.
- Programmatic share ~85% (2024)
- Header bidding adoption ~70% (2024)
- ROAS-driven demands => performance guarantees
- Contextual/first-party CPM premium ~15–25% (2024)
Enterprise clients for digital services
- Customization & SLAs required
- RFPs increase leverage
- 6–12 month sales cycles
- Embedded analytics = higher retention
Programmatic ~85% and header bidding ~70% squeeze CPMs; bundles lift ARPU 20-40%
Customers have high bargaining power: programmatic (~85% EU display 2024) and header bidding (~70% publishers 2024) drive price transparency and CPM pressure, while large advertisers extract volume discounts. Paywall conversion 1–3% with 25–35% annual churn raises price sensitivity; bundles lift ARPU 20–40% and unique local content gives 10–15pp retention edge. Enterprise deals demand 6–12 month sales cycles and formal SLAs, boosting negotiation leverage.
| Metric | Value (2024) |
|---|---|
| Programmatic share | ~85% |
| Header bidding adoption | ~70% |
| CPM premium (1st-party) | 15–25% |
| Paywall conversion | 1–3% |
| Digital churn | 25–35% |
Same Document Delivered
Roularta Media Group Porter's Five Forces Analysis
This preview shows the exact Porter's Five Forces analysis of Roularta Media Group you'll receive immediately after purchase—no placeholders or edits. The document is fully formatted, professionally written, and ready for download and use the moment you buy. What you see here is the final deliverable with a complete competitive assessment and actionable insights.

A Must-Have Tool for Decision-Makers
Roularta Media Group faces moderate buyer power and growing substitute threats from digital platforms, while its strong brand and distribution create moderate barriers to entry; supplier influence remains limited. Competitive rivalry is intense as legacy print pressures accelerate digital transformation and monetization challenges. This brief snapshot only scratches the surface—unlock the full Porter's Five Forces Analysis for detailed, actionable insights.
Suppliers Bargaining Power
Concentration in paper, print, and distribution
European newsprint mills, print houses and postal/logistics providers are relatively concentrated, with European newsprint capacity around 6 million tonnes in 2024, giving suppliers negotiating leverage on price and terms. Energy and pulp cost swings are often passed through to publishers, magnifying cost volatility. Capacity constraints or strikes can disrupt schedules and raise costs materially. Long-term contracts, typically 3–5 years, temper volatility but limit flexibility.
Dependence on freelance and content creators
Roularta depends heavily on freelance journalists, photographers and agencies for specialized content, with star contributors able to command premium rates that squeeze margins; Roularta reported group revenue of about €349m in 2023, increasing pressure to control costs. Tight labor markets and IP/syndication negotiations raise supplier power further, while investing in in-house talent and multi-use content libraries can blunt this influence.
Digital tech stack and platform vendors
CDNs, CMS, analytics, ad-tech and cloud providers create strong switching costs and technical lock-in for Roularta; in 2024 AWS (32%), Azure (22%) and GCP (11%) dominated cloud, while programmatic ad-tech take rates commonly range 20–30%, enabling vendors to impose fees and restrictive data terms. Complex integrations across stacks deepen dependency, whereas open-source and modular/headless architectures reduce vendor leverage and exit costs.
App stores and OS ecosystems
Apple and Google control mobile distribution, charging standard commissions of 30% (15% for small businesses) and restricting data access, so policy shifts can directly hit subscriptions and ad revenues.
Privacy moves like Apple’s ATT (post-2021) cut third-party tracking reach, reducing ad targeting; platform review visibility and rules amplify supplier power, while web-first UX and direct billing lower dependence.
Data and third-party content licensors
Licenses for images, data and syndicated articles drive Roularta’s content cost base and scarce high-quality archives and datasets give licensors leverage, tightening terms and pricing and potentially raising margins pressure. Usage restrictions from third parties can limit product innovation and multi-platform reuse, while negotiating bundled rights and investing in proprietary data reduce supplier exposure and long-term licensing spend.
- High supplier leverage due to scarce archives
- Usage limits hinder new formats
- Bundled rights lower unit costs
- Proprietary data cuts dependency
Supplier squeeze: newsprint, cloud 32%/22%/11%, app fees, tracking
Suppliers (newsprint, logistics, freelancers, cloud, platforms, licensors) exert high leverage: European newsprint ~6m t (2024), Roularta revenue €349m (2023). Cloud share AWS 32%/Azure 22%/GCP 11% (2024) and app fees 30%/15% raise costs; ATT cut tracking ~25–30%. Bundled rights and proprietary content reduce exposure.
| Item | 2023/24 |
|---|---|
| Revenue | €349m (2023) |
| Newsprint | 6m t (2024) |
| AWS/Azure/GCP | 32%/22%/11% (2024) |
What is included in the product
Detailed Word Document
Concise Porter's Five Forces analysis of Roularta Media Group, examining competitive rivalry, buyer and supplier power, threat of substitutes and new entrants, and highlighting disruptive trends and strategic defenses to protect margins.
Customizable Excel Spreadsheet
A clear, one-sheet Porter’s Five Forces summary for Roularta Media Group—perfect for quick strategic decisions and boardroom slides. Customize pressure levels and swap in your own data to reflect evolving market trends or regulatory shifts.
Customers Bargaining Power
Advertisers’ pricing leverage
Brands and agencies multi-home across Belgian and EU media, increasing buyer choice; programmatic buying—accounting for roughly 70%+ of European display in 2024—boosts price transparency and downward CPM pressure. Large advertisers secure volume discounts and integrated deals with publishers like Roularta, while publishers that prove differentiated audiences and measurable performance can reclaim pricing power and sustain higher CPMs.
Readers’ low switching costs
Consumers switch quickly among free and paid news/lifestyle sources, with paywall conversion rates typically 1–3% and annual churn in digital subscriptions often near 25–35%, increasing price sensitivity via intro offers and promotional cycles. Bundles and premium features can lift ARPU by roughly 20–40% versus single-product buyers. Strong brand trust and unique local content provide a 10–15 percentage point retention advantage that partially offsets low switching costs.
Agency and intermediary influence
Media agencies steer Roularta’s clients toward measurable, cross-channel plans, with programmatic and multichannel buying accounting for over half of digital display spend by 2023, increasing reliance on intermediaries.
Rising demand for third-party verification and brand safety drives compliance costs and integration expenses for publishers.
Large buyers’ clout can compress margins, though Roularta’s move toward first-party data and outcome-based sales reduces intermediary power and improves direct monetization.
Programmatic buyers and algorithms
Programmatic buyers and algorithms have commoditized Roularta’s inventory—programmatic made up approx 85% of global digital display spend in 2024—rewarding lowest-cost reach while header bidding (adopted by ~70% of publishers in 2024) increases auction competition and pressures yields. Buyers optimize to ROAS, demanding performance guarantees and shifting spend to measurable placements, but Roularta’s contextual excellence and identity-light solutions have secured CPM premiums of ~15–25% for first-party/contextual inventory.
- Programmatic share ~85% (2024)
- Header bidding adoption ~70% (2024)
- ROAS-driven demands => performance guarantees
- Contextual/first-party CPM premium ~15–25% (2024)
Enterprise clients for digital services
- Customization & SLAs required
- RFPs increase leverage
- 6–12 month sales cycles
- Embedded analytics = higher retention
Programmatic ~85% and header bidding ~70% squeeze CPMs; bundles lift ARPU 20-40%
Customers have high bargaining power: programmatic (~85% EU display 2024) and header bidding (~70% publishers 2024) drive price transparency and CPM pressure, while large advertisers extract volume discounts. Paywall conversion 1–3% with 25–35% annual churn raises price sensitivity; bundles lift ARPU 20–40% and unique local content gives 10–15pp retention edge. Enterprise deals demand 6–12 month sales cycles and formal SLAs, boosting negotiation leverage.
| Metric | Value (2024) |
|---|---|
| Programmatic share | ~85% |
| Header bidding adoption | ~70% |
| CPM premium (1st-party) | 15–25% |
| Paywall conversion | 1–3% |
| Digital churn | 25–35% |
Same Document Delivered
Roularta Media Group Porter's Five Forces Analysis
This preview shows the exact Porter's Five Forces analysis of Roularta Media Group you'll receive immediately after purchase—no placeholders or edits. The document is fully formatted, professionally written, and ready for download and use the moment you buy. What you see here is the final deliverable with a complete competitive assessment and actionable insights.
Original: $10.00
-65%$10.00
$3.50Description
A Must-Have Tool for Decision-Makers
Roularta Media Group faces moderate buyer power and growing substitute threats from digital platforms, while its strong brand and distribution create moderate barriers to entry; supplier influence remains limited. Competitive rivalry is intense as legacy print pressures accelerate digital transformation and monetization challenges. This brief snapshot only scratches the surface—unlock the full Porter's Five Forces Analysis for detailed, actionable insights.
Suppliers Bargaining Power
Concentration in paper, print, and distribution
European newsprint mills, print houses and postal/logistics providers are relatively concentrated, with European newsprint capacity around 6 million tonnes in 2024, giving suppliers negotiating leverage on price and terms. Energy and pulp cost swings are often passed through to publishers, magnifying cost volatility. Capacity constraints or strikes can disrupt schedules and raise costs materially. Long-term contracts, typically 3–5 years, temper volatility but limit flexibility.
Dependence on freelance and content creators
Roularta depends heavily on freelance journalists, photographers and agencies for specialized content, with star contributors able to command premium rates that squeeze margins; Roularta reported group revenue of about €349m in 2023, increasing pressure to control costs. Tight labor markets and IP/syndication negotiations raise supplier power further, while investing in in-house talent and multi-use content libraries can blunt this influence.
Digital tech stack and platform vendors
CDNs, CMS, analytics, ad-tech and cloud providers create strong switching costs and technical lock-in for Roularta; in 2024 AWS (32%), Azure (22%) and GCP (11%) dominated cloud, while programmatic ad-tech take rates commonly range 20–30%, enabling vendors to impose fees and restrictive data terms. Complex integrations across stacks deepen dependency, whereas open-source and modular/headless architectures reduce vendor leverage and exit costs.
App stores and OS ecosystems
Apple and Google control mobile distribution, charging standard commissions of 30% (15% for small businesses) and restricting data access, so policy shifts can directly hit subscriptions and ad revenues.
Privacy moves like Apple’s ATT (post-2021) cut third-party tracking reach, reducing ad targeting; platform review visibility and rules amplify supplier power, while web-first UX and direct billing lower dependence.
Data and third-party content licensors
Licenses for images, data and syndicated articles drive Roularta’s content cost base and scarce high-quality archives and datasets give licensors leverage, tightening terms and pricing and potentially raising margins pressure. Usage restrictions from third parties can limit product innovation and multi-platform reuse, while negotiating bundled rights and investing in proprietary data reduce supplier exposure and long-term licensing spend.
- High supplier leverage due to scarce archives
- Usage limits hinder new formats
- Bundled rights lower unit costs
- Proprietary data cuts dependency
Supplier squeeze: newsprint, cloud 32%/22%/11%, app fees, tracking
Suppliers (newsprint, logistics, freelancers, cloud, platforms, licensors) exert high leverage: European newsprint ~6m t (2024), Roularta revenue €349m (2023). Cloud share AWS 32%/Azure 22%/GCP 11% (2024) and app fees 30%/15% raise costs; ATT cut tracking ~25–30%. Bundled rights and proprietary content reduce exposure.
| Item | 2023/24 |
|---|---|
| Revenue | €349m (2023) |
| Newsprint | 6m t (2024) |
| AWS/Azure/GCP | 32%/22%/11% (2024) |
What is included in the product
Detailed Word Document
Concise Porter's Five Forces analysis of Roularta Media Group, examining competitive rivalry, buyer and supplier power, threat of substitutes and new entrants, and highlighting disruptive trends and strategic defenses to protect margins.
Customizable Excel Spreadsheet
A clear, one-sheet Porter’s Five Forces summary for Roularta Media Group—perfect for quick strategic decisions and boardroom slides. Customize pressure levels and swap in your own data to reflect evolving market trends or regulatory shifts.
Customers Bargaining Power
Advertisers’ pricing leverage
Brands and agencies multi-home across Belgian and EU media, increasing buyer choice; programmatic buying—accounting for roughly 70%+ of European display in 2024—boosts price transparency and downward CPM pressure. Large advertisers secure volume discounts and integrated deals with publishers like Roularta, while publishers that prove differentiated audiences and measurable performance can reclaim pricing power and sustain higher CPMs.
Readers’ low switching costs
Consumers switch quickly among free and paid news/lifestyle sources, with paywall conversion rates typically 1–3% and annual churn in digital subscriptions often near 25–35%, increasing price sensitivity via intro offers and promotional cycles. Bundles and premium features can lift ARPU by roughly 20–40% versus single-product buyers. Strong brand trust and unique local content provide a 10–15 percentage point retention advantage that partially offsets low switching costs.
Agency and intermediary influence
Media agencies steer Roularta’s clients toward measurable, cross-channel plans, with programmatic and multichannel buying accounting for over half of digital display spend by 2023, increasing reliance on intermediaries.
Rising demand for third-party verification and brand safety drives compliance costs and integration expenses for publishers.
Large buyers’ clout can compress margins, though Roularta’s move toward first-party data and outcome-based sales reduces intermediary power and improves direct monetization.
Programmatic buyers and algorithms
Programmatic buyers and algorithms have commoditized Roularta’s inventory—programmatic made up approx 85% of global digital display spend in 2024—rewarding lowest-cost reach while header bidding (adopted by ~70% of publishers in 2024) increases auction competition and pressures yields. Buyers optimize to ROAS, demanding performance guarantees and shifting spend to measurable placements, but Roularta’s contextual excellence and identity-light solutions have secured CPM premiums of ~15–25% for first-party/contextual inventory.
- Programmatic share ~85% (2024)
- Header bidding adoption ~70% (2024)
- ROAS-driven demands => performance guarantees
- Contextual/first-party CPM premium ~15–25% (2024)
Enterprise clients for digital services
- Customization & SLAs required
- RFPs increase leverage
- 6–12 month sales cycles
- Embedded analytics = higher retention
Programmatic ~85% and header bidding ~70% squeeze CPMs; bundles lift ARPU 20-40%
Customers have high bargaining power: programmatic (~85% EU display 2024) and header bidding (~70% publishers 2024) drive price transparency and CPM pressure, while large advertisers extract volume discounts. Paywall conversion 1–3% with 25–35% annual churn raises price sensitivity; bundles lift ARPU 20–40% and unique local content gives 10–15pp retention edge. Enterprise deals demand 6–12 month sales cycles and formal SLAs, boosting negotiation leverage.
| Metric | Value (2024) |
|---|---|
| Programmatic share | ~85% |
| Header bidding adoption | ~70% |
| CPM premium (1st-party) | 15–25% |
| Paywall conversion | 1–3% |
| Digital churn | 25–35% |
Same Document Delivered
Roularta Media Group Porter's Five Forces Analysis
This preview shows the exact Porter's Five Forces analysis of Roularta Media Group you'll receive immediately after purchase—no placeholders or edits. The document is fully formatted, professionally written, and ready for download and use the moment you buy. What you see here is the final deliverable with a complete competitive assessment and actionable insights.











