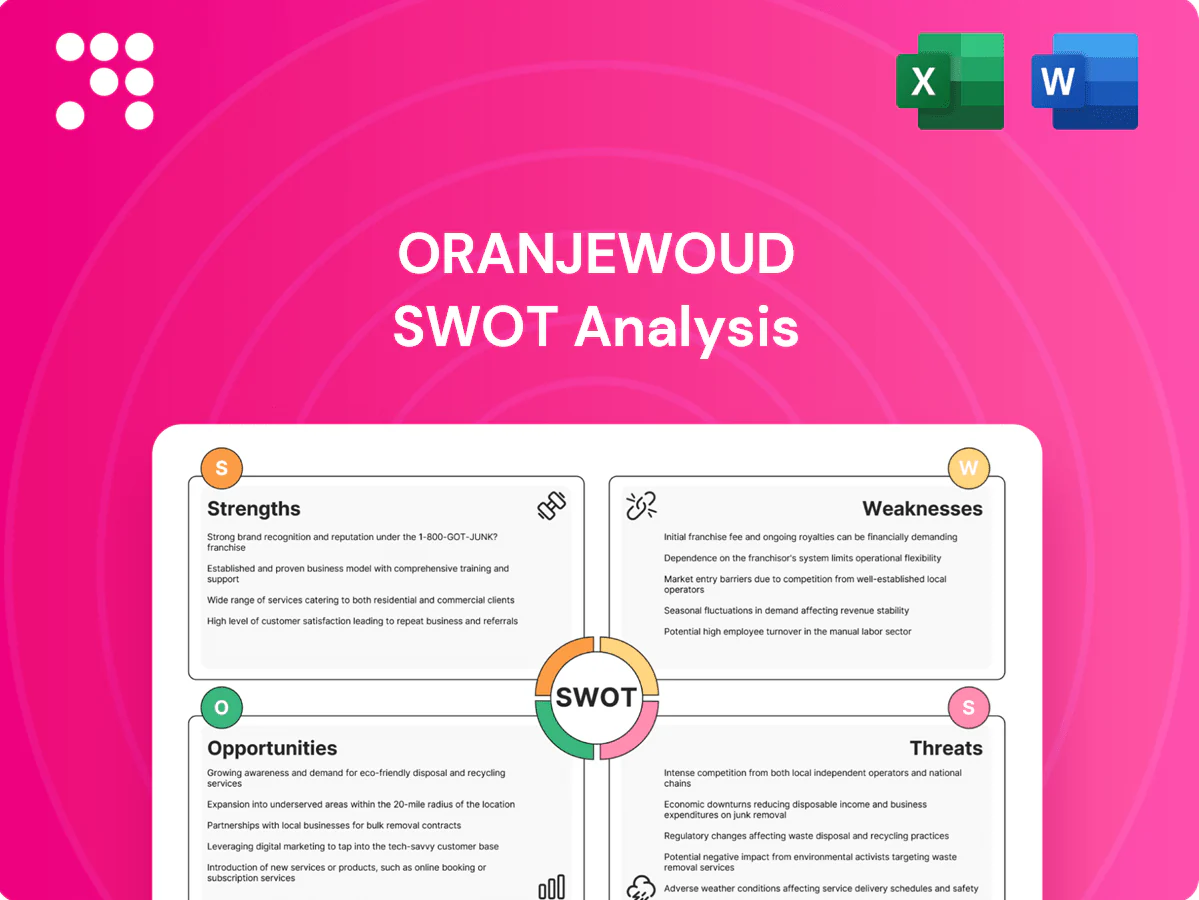
Oranjewoud SWOT Analysis

Dive Deeper Into the Company’s Strategic Blueprint
Oranjewoud’s SWOT snapshot highlights solid infrastructure expertise and niche market positions, balanced against sector cyclicality and integration risks; strategic partnerships and sustainability initiatives emerge as clear growth levers. Want the full story behind strengths, risks, and growth drivers? Purchase the complete SWOT analysis for a professionally written, editable report and Excel matrix to support planning, pitches, and investment decisions.
Strengths

Leading brand via Royal HaskoningDHV
Leveraging Royal HaskoningDHV’s internationally recognised brand and certifications (including ISO 9001/14001), Oranjewoud wins complex, high-margin infrastructure and water mandates by de-risking client selection through decades of marquee project references and trusted public‑private partnerships. This brand strength underpins pricing power and opens access to strategic consortia and joint-venture opportunities.
Diversified sector coverage
Oranjewoud spans infrastructure, water, maritime, aviation, industry, energy and buildings, smoothing sector-specific cycles by balancing public works with regulated water and energy projects.
This multi-sector footprint enables cross-selling across project pipelines, rapid redeployment of engineering talent into high-growth verticals, and spreads risk across end-markets and geographies for portfolio resilience.

Sustainability and lifecycle capability
Oranjewoud leverages deep expertise in sustainable design, climate resilience and circular solutions across the full project lifecycle to link advisory, design, project management and asset optimization into measurable outcomes rather than outputs. ESG-aligned methodologies position the firm strongly in public tenders as EU public procurement equals about 14% of EU GDP and EU climate rules (55% GHG cut target by 2030; 30% EU budget climate tagging) drive demand for decarbonization and adaptation partners.

Global delivery with local insight
Oranjewoud leverages a multinational footprint with local regulatory expertise and stakeholder networks to de-risk projects and navigate permit cycles efficiently; cross-border teams accelerate complex program delivery through integrated project management and shared timelines. Scalable frameworks, shared IP and regional centers of excellence ensure consistent quality and repeatable execution across markets.
- Global footprint + local regulatory know-how
- Cross-border teams speed complex programs
- Scalable frameworks and shared IP
- Centers of excellence drive repeatable quality
Integrated engineering and project management
Oranjewoud delivers end-to-end integration from feasibility and detailed design through construction, commissioning and long-term operations support, maintaining continuity that tightens schedule, cost and risk control via a mature PMO and integrated digital toolchains. Proven claims avoidance and strong safety records reduce client exposure and operational interruptions, lowering total cost of ownership through single-source delivery.
ISO-certified firm: 7-sector reach, ESG & EU climate alignment (55%, 30%, 14%)
Strong Royal HaskoningDHV brand and ISO 9001/14001 certifications win complex, high‑margin mandates. A 7‑sector footprint (infrastructure, water, maritime, aviation, industry, energy, buildings) smooths cyclical risk and enables cross‑selling. Deep ESG, climate resilience and circular expertise aligns with EU targets (55% GHG cut by 2030; 30% EU budget climate tagging) and public procurement (~14% of EU GDP).
| Strength | Evidence | Metric |
|---|---|---|
| Brand & certs | Royal HaskoningDHV; ISO | ISO 9001/14001 |
| Sector breadth | Cross‑selling | 7 sectors |
| ESG alignment | EU policy tailwinds | 55% GHG; 30% budget; 14% GDP |
What is included in the product
 Detailed Word Document
Delivers a strategic overview of Oranjewoud’s internal and external business factors, outlining strengths, weaknesses, opportunities, and threats to inform strategic decisions.

 Customizable Excel Spreadsheet
Provides a concise, editable SWOT matrix for Oranjewoud to quickly align strategy and relieve pain points across business units, enabling fast stakeholder presentations and easy updates as priorities change.
Weaknesses

Project-based margin volatility
Project-based margin volatility exposes Oranjewoud to scope creep, schedule delays and claim disputes that can materially compress margins. Utilization swings and write-down risk on fixed-price contracts amplify earnings sensitivity to milestone timing and client approvals. Strong, disciplined bid governance and tighter change-order controls are required to limit downside.
Reliance on public sector budgets
Heavy concentration in government-funded infrastructure and water programs exposes Oranjewoud to sector volatility; public procurement accounts for about 12% of GDP on average in OECD countries, amplifying client-concentration risk. Election cycles, austerity measures and permitting slowdowns periodically freeze projects, elongating procurement timelines and creating payment lags. These dynamics impair cash-flow predictability and raise working-capital needs.

Talent attraction and retention pressure
Global scarcity of experienced engineers, project managers and digital specialists—Korn Ferry projects an 85.2 million high‑skill shortfall by 2030—raises hiring pressure for Oranjewoud. Wage inflation in tech and engineering has driven market salaries up, and replacement/retention costs (commonly 20–30% of annual salary) compress margins. Lengthy onboarding and knowledge‑transfer frictions extend ramp‑up time, while dependence on a few key experts concentrates delivery risk for signature projects.

Organizational complexity of a holding
As a holding, Oranjewoud faces coordination challenges across subsidiaries and regions that can slow cross-border project alignment and resource allocation, increase duplication of functions and prolong decision cycles, and create significant integration overhead for shared services and IT systems; this structure can also reduce transparency for investors assessing segment-level performance.
- coordination: cross-subsidiary misalignment
- duplication: overlapping back-office roles
- integration: shared-services complexity
- investor-opacity: harder segment visibility
Working capital intensity
Long receivable cycles from milestone-based billing and upfront mobilization fees increase working capital strain; industry DSO remained elevated in 2024 at around 60–75 days, amplifying cash conversion risk. Significant subcontractor prepayments and client-driven scope/approval delays further push out cash inflows, requiring tight WIP monitoring and strict credit control.
- Long DSO ~60–75 days (2024)
- Milestone billing delays
- Upfront mobilization & subcontractor prepayments
- High exposure to client timing
- Need tight WIP & credit control
Project margin squeeze: public procurement ≈12% GDP, talent gap 85.2M
Project-based margin volatility and fixed-price write-down risk compress earnings and raise claim disputes. Heavy reliance on government-funded infrastructure concentrates client risk given public procurement ≈ 12% of GDP (OECD). Talent shortfall (Korn Ferry 85.2M gap by 2030) and DSO 60–75 days (2024) strain margins and working capital.
| Metric | Value |
|---|---|
| OECD public procurement | ≈12% of GDP |
| Talent gap (Korn Ferry) | 85.2M by 2030 |
| Industry DSO (2024) | 60–75 days |
Same Document Delivered
Oranjewoud SWOT Analysis
This is the actual Oranjewoud SWOT analysis document you’ll receive upon purchase—no surprises, just professional quality. The preview below is taken directly from the full report you'll get, and the complete, editable version is unlocked after checkout. You’re viewing a live preview of the real file; buy now to access the full detailed report.

Dive Deeper Into the Company’s Strategic Blueprint
Oranjewoud’s SWOT snapshot highlights solid infrastructure expertise and niche market positions, balanced against sector cyclicality and integration risks; strategic partnerships and sustainability initiatives emerge as clear growth levers. Want the full story behind strengths, risks, and growth drivers? Purchase the complete SWOT analysis for a professionally written, editable report and Excel matrix to support planning, pitches, and investment decisions.
Strengths
Leading brand via Royal HaskoningDHV
Leveraging Royal HaskoningDHV’s internationally recognised brand and certifications (including ISO 9001/14001), Oranjewoud wins complex, high-margin infrastructure and water mandates by de-risking client selection through decades of marquee project references and trusted public‑private partnerships. This brand strength underpins pricing power and opens access to strategic consortia and joint-venture opportunities.
Diversified sector coverage
Oranjewoud spans infrastructure, water, maritime, aviation, industry, energy and buildings, smoothing sector-specific cycles by balancing public works with regulated water and energy projects.
This multi-sector footprint enables cross-selling across project pipelines, rapid redeployment of engineering talent into high-growth verticals, and spreads risk across end-markets and geographies for portfolio resilience.
Sustainability and lifecycle capability
Oranjewoud leverages deep expertise in sustainable design, climate resilience and circular solutions across the full project lifecycle to link advisory, design, project management and asset optimization into measurable outcomes rather than outputs. ESG-aligned methodologies position the firm strongly in public tenders as EU public procurement equals about 14% of EU GDP and EU climate rules (55% GHG cut target by 2030; 30% EU budget climate tagging) drive demand for decarbonization and adaptation partners.
Global delivery with local insight
Oranjewoud leverages a multinational footprint with local regulatory expertise and stakeholder networks to de-risk projects and navigate permit cycles efficiently; cross-border teams accelerate complex program delivery through integrated project management and shared timelines. Scalable frameworks, shared IP and regional centers of excellence ensure consistent quality and repeatable execution across markets.
- Global footprint + local regulatory know-how
- Cross-border teams speed complex programs
- Scalable frameworks and shared IP
- Centers of excellence drive repeatable quality
Integrated engineering and project management
Oranjewoud delivers end-to-end integration from feasibility and detailed design through construction, commissioning and long-term operations support, maintaining continuity that tightens schedule, cost and risk control via a mature PMO and integrated digital toolchains. Proven claims avoidance and strong safety records reduce client exposure and operational interruptions, lowering total cost of ownership through single-source delivery.
ISO-certified firm: 7-sector reach, ESG & EU climate alignment (55%, 30%, 14%)
Strong Royal HaskoningDHV brand and ISO 9001/14001 certifications win complex, high‑margin mandates. A 7‑sector footprint (infrastructure, water, maritime, aviation, industry, energy, buildings) smooths cyclical risk and enables cross‑selling. Deep ESG, climate resilience and circular expertise aligns with EU targets (55% GHG cut by 2030; 30% EU budget climate tagging) and public procurement (~14% of EU GDP).
| Strength | Evidence | Metric |
|---|---|---|
| Brand & certs | Royal HaskoningDHV; ISO | ISO 9001/14001 |
| Sector breadth | Cross‑selling | 7 sectors |
| ESG alignment | EU policy tailwinds | 55% GHG; 30% budget; 14% GDP |
What is included in the product
Detailed Word Document
Delivers a strategic overview of Oranjewoud’s internal and external business factors, outlining strengths, weaknesses, opportunities, and threats to inform strategic decisions.
Customizable Excel Spreadsheet
Provides a concise, editable SWOT matrix for Oranjewoud to quickly align strategy and relieve pain points across business units, enabling fast stakeholder presentations and easy updates as priorities change.
Weaknesses
Project-based margin volatility
Project-based margin volatility exposes Oranjewoud to scope creep, schedule delays and claim disputes that can materially compress margins. Utilization swings and write-down risk on fixed-price contracts amplify earnings sensitivity to milestone timing and client approvals. Strong, disciplined bid governance and tighter change-order controls are required to limit downside.
Reliance on public sector budgets
Heavy concentration in government-funded infrastructure and water programs exposes Oranjewoud to sector volatility; public procurement accounts for about 12% of GDP on average in OECD countries, amplifying client-concentration risk. Election cycles, austerity measures and permitting slowdowns periodically freeze projects, elongating procurement timelines and creating payment lags. These dynamics impair cash-flow predictability and raise working-capital needs.
Talent attraction and retention pressure
Global scarcity of experienced engineers, project managers and digital specialists—Korn Ferry projects an 85.2 million high‑skill shortfall by 2030—raises hiring pressure for Oranjewoud. Wage inflation in tech and engineering has driven market salaries up, and replacement/retention costs (commonly 20–30% of annual salary) compress margins. Lengthy onboarding and knowledge‑transfer frictions extend ramp‑up time, while dependence on a few key experts concentrates delivery risk for signature projects.
Organizational complexity of a holding
As a holding, Oranjewoud faces coordination challenges across subsidiaries and regions that can slow cross-border project alignment and resource allocation, increase duplication of functions and prolong decision cycles, and create significant integration overhead for shared services and IT systems; this structure can also reduce transparency for investors assessing segment-level performance.
- coordination: cross-subsidiary misalignment
- duplication: overlapping back-office roles
- integration: shared-services complexity
- investor-opacity: harder segment visibility
Working capital intensity
Long receivable cycles from milestone-based billing and upfront mobilization fees increase working capital strain; industry DSO remained elevated in 2024 at around 60–75 days, amplifying cash conversion risk. Significant subcontractor prepayments and client-driven scope/approval delays further push out cash inflows, requiring tight WIP monitoring and strict credit control.
- Long DSO ~60–75 days (2024)
- Milestone billing delays
- Upfront mobilization & subcontractor prepayments
- High exposure to client timing
- Need tight WIP & credit control
Project margin squeeze: public procurement ≈12% GDP, talent gap 85.2M
Project-based margin volatility and fixed-price write-down risk compress earnings and raise claim disputes. Heavy reliance on government-funded infrastructure concentrates client risk given public procurement ≈ 12% of GDP (OECD). Talent shortfall (Korn Ferry 85.2M gap by 2030) and DSO 60–75 days (2024) strain margins and working capital.
| Metric | Value |
|---|---|
| OECD public procurement | ≈12% of GDP |
| Talent gap (Korn Ferry) | 85.2M by 2030 |
| Industry DSO (2024) | 60–75 days |
Same Document Delivered
Oranjewoud SWOT Analysis
This is the actual Oranjewoud SWOT analysis document you’ll receive upon purchase—no surprises, just professional quality. The preview below is taken directly from the full report you'll get, and the complete, editable version is unlocked after checkout. You’re viewing a live preview of the real file; buy now to access the full detailed report.
Description
Dive Deeper Into the Company’s Strategic Blueprint
Oranjewoud’s SWOT snapshot highlights solid infrastructure expertise and niche market positions, balanced against sector cyclicality and integration risks; strategic partnerships and sustainability initiatives emerge as clear growth levers. Want the full story behind strengths, risks, and growth drivers? Purchase the complete SWOT analysis for a professionally written, editable report and Excel matrix to support planning, pitches, and investment decisions.
Strengths
Leading brand via Royal HaskoningDHV
Leveraging Royal HaskoningDHV’s internationally recognised brand and certifications (including ISO 9001/14001), Oranjewoud wins complex, high-margin infrastructure and water mandates by de-risking client selection through decades of marquee project references and trusted public‑private partnerships. This brand strength underpins pricing power and opens access to strategic consortia and joint-venture opportunities.
Diversified sector coverage
Oranjewoud spans infrastructure, water, maritime, aviation, industry, energy and buildings, smoothing sector-specific cycles by balancing public works with regulated water and energy projects.
This multi-sector footprint enables cross-selling across project pipelines, rapid redeployment of engineering talent into high-growth verticals, and spreads risk across end-markets and geographies for portfolio resilience.
Sustainability and lifecycle capability
Oranjewoud leverages deep expertise in sustainable design, climate resilience and circular solutions across the full project lifecycle to link advisory, design, project management and asset optimization into measurable outcomes rather than outputs. ESG-aligned methodologies position the firm strongly in public tenders as EU public procurement equals about 14% of EU GDP and EU climate rules (55% GHG cut target by 2030; 30% EU budget climate tagging) drive demand for decarbonization and adaptation partners.
Global delivery with local insight
Oranjewoud leverages a multinational footprint with local regulatory expertise and stakeholder networks to de-risk projects and navigate permit cycles efficiently; cross-border teams accelerate complex program delivery through integrated project management and shared timelines. Scalable frameworks, shared IP and regional centers of excellence ensure consistent quality and repeatable execution across markets.
- Global footprint + local regulatory know-how
- Cross-border teams speed complex programs
- Scalable frameworks and shared IP
- Centers of excellence drive repeatable quality
Integrated engineering and project management
Oranjewoud delivers end-to-end integration from feasibility and detailed design through construction, commissioning and long-term operations support, maintaining continuity that tightens schedule, cost and risk control via a mature PMO and integrated digital toolchains. Proven claims avoidance and strong safety records reduce client exposure and operational interruptions, lowering total cost of ownership through single-source delivery.
ISO-certified firm: 7-sector reach, ESG & EU climate alignment (55%, 30%, 14%)
Strong Royal HaskoningDHV brand and ISO 9001/14001 certifications win complex, high‑margin mandates. A 7‑sector footprint (infrastructure, water, maritime, aviation, industry, energy, buildings) smooths cyclical risk and enables cross‑selling. Deep ESG, climate resilience and circular expertise aligns with EU targets (55% GHG cut by 2030; 30% EU budget climate tagging) and public procurement (~14% of EU GDP).
| Strength | Evidence | Metric |
|---|---|---|
| Brand & certs | Royal HaskoningDHV; ISO | ISO 9001/14001 |
| Sector breadth | Cross‑selling | 7 sectors |
| ESG alignment | EU policy tailwinds | 55% GHG; 30% budget; 14% GDP |
What is included in the product
Detailed Word Document
Delivers a strategic overview of Oranjewoud’s internal and external business factors, outlining strengths, weaknesses, opportunities, and threats to inform strategic decisions.
Customizable Excel Spreadsheet
Provides a concise, editable SWOT matrix for Oranjewoud to quickly align strategy and relieve pain points across business units, enabling fast stakeholder presentations and easy updates as priorities change.
Weaknesses
Project-based margin volatility
Project-based margin volatility exposes Oranjewoud to scope creep, schedule delays and claim disputes that can materially compress margins. Utilization swings and write-down risk on fixed-price contracts amplify earnings sensitivity to milestone timing and client approvals. Strong, disciplined bid governance and tighter change-order controls are required to limit downside.
Reliance on public sector budgets
Heavy concentration in government-funded infrastructure and water programs exposes Oranjewoud to sector volatility; public procurement accounts for about 12% of GDP on average in OECD countries, amplifying client-concentration risk. Election cycles, austerity measures and permitting slowdowns periodically freeze projects, elongating procurement timelines and creating payment lags. These dynamics impair cash-flow predictability and raise working-capital needs.
Talent attraction and retention pressure
Global scarcity of experienced engineers, project managers and digital specialists—Korn Ferry projects an 85.2 million high‑skill shortfall by 2030—raises hiring pressure for Oranjewoud. Wage inflation in tech and engineering has driven market salaries up, and replacement/retention costs (commonly 20–30% of annual salary) compress margins. Lengthy onboarding and knowledge‑transfer frictions extend ramp‑up time, while dependence on a few key experts concentrates delivery risk for signature projects.
Organizational complexity of a holding
As a holding, Oranjewoud faces coordination challenges across subsidiaries and regions that can slow cross-border project alignment and resource allocation, increase duplication of functions and prolong decision cycles, and create significant integration overhead for shared services and IT systems; this structure can also reduce transparency for investors assessing segment-level performance.
- coordination: cross-subsidiary misalignment
- duplication: overlapping back-office roles
- integration: shared-services complexity
- investor-opacity: harder segment visibility
Working capital intensity
Long receivable cycles from milestone-based billing and upfront mobilization fees increase working capital strain; industry DSO remained elevated in 2024 at around 60–75 days, amplifying cash conversion risk. Significant subcontractor prepayments and client-driven scope/approval delays further push out cash inflows, requiring tight WIP monitoring and strict credit control.
- Long DSO ~60–75 days (2024)
- Milestone billing delays
- Upfront mobilization & subcontractor prepayments
- High exposure to client timing
- Need tight WIP & credit control
Project margin squeeze: public procurement ≈12% GDP, talent gap 85.2M
Project-based margin volatility and fixed-price write-down risk compress earnings and raise claim disputes. Heavy reliance on government-funded infrastructure concentrates client risk given public procurement ≈ 12% of GDP (OECD). Talent shortfall (Korn Ferry 85.2M gap by 2030) and DSO 60–75 days (2024) strain margins and working capital.
| Metric | Value |
|---|---|
| OECD public procurement | ≈12% of GDP |
| Talent gap (Korn Ferry) | 85.2M by 2030 |
| Industry DSO (2024) | 60–75 days |
Same Document Delivered
Oranjewoud SWOT Analysis
This is the actual Oranjewoud SWOT analysis document you’ll receive upon purchase—no surprises, just professional quality. The preview below is taken directly from the full report you'll get, and the complete, editable version is unlocked after checkout. You’re viewing a live preview of the real file; buy now to access the full detailed report.











