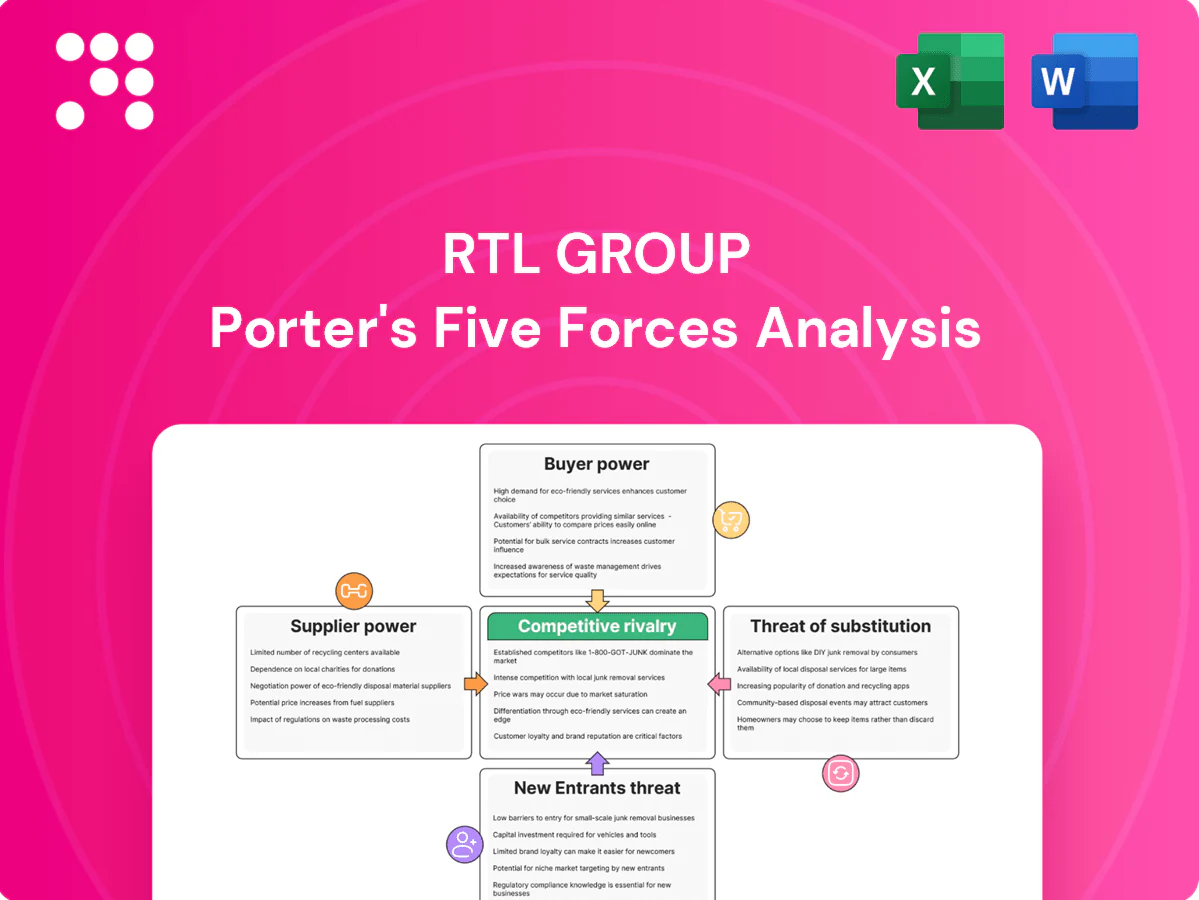
RTL Group Porter's Five Forces Analysis

A Must-Have Tool for Decision-Makers
RTL Group faces intense competitive rivalry, evolving buyer preferences and digital substitutes that pressure ad revenues, while content costs and platform partners shape supplier power and distribution dynamics. Regulatory shifts and streaming entrants raise the threat of new competition and substitute offerings. The complete report reveals the real forces shaping RTL Group’s industry—from supplier influence to threat of new entrants. Gain actionable insights to drive smarter decision-making.
Suppliers Bargaining Power

Premium rights holders set terms
Sports leagues, major studios and format owners—exemplified by events like UEFA EURO 2024—set high fees and restrictive windows that drive up RTL’s programming costs. Their scarcity and audience pull give them leverage in renewals, forcing RTL to balance escalating rights spend against audience retention and ad yields. Losing marquee rights can materially dent ratings and pricing power, making renewals strategically critical.
Talent and production costs inflate
On-screen talent, showrunners and crews are scarce for hit franchises, with SAG-AFTRA at roughly 160,000 members and the 2023 labor disruptions (WGA 148 days, SAG-AFTRA ~118 days) driving wage inflation and higher union minimums that push production budgets up. Scheduling bottlenecks from strike-era backlogs delay launches and revenue timing. RTL needs long-term deals and pipeline visibility to mitigate cost spikes and timing risk.

Tech vendors and CDNs influence streaming QoS
Cloud, CDN, ad-tech and measurement vendors directly shape streaming QoS and ad monetization, with the top three cloud providers holding roughly 66% of the global cloud infrastructure market in 2024, concentrating leverage. Complex integrations and data continuity create high switching costs and operational risk across platforms. Vendor consolidation has tightened pricing and negotiation flexibility for broadcasters. Multi-vendor strategies and growing in-house stack investments reduce dependency and preserve bargaining power.

Distribution platforms can gate access
Pay-TV operators, device OEMs, and app stores gate placement and data access, with app stores commonly taking 15–30% revenue shares in 2024. Carriage terms, revenue splits, and data rights directly shape subscription and ad economics. Prominence on connected TVs, which dominate living-room streaming, materially affects discovery and churn, so RTL must negotiate for data sharing and favorable positioning.
- gatekeepers: pay-TV, OEMs, app stores
- fees: app store revenue share 15–30% (2024)
- economics: carriage + data rights determine ARPU
- priority: CTV placement reduces churn, boosts discovery
Vertical integration via Fremantle offsets power
Owning Fremantle secures proven IP such as Got Talent and Idols, internalizing margins and reducing reliance on external format suppliers; this strengthens RTL’s negotiating position and lowers content procurement costs in 2024. Global format recycling across territories spreads hit-risk, though RTL still competes with Fremantle’s external clients for prime slots and top creative talent.
Sports rights, talent scarcity, cloud consolidation and app-store fees squeeze broadcasters' margins
Sports leagues/studios demand high rights fees (UEFA EURO 2024) and scarce talent (SAG-AFTRA ~160,000; 2023 WGA 148d, SAG-AFTRA ~118d), raising RTL’s programming costs and timing risk. Cloud/CDN consolidation gives top 3 providers ~66% market share (2024), tightening vendor leverage. App stores take 15–30% revenue share (2024), affecting ARPU. Fremantle ownership reduces supplier dependence.
| Supplier | 2024 metric | Impact |
|---|---|---|
| Rights owners | UEFA EURO 2024: high fees | ↑costs |
| Talent | SAG-AFTRA ~160,000 | ↑wages/scheduling risk |
| Cloud/CDN | Top3 ~66% | ↑vendor leverage |
| App stores | 15–30% rev share | ↓ARPU |
What is included in the product
 Detailed Word Document
Uncovers key drivers of competition, customer influence, and market entry risks for RTL Group, detailing competitive forces, supplier/buyer power, substitutes and disruptive threats; fully editable for inclusion in reports and decks.

 Customizable Excel Spreadsheet
A concise Porter's Five Forces one-sheet for RTL Group that eliminates analysis bottlenecks—clearly highlighting competitor, buyer, supplier, entrant, and substitution pressures with customizable scores and export-ready radar visuals for instant, slide-ready strategic decisions.
Customers Bargaining Power

Advertisers and agencies consolidate spend
In 2024 large media-buying groups leveraged scale to secure CPM discounts of up to 25% and more flexible terms, concentrating spend with fewer partners. Cross-media planners reallocated budgets rapidly toward higher-ROI channels as digital reached roughly 64% of global ad spend in 2024. Rising performance demands required end-to-end measurement transparency; RTL must offer differentiated audiences and validated outcomes to defend pricing and CPMs.
Viewers have low switching costs
Audiences can flip easily between free-to-air, SVOD, AVOD and social video, with platforms like YouTube exceeding 2 billion monthly users, raising substitution risk. Recommendation engines (Netflix cites ~80% of viewing) and improved discovery amplify switching. Streaming churn averages roughly 3–7% monthly, increasing revenue volatility. Consistent exclusives and UX gains are therefore critical to retention.

Programmatic buying increases price sensitivity
Programmatic buying now drives roughly 80% of global display spend in 2024, commoditizing inventory when auctions lack strong data or contextual signals. Buyers optimizing to ROAS push down rates on generalist impressions, squeezing CPMs and margins. Data-privacy shifts (eg, post-IDFA changes) have cut targeting precision by an estimated 25%, further empowering price-sensitive buyers. RTL’s first-party data and premium contextual environments can restore yield, often delivering ~30% higher CPMs for verified premium inventory.

Distribution partners demand economics
Pay-TV and CTV platforms demand carriage fees, rev-shares and promotional slots, with industry practice often seeing rev-share splits in the 30–50% range and significant upfront carriage payments.
Bundles by distributors can place multiple competing channels together, weakening channel differentiation and pressuring CPMs and affiliate fees.
Platform-controlled data and restricted first-party access in 2024 limit RTL’s direct monetization and targeted-ad revenue; negotiations center on must-carry rights and demonstrated audience scale.
- rev-share: 30–50% reported
- carriage vs promo: traded in contracts
- data access: platform-controlled in 2024
- leverage: must-carry content + audience scale
Local advertisers value reach but expect proof
Regional SMEs still lean on TV for brand lift but insist on measurable ROI; 2024 RTL pilots reported ~28% incremental reach and 22% higher attribution from cross-platform buys, making proof a bargaining lever. Unified measurement across linear and digital is decisive for procurement decisions, and geo-lift tests plus case studies materially reduce buyer price sensitivity.
- SME demand: attribution-first
- Cross-platform: incremental reach crucial
- Measurement: unified metrics win
- Evidence: geo-lift & case studies
Buyers control: digital 64%, CPMs down up to 25%
Buyers wield strong leverage in 2024: large buyers secured CPM discounts up to 25% and shifted spend as digital reached 64% of global ad spend, while programmatic drove ~80% of display spend, commoditizing generic inventory. Privacy changes cut targeting precision ~25%, pressuring rates; premium contextual inventory and first-party data delivered ~30% higher CPMs. Pay-TV/CTV rev-shares of 30–50% and 3–7% monthly streaming churn raise negotiation complexity.
| Metric | 2024 |
|---|---|
| Digital share | 64% |
| Programmatic display | ~80% |
| Buyer CPM discount | up to 25% |
| Targeting precision loss | ~25% |
| Premium CPM uplift | ~30% |
| Pay-TV/CTV rev-share | 30–50% |
| Streaming churn | 3–7%/mo |
| RTL pilot uplift | +28% reach / +22% attribution |
Full Version Awaits
RTL Group Porter's Five Forces Analysis
This RTL Group Porter's Five Forces Analysis preview is the exact, professionally formatted document you’ll receive instantly after purchase. It contains the full assessment of competitive rivalry, supplier and buyer power, threat of entry and substitutes. No placeholders or samples—ready for download and immediate use.

A Must-Have Tool for Decision-Makers
RTL Group faces intense competitive rivalry, evolving buyer preferences and digital substitutes that pressure ad revenues, while content costs and platform partners shape supplier power and distribution dynamics. Regulatory shifts and streaming entrants raise the threat of new competition and substitute offerings. The complete report reveals the real forces shaping RTL Group’s industry—from supplier influence to threat of new entrants. Gain actionable insights to drive smarter decision-making.
Suppliers Bargaining Power
Premium rights holders set terms
Sports leagues, major studios and format owners—exemplified by events like UEFA EURO 2024—set high fees and restrictive windows that drive up RTL’s programming costs. Their scarcity and audience pull give them leverage in renewals, forcing RTL to balance escalating rights spend against audience retention and ad yields. Losing marquee rights can materially dent ratings and pricing power, making renewals strategically critical.
Talent and production costs inflate
On-screen talent, showrunners and crews are scarce for hit franchises, with SAG-AFTRA at roughly 160,000 members and the 2023 labor disruptions (WGA 148 days, SAG-AFTRA ~118 days) driving wage inflation and higher union minimums that push production budgets up. Scheduling bottlenecks from strike-era backlogs delay launches and revenue timing. RTL needs long-term deals and pipeline visibility to mitigate cost spikes and timing risk.
Tech vendors and CDNs influence streaming QoS
Cloud, CDN, ad-tech and measurement vendors directly shape streaming QoS and ad monetization, with the top three cloud providers holding roughly 66% of the global cloud infrastructure market in 2024, concentrating leverage. Complex integrations and data continuity create high switching costs and operational risk across platforms. Vendor consolidation has tightened pricing and negotiation flexibility for broadcasters. Multi-vendor strategies and growing in-house stack investments reduce dependency and preserve bargaining power.
Distribution platforms can gate access
Pay-TV operators, device OEMs, and app stores gate placement and data access, with app stores commonly taking 15–30% revenue shares in 2024. Carriage terms, revenue splits, and data rights directly shape subscription and ad economics. Prominence on connected TVs, which dominate living-room streaming, materially affects discovery and churn, so RTL must negotiate for data sharing and favorable positioning.
- gatekeepers: pay-TV, OEMs, app stores
- fees: app store revenue share 15–30% (2024)
- economics: carriage + data rights determine ARPU
- priority: CTV placement reduces churn, boosts discovery
Vertical integration via Fremantle offsets power
Owning Fremantle secures proven IP such as Got Talent and Idols, internalizing margins and reducing reliance on external format suppliers; this strengthens RTL’s negotiating position and lowers content procurement costs in 2024. Global format recycling across territories spreads hit-risk, though RTL still competes with Fremantle’s external clients for prime slots and top creative talent.
Sports rights, talent scarcity, cloud consolidation and app-store fees squeeze broadcasters' margins
Sports leagues/studios demand high rights fees (UEFA EURO 2024) and scarce talent (SAG-AFTRA ~160,000; 2023 WGA 148d, SAG-AFTRA ~118d), raising RTL’s programming costs and timing risk. Cloud/CDN consolidation gives top 3 providers ~66% market share (2024), tightening vendor leverage. App stores take 15–30% revenue share (2024), affecting ARPU. Fremantle ownership reduces supplier dependence.
| Supplier | 2024 metric | Impact |
|---|---|---|
| Rights owners | UEFA EURO 2024: high fees | ↑costs |
| Talent | SAG-AFTRA ~160,000 | ↑wages/scheduling risk |
| Cloud/CDN | Top3 ~66% | ↑vendor leverage |
| App stores | 15–30% rev share | ↓ARPU |
What is included in the product
Detailed Word Document
Uncovers key drivers of competition, customer influence, and market entry risks for RTL Group, detailing competitive forces, supplier/buyer power, substitutes and disruptive threats; fully editable for inclusion in reports and decks.
Customizable Excel Spreadsheet
A concise Porter's Five Forces one-sheet for RTL Group that eliminates analysis bottlenecks—clearly highlighting competitor, buyer, supplier, entrant, and substitution pressures with customizable scores and export-ready radar visuals for instant, slide-ready strategic decisions.
Customers Bargaining Power
Advertisers and agencies consolidate spend
In 2024 large media-buying groups leveraged scale to secure CPM discounts of up to 25% and more flexible terms, concentrating spend with fewer partners. Cross-media planners reallocated budgets rapidly toward higher-ROI channels as digital reached roughly 64% of global ad spend in 2024. Rising performance demands required end-to-end measurement transparency; RTL must offer differentiated audiences and validated outcomes to defend pricing and CPMs.
Viewers have low switching costs
Audiences can flip easily between free-to-air, SVOD, AVOD and social video, with platforms like YouTube exceeding 2 billion monthly users, raising substitution risk. Recommendation engines (Netflix cites ~80% of viewing) and improved discovery amplify switching. Streaming churn averages roughly 3–7% monthly, increasing revenue volatility. Consistent exclusives and UX gains are therefore critical to retention.
Programmatic buying increases price sensitivity
Programmatic buying now drives roughly 80% of global display spend in 2024, commoditizing inventory when auctions lack strong data or contextual signals. Buyers optimizing to ROAS push down rates on generalist impressions, squeezing CPMs and margins. Data-privacy shifts (eg, post-IDFA changes) have cut targeting precision by an estimated 25%, further empowering price-sensitive buyers. RTL’s first-party data and premium contextual environments can restore yield, often delivering ~30% higher CPMs for verified premium inventory.
Distribution partners demand economics
Pay-TV and CTV platforms demand carriage fees, rev-shares and promotional slots, with industry practice often seeing rev-share splits in the 30–50% range and significant upfront carriage payments.
Bundles by distributors can place multiple competing channels together, weakening channel differentiation and pressuring CPMs and affiliate fees.
Platform-controlled data and restricted first-party access in 2024 limit RTL’s direct monetization and targeted-ad revenue; negotiations center on must-carry rights and demonstrated audience scale.
- rev-share: 30–50% reported
- carriage vs promo: traded in contracts
- data access: platform-controlled in 2024
- leverage: must-carry content + audience scale
Local advertisers value reach but expect proof
Regional SMEs still lean on TV for brand lift but insist on measurable ROI; 2024 RTL pilots reported ~28% incremental reach and 22% higher attribution from cross-platform buys, making proof a bargaining lever. Unified measurement across linear and digital is decisive for procurement decisions, and geo-lift tests plus case studies materially reduce buyer price sensitivity.
- SME demand: attribution-first
- Cross-platform: incremental reach crucial
- Measurement: unified metrics win
- Evidence: geo-lift & case studies
Buyers control: digital 64%, CPMs down up to 25%
Buyers wield strong leverage in 2024: large buyers secured CPM discounts up to 25% and shifted spend as digital reached 64% of global ad spend, while programmatic drove ~80% of display spend, commoditizing generic inventory. Privacy changes cut targeting precision ~25%, pressuring rates; premium contextual inventory and first-party data delivered ~30% higher CPMs. Pay-TV/CTV rev-shares of 30–50% and 3–7% monthly streaming churn raise negotiation complexity.
| Metric | 2024 |
|---|---|
| Digital share | 64% |
| Programmatic display | ~80% |
| Buyer CPM discount | up to 25% |
| Targeting precision loss | ~25% |
| Premium CPM uplift | ~30% |
| Pay-TV/CTV rev-share | 30–50% |
| Streaming churn | 3–7%/mo |
| RTL pilot uplift | +28% reach / +22% attribution |
Full Version Awaits
RTL Group Porter's Five Forces Analysis
This RTL Group Porter's Five Forces Analysis preview is the exact, professionally formatted document you’ll receive instantly after purchase. It contains the full assessment of competitive rivalry, supplier and buyer power, threat of entry and substitutes. No placeholders or samples—ready for download and immediate use.
Description
A Must-Have Tool for Decision-Makers
RTL Group faces intense competitive rivalry, evolving buyer preferences and digital substitutes that pressure ad revenues, while content costs and platform partners shape supplier power and distribution dynamics. Regulatory shifts and streaming entrants raise the threat of new competition and substitute offerings. The complete report reveals the real forces shaping RTL Group’s industry—from supplier influence to threat of new entrants. Gain actionable insights to drive smarter decision-making.
Suppliers Bargaining Power
Premium rights holders set terms
Sports leagues, major studios and format owners—exemplified by events like UEFA EURO 2024—set high fees and restrictive windows that drive up RTL’s programming costs. Their scarcity and audience pull give them leverage in renewals, forcing RTL to balance escalating rights spend against audience retention and ad yields. Losing marquee rights can materially dent ratings and pricing power, making renewals strategically critical.
Talent and production costs inflate
On-screen talent, showrunners and crews are scarce for hit franchises, with SAG-AFTRA at roughly 160,000 members and the 2023 labor disruptions (WGA 148 days, SAG-AFTRA ~118 days) driving wage inflation and higher union minimums that push production budgets up. Scheduling bottlenecks from strike-era backlogs delay launches and revenue timing. RTL needs long-term deals and pipeline visibility to mitigate cost spikes and timing risk.
Tech vendors and CDNs influence streaming QoS
Cloud, CDN, ad-tech and measurement vendors directly shape streaming QoS and ad monetization, with the top three cloud providers holding roughly 66% of the global cloud infrastructure market in 2024, concentrating leverage. Complex integrations and data continuity create high switching costs and operational risk across platforms. Vendor consolidation has tightened pricing and negotiation flexibility for broadcasters. Multi-vendor strategies and growing in-house stack investments reduce dependency and preserve bargaining power.
Distribution platforms can gate access
Pay-TV operators, device OEMs, and app stores gate placement and data access, with app stores commonly taking 15–30% revenue shares in 2024. Carriage terms, revenue splits, and data rights directly shape subscription and ad economics. Prominence on connected TVs, which dominate living-room streaming, materially affects discovery and churn, so RTL must negotiate for data sharing and favorable positioning.
- gatekeepers: pay-TV, OEMs, app stores
- fees: app store revenue share 15–30% (2024)
- economics: carriage + data rights determine ARPU
- priority: CTV placement reduces churn, boosts discovery
Vertical integration via Fremantle offsets power
Owning Fremantle secures proven IP such as Got Talent and Idols, internalizing margins and reducing reliance on external format suppliers; this strengthens RTL’s negotiating position and lowers content procurement costs in 2024. Global format recycling across territories spreads hit-risk, though RTL still competes with Fremantle’s external clients for prime slots and top creative talent.
Sports rights, talent scarcity, cloud consolidation and app-store fees squeeze broadcasters' margins
Sports leagues/studios demand high rights fees (UEFA EURO 2024) and scarce talent (SAG-AFTRA ~160,000; 2023 WGA 148d, SAG-AFTRA ~118d), raising RTL’s programming costs and timing risk. Cloud/CDN consolidation gives top 3 providers ~66% market share (2024), tightening vendor leverage. App stores take 15–30% revenue share (2024), affecting ARPU. Fremantle ownership reduces supplier dependence.
| Supplier | 2024 metric | Impact |
|---|---|---|
| Rights owners | UEFA EURO 2024: high fees | ↑costs |
| Talent | SAG-AFTRA ~160,000 | ↑wages/scheduling risk |
| Cloud/CDN | Top3 ~66% | ↑vendor leverage |
| App stores | 15–30% rev share | ↓ARPU |
What is included in the product
Detailed Word Document
Uncovers key drivers of competition, customer influence, and market entry risks for RTL Group, detailing competitive forces, supplier/buyer power, substitutes and disruptive threats; fully editable for inclusion in reports and decks.
Customizable Excel Spreadsheet
A concise Porter's Five Forces one-sheet for RTL Group that eliminates analysis bottlenecks—clearly highlighting competitor, buyer, supplier, entrant, and substitution pressures with customizable scores and export-ready radar visuals for instant, slide-ready strategic decisions.
Customers Bargaining Power
Advertisers and agencies consolidate spend
In 2024 large media-buying groups leveraged scale to secure CPM discounts of up to 25% and more flexible terms, concentrating spend with fewer partners. Cross-media planners reallocated budgets rapidly toward higher-ROI channels as digital reached roughly 64% of global ad spend in 2024. Rising performance demands required end-to-end measurement transparency; RTL must offer differentiated audiences and validated outcomes to defend pricing and CPMs.
Viewers have low switching costs
Audiences can flip easily between free-to-air, SVOD, AVOD and social video, with platforms like YouTube exceeding 2 billion monthly users, raising substitution risk. Recommendation engines (Netflix cites ~80% of viewing) and improved discovery amplify switching. Streaming churn averages roughly 3–7% monthly, increasing revenue volatility. Consistent exclusives and UX gains are therefore critical to retention.
Programmatic buying increases price sensitivity
Programmatic buying now drives roughly 80% of global display spend in 2024, commoditizing inventory when auctions lack strong data or contextual signals. Buyers optimizing to ROAS push down rates on generalist impressions, squeezing CPMs and margins. Data-privacy shifts (eg, post-IDFA changes) have cut targeting precision by an estimated 25%, further empowering price-sensitive buyers. RTL’s first-party data and premium contextual environments can restore yield, often delivering ~30% higher CPMs for verified premium inventory.
Distribution partners demand economics
Pay-TV and CTV platforms demand carriage fees, rev-shares and promotional slots, with industry practice often seeing rev-share splits in the 30–50% range and significant upfront carriage payments.
Bundles by distributors can place multiple competing channels together, weakening channel differentiation and pressuring CPMs and affiliate fees.
Platform-controlled data and restricted first-party access in 2024 limit RTL’s direct monetization and targeted-ad revenue; negotiations center on must-carry rights and demonstrated audience scale.
- rev-share: 30–50% reported
- carriage vs promo: traded in contracts
- data access: platform-controlled in 2024
- leverage: must-carry content + audience scale
Local advertisers value reach but expect proof
Regional SMEs still lean on TV for brand lift but insist on measurable ROI; 2024 RTL pilots reported ~28% incremental reach and 22% higher attribution from cross-platform buys, making proof a bargaining lever. Unified measurement across linear and digital is decisive for procurement decisions, and geo-lift tests plus case studies materially reduce buyer price sensitivity.
- SME demand: attribution-first
- Cross-platform: incremental reach crucial
- Measurement: unified metrics win
- Evidence: geo-lift & case studies
Buyers control: digital 64%, CPMs down up to 25%
Buyers wield strong leverage in 2024: large buyers secured CPM discounts up to 25% and shifted spend as digital reached 64% of global ad spend, while programmatic drove ~80% of display spend, commoditizing generic inventory. Privacy changes cut targeting precision ~25%, pressuring rates; premium contextual inventory and first-party data delivered ~30% higher CPMs. Pay-TV/CTV rev-shares of 30–50% and 3–7% monthly streaming churn raise negotiation complexity.
| Metric | 2024 |
|---|---|
| Digital share | 64% |
| Programmatic display | ~80% |
| Buyer CPM discount | up to 25% |
| Targeting precision loss | ~25% |
| Premium CPM uplift | ~30% |
| Pay-TV/CTV rev-share | 30–50% |
| Streaming churn | 3–7%/mo |
| RTL pilot uplift | +28% reach / +22% attribution |
Full Version Awaits
RTL Group Porter's Five Forces Analysis
This RTL Group Porter's Five Forces Analysis preview is the exact, professionally formatted document you’ll receive instantly after purchase. It contains the full assessment of competitive rivalry, supplier and buyer power, threat of entry and substitutes. No placeholders or samples—ready for download and immediate use.











