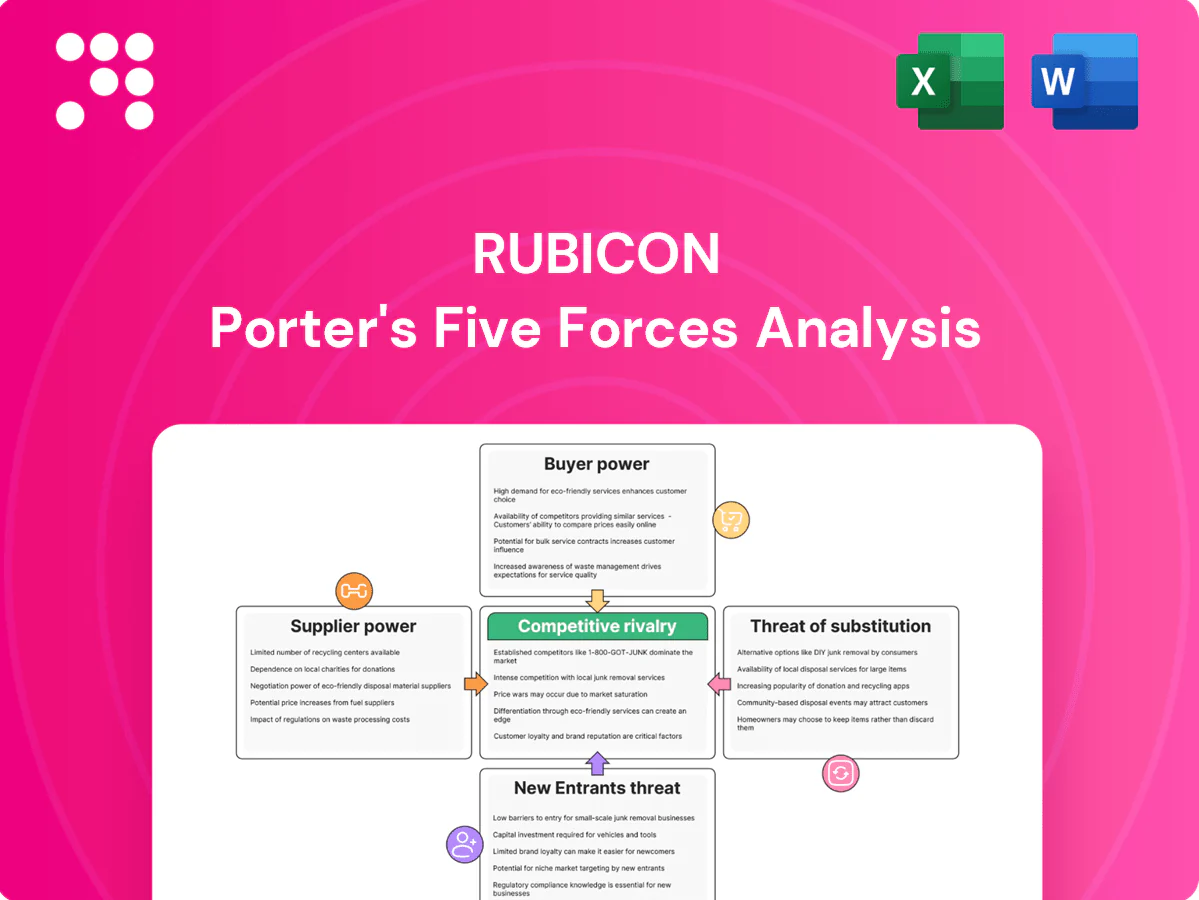
Rubicon Porter's Five Forces Analysis

Don't Miss the Bigger Picture
Rubicon’s Porter's Five Forces snapshot highlights supplier concentration, buyer leverage, competitive rivalry, barriers to entry, and substitute risks shaping its strategy and margins. It identifies where pricing power and vulnerabilities lie to inform tactical moves. This brief only scratches the surface — unlock the full Porter's Five Forces Analysis for force-by-force ratings, visuals, and actionable recommendations.
Suppliers Bargaining Power

Fragmented hauler network
Independent haulers number an estimated 20,000+ in the US (2024), creating a fragmented supply base that limits any single supplier’s leverage. Rubicon can multi-home haulers and rebalance volumes across hundreds of providers, enabling competitive bidding for routes and services. Localized scarcity, however, can raise supplier power in specific metros where few operators dominate.
Local capacity constraints
In dense urban and remote rural areas, hauling and MRF capacity is frequently tight, and when disposal sites or transfer stations are limited suppliers gain pricing leverage, raising local take rates; industry reports noted seasonal tonnage surges of roughly 20–30% during peak periods in 2024. Regulatory restrictions on routing and hours-of-operation in 2024 further constrained capacity and reduced Rubicon’s negotiating room locally. These dynamics compress margins where local supplier concentration is high and transfer/disposal access is scarce.

Specialized recycling capabilities
Specialty recyclers for hazardous, e-waste and organics are relatively few and technically sophisticated, and their scarcity raises supplier bargaining power. Global e-waste reached 59.3 million tonnes in 2021 (UNU), underscoring growing demand for certified handlers and tighter compliance. Certification and quality controls reduce substitutability, so Rubicon must balance offering niche streams against higher per-ton processing costs.

Input cost volatility pass-through
Fuel, labor, landfill tip fees and equipment costs are highly volatile and are frequently passed through to customers via surcharges or index-linked adjustments; diesel-linked fuel surcharges tied to the DOE weekly diesel price are common. Rubicon’s contract clauses and real-time data transparency can dampen but not eliminate pass-throughs, while shorter contract terms and benchmarking reduce exposure to prolonged spikes.
- Fuel: DOE diesel index-linked surcharges
- Labor: wage pressure reflected in short-term escalators
- Tip fees: ~55 USD/ton in many US regions (2024)
- Mitigants: shorter terms, benchmarking, data transparency
Platform dependence incentives
As haulers gain steady volume and route density via the platform, dependence increases and platform features like integrated dispatch, payment, and reputation systems raise switching frictions; comparable platforms saw ~30% higher route density and 20–35% lower churn in 2024 case studies. Over time this reduces supplier bargaining power as incentives and performance scores align carrier and platform interests. Incentive programs tie pay to metrics, reinforcing lock-in.
- Platform dependence: higher route density (~30% 2024)
- Switching friction: integrated dispatch/payment/reputation
- Supplier power: reduced over time via alignment
- Incentives: performance scores + pay links lower churn (20–35% 2024)
Fragmented haulers; platform boosts routes and cuts churn 30% / 20–35%
Supplier base is fragmented (20,000+ independent haulers in US, 2024), limiting single-supplier leverage but creating local concentration risks. Local capacity tightness and limited transfer/disposal sites raise bargaining power (seasonal tonnage surges 20–30%, 2024); tip fees ~55 USD/ton. Platform features increase route density (~30%) and cut churn (20–35%), reducing supplier power over time.
| Metric | 2024 value |
|---|---|
| Independent haulers | 20,000+ |
| Seasonal surge | 20–30% |
| Tip fees (many US regions) | ~55 USD/ton |
| Route density lift | ~30% |
| Churn reduction | 20–35% |
What is included in the product
 Detailed Word Document
Tailored Five Forces analysis for Rubicon that uncovers competitive drivers, supplier and buyer power, entry barriers, substitute threats, and disruptive forces to inform pricing, strategy, and investor materials.

 Customizable Excel Spreadsheet
A one-sheet Rubicon Porter's Five Forces summary that quantifies competitive pressure and highlights priority threats for rapid strategic decisions. Editable scores and radar visualization make it easy to test scenarios, export to slides, and onboard non-finance stakeholders.
Customers Bargaining Power

Enterprise multi-site buyers
Enterprise multi-site buyers — exemplified by Walmart (FY2024 net sales $611.3B) — aggregate massive volumes, run competitive RFPs and insist on national pricing and SLAs across hundreds of sites.
Their scale yields strong bargaining power over rates, data access and feature sets, often dictating contract terms and KPIs.
Winning these accounts requires analytics-driven cost savings and verifiable sustainability outcomes (e.g., scope 3 reductions) to meet procurement and ESG demands.
Price transparency and benchmarking
Rubicon’s data increases buyer visibility into local market prices, allowing procurement teams to benchmark supplier fees and identify outliers. Benchmarking fuels tougher negotiations and credible threats of provider switching, while buyers unbundle service levels and demand outcome-based fees. This dynamic keeps take rates compressed, especially where vendors cannot demonstrate clear ROI, pressuring margins and contract terms.

Low switching costs for basic hauling
For standard waste streams customers often sign 12-month contracts with opt-outs tied to service quality; alternatives include direct hauler deals or rival platforms. Switching remains feasible when data migration and site onboarding are straightforward (often days), and low transactional costs keep buyer leverage high. Value-add analytics improve retention but do not remove switching incentives for price-sensitive accounts.

Sustainability reporting demands
Buyers increasingly demand diversion reporting, ESG metrics and compliance docs; as of 2024 over 50,000 firms fall under EU CSRD and ~93% of S&P 500 publish sustainability reports. If Rubicon’s insights materially advance ESG targets, buyer power diminishes; without unique reporting, customers can commoditize bids. Verified data and third-party audits serve as clear differentiation levers.
- ESG-enabled insights reduce buyer leverage
- CSRD: ~50,000 firms require reporting
- Verified audits = pricing premium
Procurement sophistication
Corporate procurement at Rubicon-level clients applies category strategies, reverse auctions and KPI-tied sourcing, increasing buyer leverage and pricing discipline; Deloitte 2024 CPO Survey reports 71% use category strategies and 42% use reverse-auction mechanisms.
Multi-year, performance-tied contracts align incentives and cut churn; procurement-led deals delivered median cost savings of about 8% and diversion lift near 10% in 2024, essential to defend margin.
- Category strategies: 71% (Deloitte 2024)
- Reverse auctions: 42% (Deloitte 2024)
- Median cost savings: ~8% (2024 reported outcomes)
- Diversion lift: ~10% (2024 reported outcomes)
Enterprise RFPs and ESG audits force suppliers to prove ROI or lose national contracts
Large enterprise buyers (e.g., Walmart FY2024 net sales $611.3B) aggregate volume, run RFPs and force national pricing, squeezing rates and SLAs. Data/benchmarking (Rubicon) and ESG reporting (CSRD ~50,000 firms; ~93% S&P 500 report) increase switching threats unless suppliers prove ROI via verified audits. Category strategies (71%) and reverse auctions (42%) keep take rates compressed; performance contracts yield ~8% cost savings and ~10% diversion lift.
| Metric | 2024 |
|---|---|
| Walmart net sales | $611.3B |
| CSRD scope | ~50,000 firms |
| S&P 500 sustainability reports | ~93% |
| Category strategies | 71% (Deloitte) |
| Reverse auctions | 42% (Deloitte) |
| Median cost savings | ~8% |
| Diversion lift | ~10% |
Full Version Awaits
Rubicon Porter's Five Forces Analysis
This preview is the exact Rubicon Porter’s Five Forces analysis you’ll receive—complete, professionally formatted, and ready for use. It contains the full competitive assessment, supporting rationale, and actionable insights with no placeholders or samples. Purchase grants immediate access to this identical file for download.

Don't Miss the Bigger Picture
Rubicon’s Porter's Five Forces snapshot highlights supplier concentration, buyer leverage, competitive rivalry, barriers to entry, and substitute risks shaping its strategy and margins. It identifies where pricing power and vulnerabilities lie to inform tactical moves. This brief only scratches the surface — unlock the full Porter's Five Forces Analysis for force-by-force ratings, visuals, and actionable recommendations.
Suppliers Bargaining Power
Fragmented hauler network
Independent haulers number an estimated 20,000+ in the US (2024), creating a fragmented supply base that limits any single supplier’s leverage. Rubicon can multi-home haulers and rebalance volumes across hundreds of providers, enabling competitive bidding for routes and services. Localized scarcity, however, can raise supplier power in specific metros where few operators dominate.
Local capacity constraints
In dense urban and remote rural areas, hauling and MRF capacity is frequently tight, and when disposal sites or transfer stations are limited suppliers gain pricing leverage, raising local take rates; industry reports noted seasonal tonnage surges of roughly 20–30% during peak periods in 2024. Regulatory restrictions on routing and hours-of-operation in 2024 further constrained capacity and reduced Rubicon’s negotiating room locally. These dynamics compress margins where local supplier concentration is high and transfer/disposal access is scarce.
Specialized recycling capabilities
Specialty recyclers for hazardous, e-waste and organics are relatively few and technically sophisticated, and their scarcity raises supplier bargaining power. Global e-waste reached 59.3 million tonnes in 2021 (UNU), underscoring growing demand for certified handlers and tighter compliance. Certification and quality controls reduce substitutability, so Rubicon must balance offering niche streams against higher per-ton processing costs.
Input cost volatility pass-through
Fuel, labor, landfill tip fees and equipment costs are highly volatile and are frequently passed through to customers via surcharges or index-linked adjustments; diesel-linked fuel surcharges tied to the DOE weekly diesel price are common. Rubicon’s contract clauses and real-time data transparency can dampen but not eliminate pass-throughs, while shorter contract terms and benchmarking reduce exposure to prolonged spikes.
- Fuel: DOE diesel index-linked surcharges
- Labor: wage pressure reflected in short-term escalators
- Tip fees: ~55 USD/ton in many US regions (2024)
- Mitigants: shorter terms, benchmarking, data transparency
Platform dependence incentives
As haulers gain steady volume and route density via the platform, dependence increases and platform features like integrated dispatch, payment, and reputation systems raise switching frictions; comparable platforms saw ~30% higher route density and 20–35% lower churn in 2024 case studies. Over time this reduces supplier bargaining power as incentives and performance scores align carrier and platform interests. Incentive programs tie pay to metrics, reinforcing lock-in.
- Platform dependence: higher route density (~30% 2024)
- Switching friction: integrated dispatch/payment/reputation
- Supplier power: reduced over time via alignment
- Incentives: performance scores + pay links lower churn (20–35% 2024)
Fragmented haulers; platform boosts routes and cuts churn 30% / 20–35%
Supplier base is fragmented (20,000+ independent haulers in US, 2024), limiting single-supplier leverage but creating local concentration risks. Local capacity tightness and limited transfer/disposal sites raise bargaining power (seasonal tonnage surges 20–30%, 2024); tip fees ~55 USD/ton. Platform features increase route density (~30%) and cut churn (20–35%), reducing supplier power over time.
| Metric | 2024 value |
|---|---|
| Independent haulers | 20,000+ |
| Seasonal surge | 20–30% |
| Tip fees (many US regions) | ~55 USD/ton |
| Route density lift | ~30% |
| Churn reduction | 20–35% |
What is included in the product
Detailed Word Document
Tailored Five Forces analysis for Rubicon that uncovers competitive drivers, supplier and buyer power, entry barriers, substitute threats, and disruptive forces to inform pricing, strategy, and investor materials.
Customizable Excel Spreadsheet
A one-sheet Rubicon Porter's Five Forces summary that quantifies competitive pressure and highlights priority threats for rapid strategic decisions. Editable scores and radar visualization make it easy to test scenarios, export to slides, and onboard non-finance stakeholders.
Customers Bargaining Power
Enterprise multi-site buyers
Enterprise multi-site buyers — exemplified by Walmart (FY2024 net sales $611.3B) — aggregate massive volumes, run competitive RFPs and insist on national pricing and SLAs across hundreds of sites.
Their scale yields strong bargaining power over rates, data access and feature sets, often dictating contract terms and KPIs.
Winning these accounts requires analytics-driven cost savings and verifiable sustainability outcomes (e.g., scope 3 reductions) to meet procurement and ESG demands.
Price transparency and benchmarking
Rubicon’s data increases buyer visibility into local market prices, allowing procurement teams to benchmark supplier fees and identify outliers. Benchmarking fuels tougher negotiations and credible threats of provider switching, while buyers unbundle service levels and demand outcome-based fees. This dynamic keeps take rates compressed, especially where vendors cannot demonstrate clear ROI, pressuring margins and contract terms.
Low switching costs for basic hauling
For standard waste streams customers often sign 12-month contracts with opt-outs tied to service quality; alternatives include direct hauler deals or rival platforms. Switching remains feasible when data migration and site onboarding are straightforward (often days), and low transactional costs keep buyer leverage high. Value-add analytics improve retention but do not remove switching incentives for price-sensitive accounts.
Sustainability reporting demands
Buyers increasingly demand diversion reporting, ESG metrics and compliance docs; as of 2024 over 50,000 firms fall under EU CSRD and ~93% of S&P 500 publish sustainability reports. If Rubicon’s insights materially advance ESG targets, buyer power diminishes; without unique reporting, customers can commoditize bids. Verified data and third-party audits serve as clear differentiation levers.
- ESG-enabled insights reduce buyer leverage
- CSRD: ~50,000 firms require reporting
- Verified audits = pricing premium
Procurement sophistication
Corporate procurement at Rubicon-level clients applies category strategies, reverse auctions and KPI-tied sourcing, increasing buyer leverage and pricing discipline; Deloitte 2024 CPO Survey reports 71% use category strategies and 42% use reverse-auction mechanisms.
Multi-year, performance-tied contracts align incentives and cut churn; procurement-led deals delivered median cost savings of about 8% and diversion lift near 10% in 2024, essential to defend margin.
- Category strategies: 71% (Deloitte 2024)
- Reverse auctions: 42% (Deloitte 2024)
- Median cost savings: ~8% (2024 reported outcomes)
- Diversion lift: ~10% (2024 reported outcomes)
Enterprise RFPs and ESG audits force suppliers to prove ROI or lose national contracts
Large enterprise buyers (e.g., Walmart FY2024 net sales $611.3B) aggregate volume, run RFPs and force national pricing, squeezing rates and SLAs. Data/benchmarking (Rubicon) and ESG reporting (CSRD ~50,000 firms; ~93% S&P 500 report) increase switching threats unless suppliers prove ROI via verified audits. Category strategies (71%) and reverse auctions (42%) keep take rates compressed; performance contracts yield ~8% cost savings and ~10% diversion lift.
| Metric | 2024 |
|---|---|
| Walmart net sales | $611.3B |
| CSRD scope | ~50,000 firms |
| S&P 500 sustainability reports | ~93% |
| Category strategies | 71% (Deloitte) |
| Reverse auctions | 42% (Deloitte) |
| Median cost savings | ~8% |
| Diversion lift | ~10% |
Full Version Awaits
Rubicon Porter's Five Forces Analysis
This preview is the exact Rubicon Porter’s Five Forces analysis you’ll receive—complete, professionally formatted, and ready for use. It contains the full competitive assessment, supporting rationale, and actionable insights with no placeholders or samples. Purchase grants immediate access to this identical file for download.
Original: $10.00
-65%$10.00
$3.50Description
Don't Miss the Bigger Picture
Rubicon’s Porter's Five Forces snapshot highlights supplier concentration, buyer leverage, competitive rivalry, barriers to entry, and substitute risks shaping its strategy and margins. It identifies where pricing power and vulnerabilities lie to inform tactical moves. This brief only scratches the surface — unlock the full Porter's Five Forces Analysis for force-by-force ratings, visuals, and actionable recommendations.
Suppliers Bargaining Power
Fragmented hauler network
Independent haulers number an estimated 20,000+ in the US (2024), creating a fragmented supply base that limits any single supplier’s leverage. Rubicon can multi-home haulers and rebalance volumes across hundreds of providers, enabling competitive bidding for routes and services. Localized scarcity, however, can raise supplier power in specific metros where few operators dominate.
Local capacity constraints
In dense urban and remote rural areas, hauling and MRF capacity is frequently tight, and when disposal sites or transfer stations are limited suppliers gain pricing leverage, raising local take rates; industry reports noted seasonal tonnage surges of roughly 20–30% during peak periods in 2024. Regulatory restrictions on routing and hours-of-operation in 2024 further constrained capacity and reduced Rubicon’s negotiating room locally. These dynamics compress margins where local supplier concentration is high and transfer/disposal access is scarce.
Specialized recycling capabilities
Specialty recyclers for hazardous, e-waste and organics are relatively few and technically sophisticated, and their scarcity raises supplier bargaining power. Global e-waste reached 59.3 million tonnes in 2021 (UNU), underscoring growing demand for certified handlers and tighter compliance. Certification and quality controls reduce substitutability, so Rubicon must balance offering niche streams against higher per-ton processing costs.
Input cost volatility pass-through
Fuel, labor, landfill tip fees and equipment costs are highly volatile and are frequently passed through to customers via surcharges or index-linked adjustments; diesel-linked fuel surcharges tied to the DOE weekly diesel price are common. Rubicon’s contract clauses and real-time data transparency can dampen but not eliminate pass-throughs, while shorter contract terms and benchmarking reduce exposure to prolonged spikes.
- Fuel: DOE diesel index-linked surcharges
- Labor: wage pressure reflected in short-term escalators
- Tip fees: ~55 USD/ton in many US regions (2024)
- Mitigants: shorter terms, benchmarking, data transparency
Platform dependence incentives
As haulers gain steady volume and route density via the platform, dependence increases and platform features like integrated dispatch, payment, and reputation systems raise switching frictions; comparable platforms saw ~30% higher route density and 20–35% lower churn in 2024 case studies. Over time this reduces supplier bargaining power as incentives and performance scores align carrier and platform interests. Incentive programs tie pay to metrics, reinforcing lock-in.
- Platform dependence: higher route density (~30% 2024)
- Switching friction: integrated dispatch/payment/reputation
- Supplier power: reduced over time via alignment
- Incentives: performance scores + pay links lower churn (20–35% 2024)
Fragmented haulers; platform boosts routes and cuts churn 30% / 20–35%
Supplier base is fragmented (20,000+ independent haulers in US, 2024), limiting single-supplier leverage but creating local concentration risks. Local capacity tightness and limited transfer/disposal sites raise bargaining power (seasonal tonnage surges 20–30%, 2024); tip fees ~55 USD/ton. Platform features increase route density (~30%) and cut churn (20–35%), reducing supplier power over time.
| Metric | 2024 value |
|---|---|
| Independent haulers | 20,000+ |
| Seasonal surge | 20–30% |
| Tip fees (many US regions) | ~55 USD/ton |
| Route density lift | ~30% |
| Churn reduction | 20–35% |
What is included in the product
Detailed Word Document
Tailored Five Forces analysis for Rubicon that uncovers competitive drivers, supplier and buyer power, entry barriers, substitute threats, and disruptive forces to inform pricing, strategy, and investor materials.
Customizable Excel Spreadsheet
A one-sheet Rubicon Porter's Five Forces summary that quantifies competitive pressure and highlights priority threats for rapid strategic decisions. Editable scores and radar visualization make it easy to test scenarios, export to slides, and onboard non-finance stakeholders.
Customers Bargaining Power
Enterprise multi-site buyers
Enterprise multi-site buyers — exemplified by Walmart (FY2024 net sales $611.3B) — aggregate massive volumes, run competitive RFPs and insist on national pricing and SLAs across hundreds of sites.
Their scale yields strong bargaining power over rates, data access and feature sets, often dictating contract terms and KPIs.
Winning these accounts requires analytics-driven cost savings and verifiable sustainability outcomes (e.g., scope 3 reductions) to meet procurement and ESG demands.
Price transparency and benchmarking
Rubicon’s data increases buyer visibility into local market prices, allowing procurement teams to benchmark supplier fees and identify outliers. Benchmarking fuels tougher negotiations and credible threats of provider switching, while buyers unbundle service levels and demand outcome-based fees. This dynamic keeps take rates compressed, especially where vendors cannot demonstrate clear ROI, pressuring margins and contract terms.
Low switching costs for basic hauling
For standard waste streams customers often sign 12-month contracts with opt-outs tied to service quality; alternatives include direct hauler deals or rival platforms. Switching remains feasible when data migration and site onboarding are straightforward (often days), and low transactional costs keep buyer leverage high. Value-add analytics improve retention but do not remove switching incentives for price-sensitive accounts.
Sustainability reporting demands
Buyers increasingly demand diversion reporting, ESG metrics and compliance docs; as of 2024 over 50,000 firms fall under EU CSRD and ~93% of S&P 500 publish sustainability reports. If Rubicon’s insights materially advance ESG targets, buyer power diminishes; without unique reporting, customers can commoditize bids. Verified data and third-party audits serve as clear differentiation levers.
- ESG-enabled insights reduce buyer leverage
- CSRD: ~50,000 firms require reporting
- Verified audits = pricing premium
Procurement sophistication
Corporate procurement at Rubicon-level clients applies category strategies, reverse auctions and KPI-tied sourcing, increasing buyer leverage and pricing discipline; Deloitte 2024 CPO Survey reports 71% use category strategies and 42% use reverse-auction mechanisms.
Multi-year, performance-tied contracts align incentives and cut churn; procurement-led deals delivered median cost savings of about 8% and diversion lift near 10% in 2024, essential to defend margin.
- Category strategies: 71% (Deloitte 2024)
- Reverse auctions: 42% (Deloitte 2024)
- Median cost savings: ~8% (2024 reported outcomes)
- Diversion lift: ~10% (2024 reported outcomes)
Enterprise RFPs and ESG audits force suppliers to prove ROI or lose national contracts
Large enterprise buyers (e.g., Walmart FY2024 net sales $611.3B) aggregate volume, run RFPs and force national pricing, squeezing rates and SLAs. Data/benchmarking (Rubicon) and ESG reporting (CSRD ~50,000 firms; ~93% S&P 500 report) increase switching threats unless suppliers prove ROI via verified audits. Category strategies (71%) and reverse auctions (42%) keep take rates compressed; performance contracts yield ~8% cost savings and ~10% diversion lift.
| Metric | 2024 |
|---|---|
| Walmart net sales | $611.3B |
| CSRD scope | ~50,000 firms |
| S&P 500 sustainability reports | ~93% |
| Category strategies | 71% (Deloitte) |
| Reverse auctions | 42% (Deloitte) |
| Median cost savings | ~8% |
| Diversion lift | ~10% |
Full Version Awaits
Rubicon Porter's Five Forces Analysis
This preview is the exact Rubicon Porter’s Five Forces analysis you’ll receive—complete, professionally formatted, and ready for use. It contains the full competitive assessment, supporting rationale, and actionable insights with no placeholders or samples. Purchase grants immediate access to this identical file for download.











