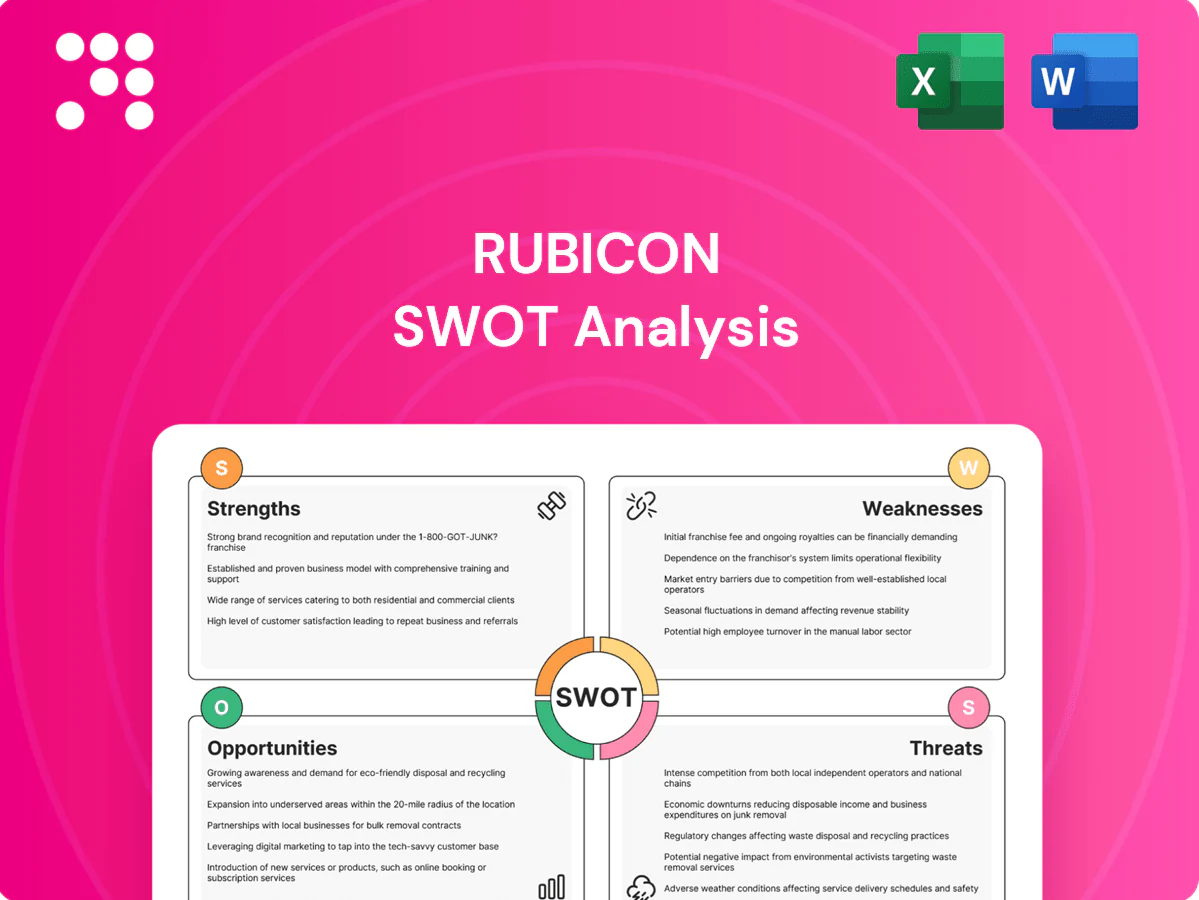
Rubicon SWOT Analysis

Your Strategic Toolkit Starts Here
Rubicon’s SWOT highlights scalable technology and strong enterprise relationships as key strengths, against margin pressure and regulatory complexity as notable weaknesses; opportunistic expansion into circular solutions contrasts with competitive and macro risks. Want the full picture with strategic recommendations and editable models? Purchase the complete SWOT report—Word + Excel—for investor-ready insights and action plans.
Strengths

Asset-light marketplace model
By aggregating independent haulers, Rubicon scales without owning trucks or landfills, materially lowering capital intensity and enabling faster, lower-cost market entry. The asset-light marketplace lets the platform rapidly match supply to demand and broaden geographic coverage with limited fixed investment. Multi-supplier bidding drives competitive pricing and margin resilience for clients and the company.
Data-driven waste insights
Rubicon’s platform captures pickup, volume, contamination and diversion data across operations, converting it into analytics that have helped clients cut waste and raise recycling rates by double-digit percentages. Actionable dashboards translate sustainability goals into measurable KPIs (diversion, contamination rate, route efficiency). Better data increases customer stickiness and upsell potential across Rubicon’s base of over 15,000 clients.

Sustainability value proposition
Rubicon's sustainability value prop aligns with landfill diversion and circular-economy priorities, helping enterprises quantify diversion for ESG reporting. With EU CSRD expanding to roughly 50,000 companies in 2024, clients increasingly seek tech-enabled waste data. That strategic fit supports enterprise sales and longer-term contracts. It differentiates Rubicon from traditional hauling-centric providers.

Broad hauler and recycler network
Rubicon’s broad hauler and recycler network leverages a fragmented base of independent partners to extend geographic reach and deliver flexible, localized service; multi-vendor sourcing reduces single-supplier risk and improves reliability while local partners provide specialized recycling capabilities that support higher diversion rates. Network effects can strengthen pricing power as partner density grows.
- Geographic reach via independent haulers
- Multi-vendor reliability
- Local specialized recycling
- Growing network => pricing leverage
Scalable software and integrations
Rubicon’s scalable APIs, mobile apps, and portal tools streamline workflows for clients and haulers, standardizing processes to cut manual coordination and errors and enabling feature rollouts via software updates without heavy field ops; Rubicon reported about $334 million in 2023 revenue, reflecting platform-driven growth and enterprise traction. Integration-ready tech supports procurement and sustainability reporting systems for large customers.
- APIs: real-time integration with ERP and procurement
- Mobile apps: driver efficiency and route compliance
- Portal tools: centralized client operations
- Updates: rapid feature deployment, lower field costs
Asset-light hauler platform: $334M, 15,000+ clients, EU CSRD reach
Rubicon scales via asset-light hauler aggregation, lowering capital intensity and enabling rapid market expansion; platform matched pricing and services across 15,000+ clients. Its data/analytics improved diversion and ESG reporting, supporting $334M 2023 revenue and enterprise contract growth amid EU CSRD coverage (~50,000 firms in 2024).
| Metric | Value |
|---|---|
| Revenue 2023 | $334M |
| Clients | 15,000+ |
| EU CSRD 2024 | ~50,000 firms |
What is included in the product
 Detailed Word Document
Provides a clear SWOT framework that highlights Rubicon’s internal capabilities and operational gaps, outlines market-facing opportunities and threats, and examines strategic factors shaping the company’s competitive position and growth prospects.

 Customizable Excel Spreadsheet
Provides a focused SWOT matrix tailored to Rubicon, enabling fast alignment of strategy and clear stakeholder communication; editable format lets teams update priorities quickly as market conditions change.
Weaknesses

Two-sided network dependence
Rubicon’s marketplace health hinges on balancing hauler supply with customer demand, so early or thin market coverage can create service gaps and price volatility. Onboarding and retaining quality haulers requires tailored incentives, training, and platform support to maintain service standards. High network churn degrades customer experience and raises acquisition costs, making two-sided stability critical for unit economics.
Limited control over service quality
Rubicon relies on third-party haulers for last-mile execution, creating variability in timeliness, contamination handling and reporting that can erode service consistency. With US municipal solid waste at 292.4 million tons in 2022 (EPA), lapses in contamination control are costly. Rubicon must strengthen SLAs, audits and feedback loops to reduce disputes; missed commitments risk damaging brand perception and customer retention.

Integration and data complexity
Client sites, waste streams, and ERP systems vary widely, forcing Rubicon to handle fragmented integrations across municipal, commercial, and industrial customers. Connecting sensors, scales, and reporting instruments adds technical overhead and bespoke engineering for each rollout. Ongoing data normalization and accuracy checks are continual challenges that can prolong implementation and lengthen sales-to-value timelines.

Margin pressure typical to logistics
Hauling services remain price-competitive and commodity-like, with logistics industry operating margins often in the 3–6% range (ATA 2023–24), forcing Rubicon to balance low fees with partner economics. Intermediation fees must preserve customer savings while protecting carrier margins; spikes in labor, diesel or disposal costs (which can vary 10–20% year-over-year) compress take rates. Differentiation hinges on demonstrable analytics value to justify premium pricing.
- Low gross margins — industry 3–6%
- Fee balancing — customer vs carrier economics
- Cost volatility — labor/fuel/disposal ±10–20%
- Analytics-dependent differentiation
Exposure to recycling market volatility
Rubicon is exposed to recycling-market volatility: recyclable commodity prices and contamination rates (commonly 15–25% in single-stream programs) directly affect claimed savings and diversion metrics, while contract terms often do not fully hedge commodity swings, complicating forecasting and ROI narratives.
- Recyclables price swings: high variability
- Contamination 15–25%: reduces recoverable value
- Contract gaps: limited commodity hedging
- Regional/material mix: uneven performance
Waste market: margins 3–6%, contamination 15–25%
Rubicon faces low gross margins (3–6% industry) and thin marketplace density that drives churn and acquisition costs. Reliance on third-party haulers creates variability in timeliness and contamination control; US MSW was 292.4M tons in 2022 (EPA) and single-stream contamination often runs 15–25%. Fuel, labor and disposal volatility ±10–20% compresses take rates and complicates forecasting.
| Metric | Value |
|---|---|
| Industry margins (ATA) | 3–6% |
| US MSW (EPA 2022) | 292.4M tons |
| Contamination | 15–25% |
| Cost volatility | ±10–20% |
Full Version Awaits
Rubicon SWOT Analysis
This is the actual Rubicon SWOT analysis document you’ll receive upon purchase—no surprises, just professional quality. The preview below is taken directly from the full report you'll get; purchase unlocks the complete, editable version. You’re viewing a live excerpt of the real file, ready to download after checkout.

Your Strategic Toolkit Starts Here
Rubicon’s SWOT highlights scalable technology and strong enterprise relationships as key strengths, against margin pressure and regulatory complexity as notable weaknesses; opportunistic expansion into circular solutions contrasts with competitive and macro risks. Want the full picture with strategic recommendations and editable models? Purchase the complete SWOT report—Word + Excel—for investor-ready insights and action plans.
Strengths
Asset-light marketplace model
By aggregating independent haulers, Rubicon scales without owning trucks or landfills, materially lowering capital intensity and enabling faster, lower-cost market entry. The asset-light marketplace lets the platform rapidly match supply to demand and broaden geographic coverage with limited fixed investment. Multi-supplier bidding drives competitive pricing and margin resilience for clients and the company.
Data-driven waste insights
Rubicon’s platform captures pickup, volume, contamination and diversion data across operations, converting it into analytics that have helped clients cut waste and raise recycling rates by double-digit percentages. Actionable dashboards translate sustainability goals into measurable KPIs (diversion, contamination rate, route efficiency). Better data increases customer stickiness and upsell potential across Rubicon’s base of over 15,000 clients.
Sustainability value proposition
Rubicon's sustainability value prop aligns with landfill diversion and circular-economy priorities, helping enterprises quantify diversion for ESG reporting. With EU CSRD expanding to roughly 50,000 companies in 2024, clients increasingly seek tech-enabled waste data. That strategic fit supports enterprise sales and longer-term contracts. It differentiates Rubicon from traditional hauling-centric providers.
Broad hauler and recycler network
Rubicon’s broad hauler and recycler network leverages a fragmented base of independent partners to extend geographic reach and deliver flexible, localized service; multi-vendor sourcing reduces single-supplier risk and improves reliability while local partners provide specialized recycling capabilities that support higher diversion rates. Network effects can strengthen pricing power as partner density grows.
- Geographic reach via independent haulers
- Multi-vendor reliability
- Local specialized recycling
- Growing network => pricing leverage
Scalable software and integrations
Rubicon’s scalable APIs, mobile apps, and portal tools streamline workflows for clients and haulers, standardizing processes to cut manual coordination and errors and enabling feature rollouts via software updates without heavy field ops; Rubicon reported about $334 million in 2023 revenue, reflecting platform-driven growth and enterprise traction. Integration-ready tech supports procurement and sustainability reporting systems for large customers.
- APIs: real-time integration with ERP and procurement
- Mobile apps: driver efficiency and route compliance
- Portal tools: centralized client operations
- Updates: rapid feature deployment, lower field costs
Asset-light hauler platform: $334M, 15,000+ clients, EU CSRD reach
Rubicon scales via asset-light hauler aggregation, lowering capital intensity and enabling rapid market expansion; platform matched pricing and services across 15,000+ clients. Its data/analytics improved diversion and ESG reporting, supporting $334M 2023 revenue and enterprise contract growth amid EU CSRD coverage (~50,000 firms in 2024).
| Metric | Value |
|---|---|
| Revenue 2023 | $334M |
| Clients | 15,000+ |
| EU CSRD 2024 | ~50,000 firms |
What is included in the product
Detailed Word Document
Provides a clear SWOT framework that highlights Rubicon’s internal capabilities and operational gaps, outlines market-facing opportunities and threats, and examines strategic factors shaping the company’s competitive position and growth prospects.
Customizable Excel Spreadsheet
Provides a focused SWOT matrix tailored to Rubicon, enabling fast alignment of strategy and clear stakeholder communication; editable format lets teams update priorities quickly as market conditions change.
Weaknesses
Two-sided network dependence
Rubicon’s marketplace health hinges on balancing hauler supply with customer demand, so early or thin market coverage can create service gaps and price volatility. Onboarding and retaining quality haulers requires tailored incentives, training, and platform support to maintain service standards. High network churn degrades customer experience and raises acquisition costs, making two-sided stability critical for unit economics.
Limited control over service quality
Rubicon relies on third-party haulers for last-mile execution, creating variability in timeliness, contamination handling and reporting that can erode service consistency. With US municipal solid waste at 292.4 million tons in 2022 (EPA), lapses in contamination control are costly. Rubicon must strengthen SLAs, audits and feedback loops to reduce disputes; missed commitments risk damaging brand perception and customer retention.
Integration and data complexity
Client sites, waste streams, and ERP systems vary widely, forcing Rubicon to handle fragmented integrations across municipal, commercial, and industrial customers. Connecting sensors, scales, and reporting instruments adds technical overhead and bespoke engineering for each rollout. Ongoing data normalization and accuracy checks are continual challenges that can prolong implementation and lengthen sales-to-value timelines.
Margin pressure typical to logistics
Hauling services remain price-competitive and commodity-like, with logistics industry operating margins often in the 3–6% range (ATA 2023–24), forcing Rubicon to balance low fees with partner economics. Intermediation fees must preserve customer savings while protecting carrier margins; spikes in labor, diesel or disposal costs (which can vary 10–20% year-over-year) compress take rates. Differentiation hinges on demonstrable analytics value to justify premium pricing.
- Low gross margins — industry 3–6%
- Fee balancing — customer vs carrier economics
- Cost volatility — labor/fuel/disposal ±10–20%
- Analytics-dependent differentiation
Exposure to recycling market volatility
Rubicon is exposed to recycling-market volatility: recyclable commodity prices and contamination rates (commonly 15–25% in single-stream programs) directly affect claimed savings and diversion metrics, while contract terms often do not fully hedge commodity swings, complicating forecasting and ROI narratives.
- Recyclables price swings: high variability
- Contamination 15–25%: reduces recoverable value
- Contract gaps: limited commodity hedging
- Regional/material mix: uneven performance
Waste market: margins 3–6%, contamination 15–25%
Rubicon faces low gross margins (3–6% industry) and thin marketplace density that drives churn and acquisition costs. Reliance on third-party haulers creates variability in timeliness and contamination control; US MSW was 292.4M tons in 2022 (EPA) and single-stream contamination often runs 15–25%. Fuel, labor and disposal volatility ±10–20% compresses take rates and complicates forecasting.
| Metric | Value |
|---|---|
| Industry margins (ATA) | 3–6% |
| US MSW (EPA 2022) | 292.4M tons |
| Contamination | 15–25% |
| Cost volatility | ±10–20% |
Full Version Awaits
Rubicon SWOT Analysis
This is the actual Rubicon SWOT analysis document you’ll receive upon purchase—no surprises, just professional quality. The preview below is taken directly from the full report you'll get; purchase unlocks the complete, editable version. You’re viewing a live excerpt of the real file, ready to download after checkout.
Description
Your Strategic Toolkit Starts Here
Rubicon’s SWOT highlights scalable technology and strong enterprise relationships as key strengths, against margin pressure and regulatory complexity as notable weaknesses; opportunistic expansion into circular solutions contrasts with competitive and macro risks. Want the full picture with strategic recommendations and editable models? Purchase the complete SWOT report—Word + Excel—for investor-ready insights and action plans.
Strengths
Asset-light marketplace model
By aggregating independent haulers, Rubicon scales without owning trucks or landfills, materially lowering capital intensity and enabling faster, lower-cost market entry. The asset-light marketplace lets the platform rapidly match supply to demand and broaden geographic coverage with limited fixed investment. Multi-supplier bidding drives competitive pricing and margin resilience for clients and the company.
Data-driven waste insights
Rubicon’s platform captures pickup, volume, contamination and diversion data across operations, converting it into analytics that have helped clients cut waste and raise recycling rates by double-digit percentages. Actionable dashboards translate sustainability goals into measurable KPIs (diversion, contamination rate, route efficiency). Better data increases customer stickiness and upsell potential across Rubicon’s base of over 15,000 clients.
Sustainability value proposition
Rubicon's sustainability value prop aligns with landfill diversion and circular-economy priorities, helping enterprises quantify diversion for ESG reporting. With EU CSRD expanding to roughly 50,000 companies in 2024, clients increasingly seek tech-enabled waste data. That strategic fit supports enterprise sales and longer-term contracts. It differentiates Rubicon from traditional hauling-centric providers.
Broad hauler and recycler network
Rubicon’s broad hauler and recycler network leverages a fragmented base of independent partners to extend geographic reach and deliver flexible, localized service; multi-vendor sourcing reduces single-supplier risk and improves reliability while local partners provide specialized recycling capabilities that support higher diversion rates. Network effects can strengthen pricing power as partner density grows.
- Geographic reach via independent haulers
- Multi-vendor reliability
- Local specialized recycling
- Growing network => pricing leverage
Scalable software and integrations
Rubicon’s scalable APIs, mobile apps, and portal tools streamline workflows for clients and haulers, standardizing processes to cut manual coordination and errors and enabling feature rollouts via software updates without heavy field ops; Rubicon reported about $334 million in 2023 revenue, reflecting platform-driven growth and enterprise traction. Integration-ready tech supports procurement and sustainability reporting systems for large customers.
- APIs: real-time integration with ERP and procurement
- Mobile apps: driver efficiency and route compliance
- Portal tools: centralized client operations
- Updates: rapid feature deployment, lower field costs
Asset-light hauler platform: $334M, 15,000+ clients, EU CSRD reach
Rubicon scales via asset-light hauler aggregation, lowering capital intensity and enabling rapid market expansion; platform matched pricing and services across 15,000+ clients. Its data/analytics improved diversion and ESG reporting, supporting $334M 2023 revenue and enterprise contract growth amid EU CSRD coverage (~50,000 firms in 2024).
| Metric | Value |
|---|---|
| Revenue 2023 | $334M |
| Clients | 15,000+ |
| EU CSRD 2024 | ~50,000 firms |
What is included in the product
Detailed Word Document
Provides a clear SWOT framework that highlights Rubicon’s internal capabilities and operational gaps, outlines market-facing opportunities and threats, and examines strategic factors shaping the company’s competitive position and growth prospects.
Customizable Excel Spreadsheet
Provides a focused SWOT matrix tailored to Rubicon, enabling fast alignment of strategy and clear stakeholder communication; editable format lets teams update priorities quickly as market conditions change.
Weaknesses
Two-sided network dependence
Rubicon’s marketplace health hinges on balancing hauler supply with customer demand, so early or thin market coverage can create service gaps and price volatility. Onboarding and retaining quality haulers requires tailored incentives, training, and platform support to maintain service standards. High network churn degrades customer experience and raises acquisition costs, making two-sided stability critical for unit economics.
Limited control over service quality
Rubicon relies on third-party haulers for last-mile execution, creating variability in timeliness, contamination handling and reporting that can erode service consistency. With US municipal solid waste at 292.4 million tons in 2022 (EPA), lapses in contamination control are costly. Rubicon must strengthen SLAs, audits and feedback loops to reduce disputes; missed commitments risk damaging brand perception and customer retention.
Integration and data complexity
Client sites, waste streams, and ERP systems vary widely, forcing Rubicon to handle fragmented integrations across municipal, commercial, and industrial customers. Connecting sensors, scales, and reporting instruments adds technical overhead and bespoke engineering for each rollout. Ongoing data normalization and accuracy checks are continual challenges that can prolong implementation and lengthen sales-to-value timelines.
Margin pressure typical to logistics
Hauling services remain price-competitive and commodity-like, with logistics industry operating margins often in the 3–6% range (ATA 2023–24), forcing Rubicon to balance low fees with partner economics. Intermediation fees must preserve customer savings while protecting carrier margins; spikes in labor, diesel or disposal costs (which can vary 10–20% year-over-year) compress take rates. Differentiation hinges on demonstrable analytics value to justify premium pricing.
- Low gross margins — industry 3–6%
- Fee balancing — customer vs carrier economics
- Cost volatility — labor/fuel/disposal ±10–20%
- Analytics-dependent differentiation
Exposure to recycling market volatility
Rubicon is exposed to recycling-market volatility: recyclable commodity prices and contamination rates (commonly 15–25% in single-stream programs) directly affect claimed savings and diversion metrics, while contract terms often do not fully hedge commodity swings, complicating forecasting and ROI narratives.
- Recyclables price swings: high variability
- Contamination 15–25%: reduces recoverable value
- Contract gaps: limited commodity hedging
- Regional/material mix: uneven performance
Waste market: margins 3–6%, contamination 15–25%
Rubicon faces low gross margins (3–6% industry) and thin marketplace density that drives churn and acquisition costs. Reliance on third-party haulers creates variability in timeliness and contamination control; US MSW was 292.4M tons in 2022 (EPA) and single-stream contamination often runs 15–25%. Fuel, labor and disposal volatility ±10–20% compresses take rates and complicates forecasting.
| Metric | Value |
|---|---|
| Industry margins (ATA) | 3–6% |
| US MSW (EPA 2022) | 292.4M tons |
| Contamination | 15–25% |
| Cost volatility | ±10–20% |
Full Version Awaits
Rubicon SWOT Analysis
This is the actual Rubicon SWOT analysis document you’ll receive upon purchase—no surprises, just professional quality. The preview below is taken directly from the full report you'll get; purchase unlocks the complete, editable version. You’re viewing a live excerpt of the real file, ready to download after checkout.











