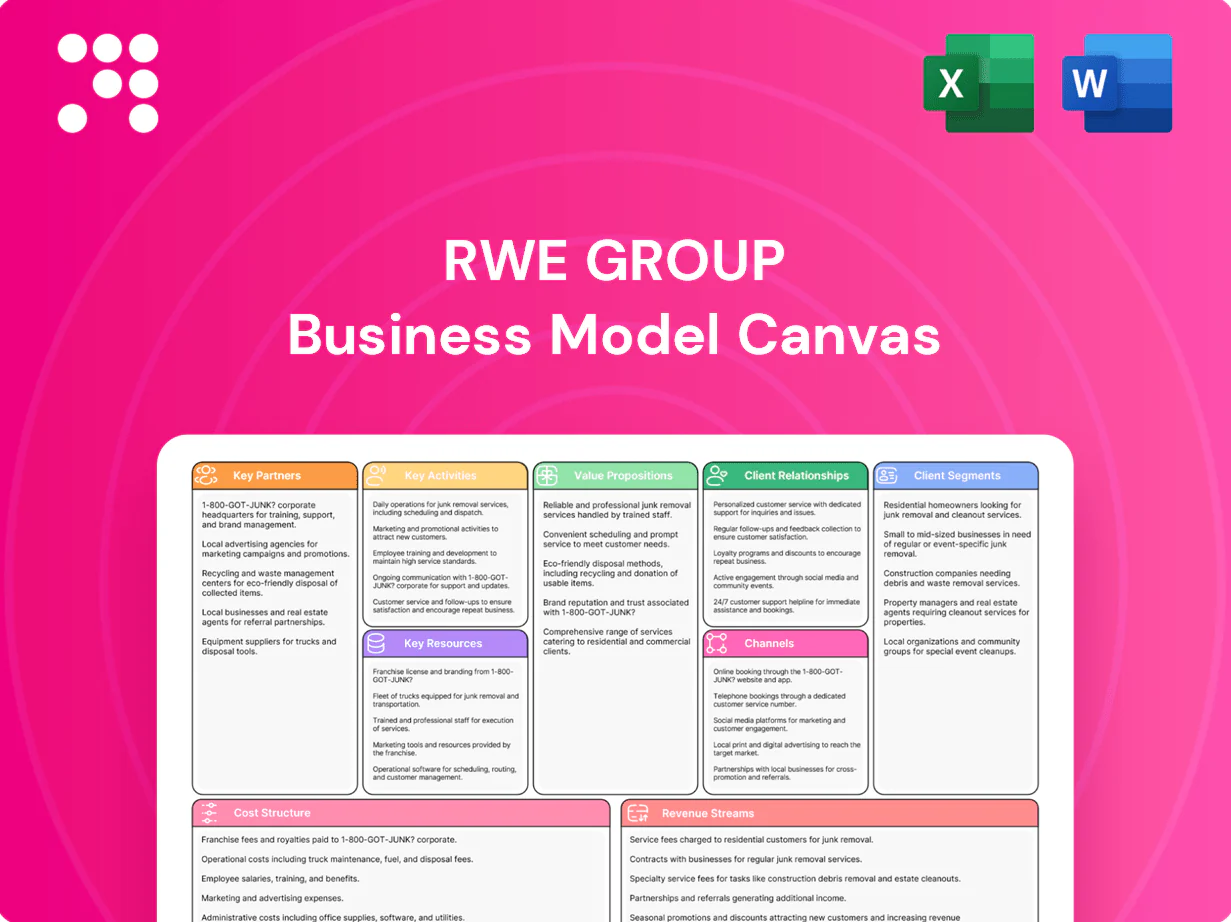
RWE Group Business Model Canvas

Business Model Canvas: Strategic blueprint for energy utilities and investors
Unlock the full strategic blueprint behind RWE Group with our Business Model Canvas—three to five sentences won't capture its depth. This concise, actionable canvas reveals value propositions, partnerships, and revenue levers that drive growth. Ideal for investors, strategists, and students—download the full Word/Excel package to benchmark and build winning strategies.
Partnerships

Turbine OEMs and EPCs
Collaborations with turbine OEMs and EPCs secure technology roadmaps, manufacturer warranties and installation capacity critical to RWEs push toward its 50 GW renewables target by 2030. These partners reduce execution risk and accelerate build schedules through contracted installation windows and joint engineering that optimizes LCOE and site-specific layouts. Preferred-supplier frameworks lock in pricing and bolster supply-chain resilience for multi-gigawatt project pipelines.
Grid Operators and Utilities
Partnerships with TSOs/DSOs such as TenneT, 50Hertz, Amprion and National Grid ensure timely interconnection and grid stability as RWE scales toward a 50 GW renewables target by 2030.

Financial Institutions and Investors
Banks, ECAs and infrastructure funds provide project finance, green bonds and tax-equity where applicable, lowering financing costs and enabling RWE’s renewables pipeline; structured financing and syndicated loans improve WACC and support growth. Risk-sharing vehicles and hedges stabilize cash flows across asset classes, while sustainability-linked instruments tie borrowing costs to decarbonization targets.

Corporate Offtakers and Aggregators
Large corporates and aggregators underpin long-term PPAs and hedged baseload blocks, providing revenue certainty; co-created contracts tailor tenor (often up to 15 years), delivery profiles and guarantees via certificates; demand-side partners enhance route-to-market and flexibility; portfolio offtake diversifies counterparty risk and geographies — RWE targets c.50 GW renewables by 2030 (2024 guidance).
- Long-term PPAs: revenue stability
- Custom tenors/profiles: up to 15 years
- Demand-side partners: flexibility & market access
- Portfolio offtake: counterparty & geographic diversification
Technology and Innovation Partners
Alliances with storage, hydrogen and digital analytics providers enable RWE to offer integrated energy services and support its 2024 target to reach 50 GW renewable capacity by 2030. Pilot programs scale and de-risk emerging technologies, shortening commercial deployment timelines. Data platforms enhance forecasting and asset optimisation, cutting balancing costs. OEMs and research institutions accelerate repowering and efficiency gains.
- Storage partners: enable grid services and firming
- Hydrogen providers: unlock low‑carbon fuels and markets
- Digital analytics: improve forecasting, reduce O&M costs
- OEMs & research: speed repowering, raise asset output
Alliances with OEMs, EPCs and TSOs secure tech, grid and finance for 50 GW renewables by 2030
Strategic alliances with turbine OEMs, EPCs and TSOs secure technology, installation capacity and grid access critical to RWE’s 50 GW renewables target by 2030 (2024 guidance). Financial partners provide project finance, green bonds and hedging to stabilise cash flows and lower WACC. Corporate offtakers and storage/hydrogen providers underwrite long-term revenues and integrated services.
| Partner type | Role | 2024 metric |
|---|---|---|
| OEMs/EPCs/TSOs | Tech, build, grid | Supports 50 GW by 2030 (2024 guidance) |
What is included in the product
 Detailed Word Document
A comprehensive, pre-written Business Model Canvas for RWE Group that maps customer segments, channels, value propositions and revenue streams across the 9 BMC blocks, reflecting real-world operations, competitive advantages, SWOT-linked insights and a polished format ideal for presentations, funding discussions and strategic decision-making.

 Customizable Excel Spreadsheet
High-level view of RWE Group’s business model with editable cells, condensing power generation, renewables, trading and customer segments into one page to quickly identify strategic priorities and risks. Great for boardrooms or teams needing a fast, shareable snapshot to streamline planning and stakeholder alignment.
Activities

Renewable Project Development
Sourcing sites, securing permits and grid connection rights build a robust multi-GW pipeline that supports RWE’s stated target of 50 GW renewable capacity by 2030. Community engagement and environmental studies reduce permitting delays and social risk. Auction participation and long-term land leases lock in project viability, while structured offtake agreements underpin bankable cashflows for project financing.
Construction and Commissioning
EPC oversight enforces quality, safety and schedule adherence across projects, with modern offshore turbines reaching 12–15 MW in 2024 dictating installation complexity. Supply‑chain coordination manages turbines, foundations and balance‑of‑plant amid 18–24 month lead times. Testing and energization ensure compliance with grid codes, while ramp‑up plans target early generation optimization and controlled warranty claims.

Operations, O&M, and Repowering
Asset management at RWE maximizes availability and yield across its ~30 GW renewables fleet (2024) through centralized monitoring and commercial optimisation. Predictive maintenance using IoT and analytics cuts unplanned downtime and O&M costs, with digital programs targeting double-digit percentage reductions. Strategic repowering projects extend asset life and boost output per site, while performance benchmarking against peers drives continuous efficiency gains.

Energy Trading and Risk Management
Energy trading at RWE blends short- and long-term trading to optimize capture prices across markets while hedging portfolios to manage weather, price and imbalance risks; RWE reaffirmed in 2024 a renewables target of 50 GW by 2030 to underpin hedged volumes.
Intraday dispatch and balancing reduce imbalance penalties and volatility exposure, while PPA origination and structuring enhance revenue certainty for merchant assets.
- Short-/long-term trading: price capture
- Hedging: weather, price, imbalance
- Intraday: minimize penalties
- PPA structuring: revenue certainty
Innovation in Storage and Hydrogen
RWE scales co‑located batteries to capture price arbitrage and provide ancillary services while Power‑to‑X pilots in 2024 convert surplus renewables into hydrogen for industrial off‑takers; digital twins sharpen forecasting and grid integration, and new commercial products monetize flexibility and certificates across markets.
- co‑located batteries: arbitrage & ancillary services
- Power‑to‑X pilots 2024: surplus → hydrogen
- digital twins: better forecasting/grid integration
- new products: flexibility & certificate monetization
Pipeline aims for 50 GW by 2030 via grid rights, EPC and digital O&M
Sourcing, permitting and grid rights build RWE’s multi‑GW pipeline to reach 50 GW renewables by 2030 (target) from ~30 GW operational in 2024.
EPC oversight manages 12–15 MW offshore turbines with 18–24 month supply lead times and controlled energization.
Asset management uses IoT predictive maintenance to boost availability and drive double‑digit O&M savings across ~30 GW (2024).
Trading, PPAs and batteries monetize output, with Power‑to‑X pilots in 2024 converting surplus into hydrogen.
| Metric | 2024 | Target/Note |
|---|---|---|
| Operational renewables | ~30 GW | 2024 |
| 2030 target | 50 GW | RWE target |
| Offshore turbine size | 12–15 MW | 2024 tech |
| Supply lead time | 18–24 months | turbines & BOP |
Full Version Awaits
Business Model Canvas
The document you're previewing is the exact RWE Group Business Model Canvas you will receive after purchase; it's not a mockup or sample. Upon completing your order you'll get the full, editable file—structured and formatted identically—ready for analysis, presentation and strategic use.

Business Model Canvas: Strategic blueprint for energy utilities and investors
Unlock the full strategic blueprint behind RWE Group with our Business Model Canvas—three to five sentences won't capture its depth. This concise, actionable canvas reveals value propositions, partnerships, and revenue levers that drive growth. Ideal for investors, strategists, and students—download the full Word/Excel package to benchmark and build winning strategies.
Partnerships
Turbine OEMs and EPCs
Collaborations with turbine OEMs and EPCs secure technology roadmaps, manufacturer warranties and installation capacity critical to RWEs push toward its 50 GW renewables target by 2030. These partners reduce execution risk and accelerate build schedules through contracted installation windows and joint engineering that optimizes LCOE and site-specific layouts. Preferred-supplier frameworks lock in pricing and bolster supply-chain resilience for multi-gigawatt project pipelines.
Grid Operators and Utilities
Partnerships with TSOs/DSOs such as TenneT, 50Hertz, Amprion and National Grid ensure timely interconnection and grid stability as RWE scales toward a 50 GW renewables target by 2030.
Financial Institutions and Investors
Banks, ECAs and infrastructure funds provide project finance, green bonds and tax-equity where applicable, lowering financing costs and enabling RWE’s renewables pipeline; structured financing and syndicated loans improve WACC and support growth. Risk-sharing vehicles and hedges stabilize cash flows across asset classes, while sustainability-linked instruments tie borrowing costs to decarbonization targets.
Corporate Offtakers and Aggregators
Large corporates and aggregators underpin long-term PPAs and hedged baseload blocks, providing revenue certainty; co-created contracts tailor tenor (often up to 15 years), delivery profiles and guarantees via certificates; demand-side partners enhance route-to-market and flexibility; portfolio offtake diversifies counterparty risk and geographies — RWE targets c.50 GW renewables by 2030 (2024 guidance).
- Long-term PPAs: revenue stability
- Custom tenors/profiles: up to 15 years
- Demand-side partners: flexibility & market access
- Portfolio offtake: counterparty & geographic diversification
Technology and Innovation Partners
Alliances with storage, hydrogen and digital analytics providers enable RWE to offer integrated energy services and support its 2024 target to reach 50 GW renewable capacity by 2030. Pilot programs scale and de-risk emerging technologies, shortening commercial deployment timelines. Data platforms enhance forecasting and asset optimisation, cutting balancing costs. OEMs and research institutions accelerate repowering and efficiency gains.
- Storage partners: enable grid services and firming
- Hydrogen providers: unlock low‑carbon fuels and markets
- Digital analytics: improve forecasting, reduce O&M costs
- OEMs & research: speed repowering, raise asset output
Alliances with OEMs, EPCs and TSOs secure tech, grid and finance for 50 GW renewables by 2030
Strategic alliances with turbine OEMs, EPCs and TSOs secure technology, installation capacity and grid access critical to RWE’s 50 GW renewables target by 2030 (2024 guidance). Financial partners provide project finance, green bonds and hedging to stabilise cash flows and lower WACC. Corporate offtakers and storage/hydrogen providers underwrite long-term revenues and integrated services.
| Partner type | Role | 2024 metric |
|---|---|---|
| OEMs/EPCs/TSOs | Tech, build, grid | Supports 50 GW by 2030 (2024 guidance) |
What is included in the product
Detailed Word Document
A comprehensive, pre-written Business Model Canvas for RWE Group that maps customer segments, channels, value propositions and revenue streams across the 9 BMC blocks, reflecting real-world operations, competitive advantages, SWOT-linked insights and a polished format ideal for presentations, funding discussions and strategic decision-making.
Customizable Excel Spreadsheet
High-level view of RWE Group’s business model with editable cells, condensing power generation, renewables, trading and customer segments into one page to quickly identify strategic priorities and risks. Great for boardrooms or teams needing a fast, shareable snapshot to streamline planning and stakeholder alignment.
Activities
Renewable Project Development
Sourcing sites, securing permits and grid connection rights build a robust multi-GW pipeline that supports RWE’s stated target of 50 GW renewable capacity by 2030. Community engagement and environmental studies reduce permitting delays and social risk. Auction participation and long-term land leases lock in project viability, while structured offtake agreements underpin bankable cashflows for project financing.
Construction and Commissioning
EPC oversight enforces quality, safety and schedule adherence across projects, with modern offshore turbines reaching 12–15 MW in 2024 dictating installation complexity. Supply‑chain coordination manages turbines, foundations and balance‑of‑plant amid 18–24 month lead times. Testing and energization ensure compliance with grid codes, while ramp‑up plans target early generation optimization and controlled warranty claims.
Operations, O&M, and Repowering
Asset management at RWE maximizes availability and yield across its ~30 GW renewables fleet (2024) through centralized monitoring and commercial optimisation. Predictive maintenance using IoT and analytics cuts unplanned downtime and O&M costs, with digital programs targeting double-digit percentage reductions. Strategic repowering projects extend asset life and boost output per site, while performance benchmarking against peers drives continuous efficiency gains.
Energy Trading and Risk Management
Energy trading at RWE blends short- and long-term trading to optimize capture prices across markets while hedging portfolios to manage weather, price and imbalance risks; RWE reaffirmed in 2024 a renewables target of 50 GW by 2030 to underpin hedged volumes.
Intraday dispatch and balancing reduce imbalance penalties and volatility exposure, while PPA origination and structuring enhance revenue certainty for merchant assets.
- Short-/long-term trading: price capture
- Hedging: weather, price, imbalance
- Intraday: minimize penalties
- PPA structuring: revenue certainty
Innovation in Storage and Hydrogen
RWE scales co‑located batteries to capture price arbitrage and provide ancillary services while Power‑to‑X pilots in 2024 convert surplus renewables into hydrogen for industrial off‑takers; digital twins sharpen forecasting and grid integration, and new commercial products monetize flexibility and certificates across markets.
- co‑located batteries: arbitrage & ancillary services
- Power‑to‑X pilots 2024: surplus → hydrogen
- digital twins: better forecasting/grid integration
- new products: flexibility & certificate monetization
Pipeline aims for 50 GW by 2030 via grid rights, EPC and digital O&M
Sourcing, permitting and grid rights build RWE’s multi‑GW pipeline to reach 50 GW renewables by 2030 (target) from ~30 GW operational in 2024.
EPC oversight manages 12–15 MW offshore turbines with 18–24 month supply lead times and controlled energization.
Asset management uses IoT predictive maintenance to boost availability and drive double‑digit O&M savings across ~30 GW (2024).
Trading, PPAs and batteries monetize output, with Power‑to‑X pilots in 2024 converting surplus into hydrogen.
| Metric | 2024 | Target/Note |
|---|---|---|
| Operational renewables | ~30 GW | 2024 |
| 2030 target | 50 GW | RWE target |
| Offshore turbine size | 12–15 MW | 2024 tech |
| Supply lead time | 18–24 months | turbines & BOP |
Full Version Awaits
Business Model Canvas
The document you're previewing is the exact RWE Group Business Model Canvas you will receive after purchase; it's not a mockup or sample. Upon completing your order you'll get the full, editable file—structured and formatted identically—ready for analysis, presentation and strategic use.
Description
Business Model Canvas: Strategic blueprint for energy utilities and investors
Unlock the full strategic blueprint behind RWE Group with our Business Model Canvas—three to five sentences won't capture its depth. This concise, actionable canvas reveals value propositions, partnerships, and revenue levers that drive growth. Ideal for investors, strategists, and students—download the full Word/Excel package to benchmark and build winning strategies.
Partnerships
Turbine OEMs and EPCs
Collaborations with turbine OEMs and EPCs secure technology roadmaps, manufacturer warranties and installation capacity critical to RWEs push toward its 50 GW renewables target by 2030. These partners reduce execution risk and accelerate build schedules through contracted installation windows and joint engineering that optimizes LCOE and site-specific layouts. Preferred-supplier frameworks lock in pricing and bolster supply-chain resilience for multi-gigawatt project pipelines.
Grid Operators and Utilities
Partnerships with TSOs/DSOs such as TenneT, 50Hertz, Amprion and National Grid ensure timely interconnection and grid stability as RWE scales toward a 50 GW renewables target by 2030.
Financial Institutions and Investors
Banks, ECAs and infrastructure funds provide project finance, green bonds and tax-equity where applicable, lowering financing costs and enabling RWE’s renewables pipeline; structured financing and syndicated loans improve WACC and support growth. Risk-sharing vehicles and hedges stabilize cash flows across asset classes, while sustainability-linked instruments tie borrowing costs to decarbonization targets.
Corporate Offtakers and Aggregators
Large corporates and aggregators underpin long-term PPAs and hedged baseload blocks, providing revenue certainty; co-created contracts tailor tenor (often up to 15 years), delivery profiles and guarantees via certificates; demand-side partners enhance route-to-market and flexibility; portfolio offtake diversifies counterparty risk and geographies — RWE targets c.50 GW renewables by 2030 (2024 guidance).
- Long-term PPAs: revenue stability
- Custom tenors/profiles: up to 15 years
- Demand-side partners: flexibility & market access
- Portfolio offtake: counterparty & geographic diversification
Technology and Innovation Partners
Alliances with storage, hydrogen and digital analytics providers enable RWE to offer integrated energy services and support its 2024 target to reach 50 GW renewable capacity by 2030. Pilot programs scale and de-risk emerging technologies, shortening commercial deployment timelines. Data platforms enhance forecasting and asset optimisation, cutting balancing costs. OEMs and research institutions accelerate repowering and efficiency gains.
- Storage partners: enable grid services and firming
- Hydrogen providers: unlock low‑carbon fuels and markets
- Digital analytics: improve forecasting, reduce O&M costs
- OEMs & research: speed repowering, raise asset output
Alliances with OEMs, EPCs and TSOs secure tech, grid and finance for 50 GW renewables by 2030
Strategic alliances with turbine OEMs, EPCs and TSOs secure technology, installation capacity and grid access critical to RWE’s 50 GW renewables target by 2030 (2024 guidance). Financial partners provide project finance, green bonds and hedging to stabilise cash flows and lower WACC. Corporate offtakers and storage/hydrogen providers underwrite long-term revenues and integrated services.
| Partner type | Role | 2024 metric |
|---|---|---|
| OEMs/EPCs/TSOs | Tech, build, grid | Supports 50 GW by 2030 (2024 guidance) |
What is included in the product
Detailed Word Document
A comprehensive, pre-written Business Model Canvas for RWE Group that maps customer segments, channels, value propositions and revenue streams across the 9 BMC blocks, reflecting real-world operations, competitive advantages, SWOT-linked insights and a polished format ideal for presentations, funding discussions and strategic decision-making.
Customizable Excel Spreadsheet
High-level view of RWE Group’s business model with editable cells, condensing power generation, renewables, trading and customer segments into one page to quickly identify strategic priorities and risks. Great for boardrooms or teams needing a fast, shareable snapshot to streamline planning and stakeholder alignment.
Activities
Renewable Project Development
Sourcing sites, securing permits and grid connection rights build a robust multi-GW pipeline that supports RWE’s stated target of 50 GW renewable capacity by 2030. Community engagement and environmental studies reduce permitting delays and social risk. Auction participation and long-term land leases lock in project viability, while structured offtake agreements underpin bankable cashflows for project financing.
Construction and Commissioning
EPC oversight enforces quality, safety and schedule adherence across projects, with modern offshore turbines reaching 12–15 MW in 2024 dictating installation complexity. Supply‑chain coordination manages turbines, foundations and balance‑of‑plant amid 18–24 month lead times. Testing and energization ensure compliance with grid codes, while ramp‑up plans target early generation optimization and controlled warranty claims.
Operations, O&M, and Repowering
Asset management at RWE maximizes availability and yield across its ~30 GW renewables fleet (2024) through centralized monitoring and commercial optimisation. Predictive maintenance using IoT and analytics cuts unplanned downtime and O&M costs, with digital programs targeting double-digit percentage reductions. Strategic repowering projects extend asset life and boost output per site, while performance benchmarking against peers drives continuous efficiency gains.
Energy Trading and Risk Management
Energy trading at RWE blends short- and long-term trading to optimize capture prices across markets while hedging portfolios to manage weather, price and imbalance risks; RWE reaffirmed in 2024 a renewables target of 50 GW by 2030 to underpin hedged volumes.
Intraday dispatch and balancing reduce imbalance penalties and volatility exposure, while PPA origination and structuring enhance revenue certainty for merchant assets.
- Short-/long-term trading: price capture
- Hedging: weather, price, imbalance
- Intraday: minimize penalties
- PPA structuring: revenue certainty
Innovation in Storage and Hydrogen
RWE scales co‑located batteries to capture price arbitrage and provide ancillary services while Power‑to‑X pilots in 2024 convert surplus renewables into hydrogen for industrial off‑takers; digital twins sharpen forecasting and grid integration, and new commercial products monetize flexibility and certificates across markets.
- co‑located batteries: arbitrage & ancillary services
- Power‑to‑X pilots 2024: surplus → hydrogen
- digital twins: better forecasting/grid integration
- new products: flexibility & certificate monetization
Pipeline aims for 50 GW by 2030 via grid rights, EPC and digital O&M
Sourcing, permitting and grid rights build RWE’s multi‑GW pipeline to reach 50 GW renewables by 2030 (target) from ~30 GW operational in 2024.
EPC oversight manages 12–15 MW offshore turbines with 18–24 month supply lead times and controlled energization.
Asset management uses IoT predictive maintenance to boost availability and drive double‑digit O&M savings across ~30 GW (2024).
Trading, PPAs and batteries monetize output, with Power‑to‑X pilots in 2024 converting surplus into hydrogen.
| Metric | 2024 | Target/Note |
|---|---|---|
| Operational renewables | ~30 GW | 2024 |
| 2030 target | 50 GW | RWE target |
| Offshore turbine size | 12–15 MW | 2024 tech |
| Supply lead time | 18–24 months | turbines & BOP |
Full Version Awaits
Business Model Canvas
The document you're previewing is the exact RWE Group Business Model Canvas you will receive after purchase; it's not a mockup or sample. Upon completing your order you'll get the full, editable file—structured and formatted identically—ready for analysis, presentation and strategic use.











