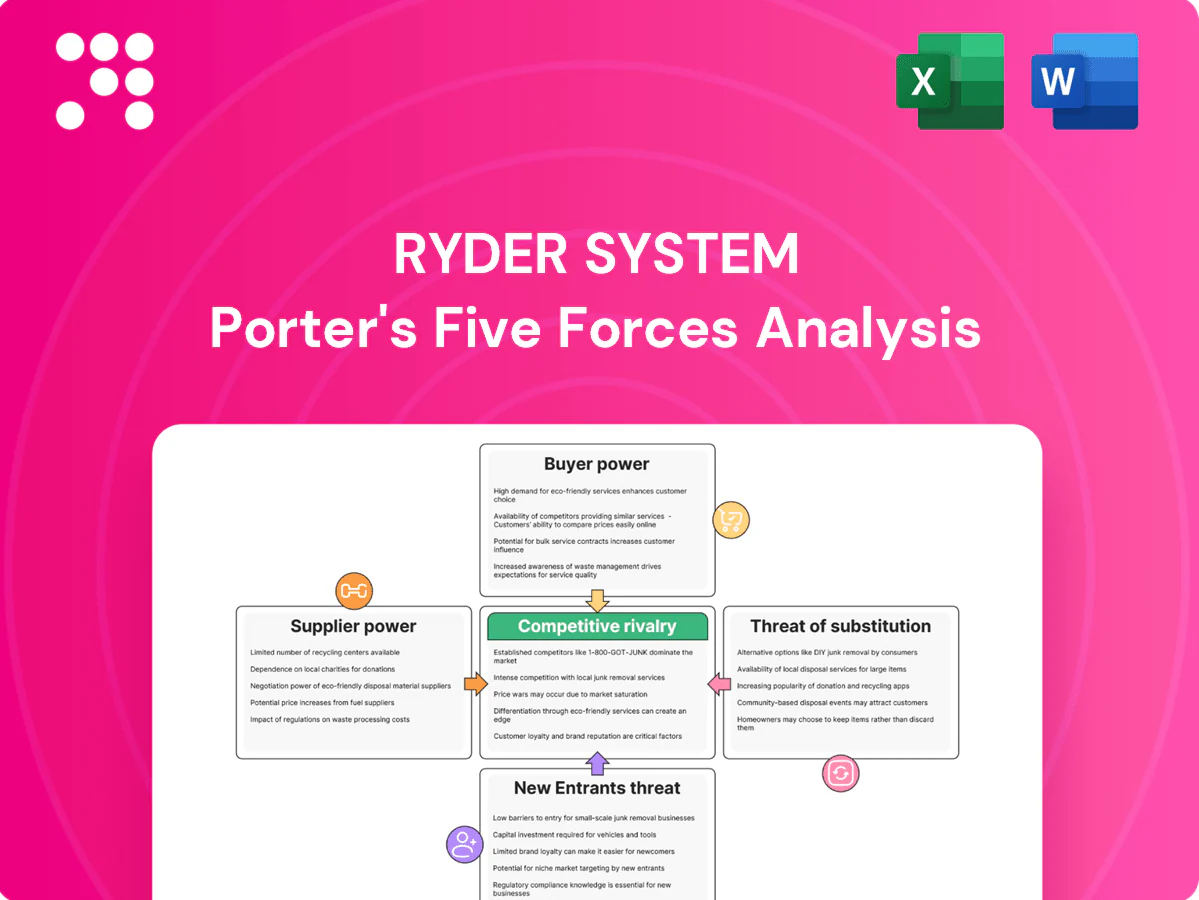
Ryder System Porter's Five Forces Analysis

Don't Miss the Bigger Picture
Ryder System faces moderate supplier power, strong buyer price sensitivity in fleet leasing, growing threat from asset-light logistics providers, and intense rivalry across transportation and last‑mile services. Regulatory and capital intensity raise barriers but also lock in incumbents. This brief snapshot only scratches the surface. Unlock the full Porter's Five Forces Analysis to explore Ryder System’s competitive dynamics, market pressures, and strategic advantages in detail.
Suppliers Bargaining Power

Concentrated OEM base
Ryder relies on a concentrated OEM base—Daimler, Paccar and Volvo among others—which collectively supply roughly 80% of U.S. Class 8 trucks, giving suppliers significant leverage. OEM production schedules and allocation can constrain Ryder’s access during tight markets, pressuring pricing and delivery terms. Ryder mitigates this risk via multi-OEM sourcing, long-term purchase agreements and a fleet exceeding 200,000 vehicles.
Fuel and parts volatility
Fluctuations in diesel (U.S. average $3.92/gal in 2024, EIA), tires and critical components give suppliers episodic pricing power, with spikes raising Ryder's operating costs quickly. Supply-chain disruptions and commodity spikes have driven short-term cost swings exceeding 5–10% in parts and fuel. Pass-through fuel surcharges mitigate impact but often lag; strategic procurement and hedging partially offset volatility.

Labor and maintenance skills
Skilled technicians and CDL drivers are scarce, elevating suppliers’ leverage; the American Trucking Associations estimated a 2024 driver shortage of about 80,000.
Wage inflation and certification requirements increase cost pressure, with BLS May 2024 showing mean hourly pay for heavy and tractor-trailer drivers at $23.58.
Unionized locations add rigidity to negotiations, and Ryder invests in training and benefits to retain talent and reduce dependence.

Telematics and software lock-in
Proprietary telematics, ELD and WMS vendors create strong software lock-in for Ryder by raising switching frictions through integration complexity and data migration risk, and by bundling features then escalating fees over time; open APIs and multi-vendor strategies materially reduce that vendor power.
- Proprietary integrations
- Data migration risk
- Bundled fees & escalation
- Open APIs mitigate lock-in
Equipment lead times and cycles
Lengthy build times and cyclical supply tighten supplier control during upcycles. ACT Research reported average North American Class 8 build times near 5 months in 2024, and EV powertrain and emissions component constraints further limit options. Expedited orders often carry premiums of roughly 10–20%, so Ryder blends new orders with used-equipment optimization to preserve flexibility.
- Build time: ~5 months (ACT Research, 2024)
- EV/emissions parts constrain sourcing
- Expedite premiums ~10–20%
- Ryder offsets risk via used-equipment optimization
Class 8 supply squeeze: OEMs ~80%, diesel $3.92/gal, 80k driver gap
Ryder faces strong supplier leverage: Daimler, Paccar and Volvo supply ~80% of U.S. Class 8 trucks, constraining availability and pricing. Key cost drivers in 2024 include diesel at $3.92/gal (EIA), a driver shortage ~80,000 (ATA) and mean driver pay $23.58/hr (BLS), while Class 8 build times ~5 months (ACT) create 10–20% expedite premiums; Ryder offsets via multi-OEM sourcing and a 200,000+ fleet.
| Metric | 2024 Value |
|---|---|
| OEM concentration | ~80% |
| Diesel (US avg) | $3.92/gal |
| Driver shortage | ~80,000 |
| Mean driver pay | $23.58/hr |
| Class 8 build time | ~5 months |
| Expedite premium | 10–20% |
What is included in the product
 Detailed Word Document
Concise Porter’s Five Forces assessment tailored to Ryder System, evaluating competitive rivalry, buyer and supplier power, threat of substitutes and new entrants, and highlighting disruptive risks and strategic defenses.

 Customizable Excel Spreadsheet
Concise five-forces snapshot for Ryder—instantly reveal carrier/customer bargaining power, asset intensity, and regulatory threats to remove strategic guesswork. Clean, slide-ready layout lets teams act fast on pricing, fleet and contract decisions without complex models.
Customers Bargaining Power

Large enterprise contracts
Large enterprise contracts give customers significant leverage over Ryder, as 2024 reported revenue of $10.8 billion reflects heavy exposure to sizable shippers whose procurement teams concentrate volumes and demand aggressive pricing and service levels. RFP-driven buying cycles in 2024 intensified concessioning pressure across core logistics bids. Ryder offsets this by offering differentiated SLAs and value-added services to protect margins and retain strategic accounts.
Price transparency in leasing
Price transparency in leasing lets customers benchmark Ryder's rental rates and TCO against competitors, comparing residual assumptions and maintenance inclusions, increasing price sensitivity. Industry comparisons and online tools mean buyers shop lifecycle costs rather than headline rent; Ryder reported 2024 revenue of about 12.3 billion and highlights uptime and lifecycle savings to protect margins. Ryder markets uptime metrics and total cost reductions to justify premiums.

Multi-sourcing across 3PLs
Shippers increasingly multi-source across 3PLs, splitting lanes and warehouses to lower risk and drive competition; dual-sourcing reduces switching costs and raises buyer leverage. Performance scorecards enable rapid reallocation of volumes based on service KPIs, shortening the lag for procurement action. Ryder reported 2024 revenue of about $11.1 billion and counters churn by bundling integrated fleet, logistics and fulfillment to build stickiness.

Service-level penalties
Contracts often include uptime, on-time delivery, and accuracy penalties; in 2024 Ryder customers shifted more financial risk to providers via strict SLA clauses, empowering buyers and forcing providers to absorb variability. Tight SLAs can compress margins during disruptions, while proactive visibility and predictive maintenance are used to meet thresholds and avoid penalties.
- Uptime/on-time/accuracy penalties
- Financial risk shifted to provider
- Margins compressed in disruptions
- Visibility & predictive maintenance to meet SLAs
Vertical integration by customers
Large retailers and e-commerce players increasingly insource fleets and fulfillment—U.S. e-commerce sales reached about $1.03 trillion in 2023, raising incentives to control last‑mile and fulfillment costs. Amazon reported shipping and fulfillment costs of roughly $87.6 billion in 2023, illustrating scale that reduces dependence on third‑party providers and strengthens a credible threat to suppliers. That threat amplifies customer bargaining power; Ryder markets itself as a flexible extension to complement in‑house assets rather than a sole provider.
- Insourcing scale: U.S. e‑commerce $1.03T (2023)
- Example: Amazon shipping/fulfillment ~$87.6B (2023)
- Effect: stronger negotiating leverage for large customers
- Ryder stance: flexible extension to complement customer fleets
Concentrated RFPs and insourcing risks squeeze 3PL margins despite SLA bundling
Large shippers wield strong leverage over Ryder (2024 revenue ~$10.8B) via concentrated RFPs, price transparency and insourcing threats; Ryder defends margins with SLAs, uptime guarantees and integrated bundling.
| Metric | Value |
|---|---|
| Ryder revenue (2024) | $10.8B |
| US e‑commerce (2023) | $1.03T |
| Amazon shipping/fulfill (2023) | $87.6B |
Preview the Actual Deliverable
Ryder System Porter's Five Forces Analysis
This preview shows the exact Ryder System Porter's Five Forces Analysis you'll receive—fully formatted and ready for immediate download. It presents a concise evaluation of competitive rivalry, supplier and buyer power, threat of new entrants, and substitutes as they relate to Ryder's logistics and transportation business. No placeholders or samples—what you see is the final deliverable. Instant access upon purchase.

Don't Miss the Bigger Picture
Ryder System faces moderate supplier power, strong buyer price sensitivity in fleet leasing, growing threat from asset-light logistics providers, and intense rivalry across transportation and last‑mile services. Regulatory and capital intensity raise barriers but also lock in incumbents. This brief snapshot only scratches the surface. Unlock the full Porter's Five Forces Analysis to explore Ryder System’s competitive dynamics, market pressures, and strategic advantages in detail.
Suppliers Bargaining Power
Concentrated OEM base
Ryder relies on a concentrated OEM base—Daimler, Paccar and Volvo among others—which collectively supply roughly 80% of U.S. Class 8 trucks, giving suppliers significant leverage. OEM production schedules and allocation can constrain Ryder’s access during tight markets, pressuring pricing and delivery terms. Ryder mitigates this risk via multi-OEM sourcing, long-term purchase agreements and a fleet exceeding 200,000 vehicles.
Fuel and parts volatility
Fluctuations in diesel (U.S. average $3.92/gal in 2024, EIA), tires and critical components give suppliers episodic pricing power, with spikes raising Ryder's operating costs quickly. Supply-chain disruptions and commodity spikes have driven short-term cost swings exceeding 5–10% in parts and fuel. Pass-through fuel surcharges mitigate impact but often lag; strategic procurement and hedging partially offset volatility.
Labor and maintenance skills
Skilled technicians and CDL drivers are scarce, elevating suppliers’ leverage; the American Trucking Associations estimated a 2024 driver shortage of about 80,000.
Wage inflation and certification requirements increase cost pressure, with BLS May 2024 showing mean hourly pay for heavy and tractor-trailer drivers at $23.58.
Unionized locations add rigidity to negotiations, and Ryder invests in training and benefits to retain talent and reduce dependence.
Telematics and software lock-in
Proprietary telematics, ELD and WMS vendors create strong software lock-in for Ryder by raising switching frictions through integration complexity and data migration risk, and by bundling features then escalating fees over time; open APIs and multi-vendor strategies materially reduce that vendor power.
- Proprietary integrations
- Data migration risk
- Bundled fees & escalation
- Open APIs mitigate lock-in
Equipment lead times and cycles
Lengthy build times and cyclical supply tighten supplier control during upcycles. ACT Research reported average North American Class 8 build times near 5 months in 2024, and EV powertrain and emissions component constraints further limit options. Expedited orders often carry premiums of roughly 10–20%, so Ryder blends new orders with used-equipment optimization to preserve flexibility.
- Build time: ~5 months (ACT Research, 2024)
- EV/emissions parts constrain sourcing
- Expedite premiums ~10–20%
- Ryder offsets risk via used-equipment optimization
Class 8 supply squeeze: OEMs ~80%, diesel $3.92/gal, 80k driver gap
Ryder faces strong supplier leverage: Daimler, Paccar and Volvo supply ~80% of U.S. Class 8 trucks, constraining availability and pricing. Key cost drivers in 2024 include diesel at $3.92/gal (EIA), a driver shortage ~80,000 (ATA) and mean driver pay $23.58/hr (BLS), while Class 8 build times ~5 months (ACT) create 10–20% expedite premiums; Ryder offsets via multi-OEM sourcing and a 200,000+ fleet.
| Metric | 2024 Value |
|---|---|
| OEM concentration | ~80% |
| Diesel (US avg) | $3.92/gal |
| Driver shortage | ~80,000 |
| Mean driver pay | $23.58/hr |
| Class 8 build time | ~5 months |
| Expedite premium | 10–20% |
What is included in the product
Detailed Word Document
Concise Porter’s Five Forces assessment tailored to Ryder System, evaluating competitive rivalry, buyer and supplier power, threat of substitutes and new entrants, and highlighting disruptive risks and strategic defenses.
Customizable Excel Spreadsheet
Concise five-forces snapshot for Ryder—instantly reveal carrier/customer bargaining power, asset intensity, and regulatory threats to remove strategic guesswork. Clean, slide-ready layout lets teams act fast on pricing, fleet and contract decisions without complex models.
Customers Bargaining Power
Large enterprise contracts
Large enterprise contracts give customers significant leverage over Ryder, as 2024 reported revenue of $10.8 billion reflects heavy exposure to sizable shippers whose procurement teams concentrate volumes and demand aggressive pricing and service levels. RFP-driven buying cycles in 2024 intensified concessioning pressure across core logistics bids. Ryder offsets this by offering differentiated SLAs and value-added services to protect margins and retain strategic accounts.
Price transparency in leasing
Price transparency in leasing lets customers benchmark Ryder's rental rates and TCO against competitors, comparing residual assumptions and maintenance inclusions, increasing price sensitivity. Industry comparisons and online tools mean buyers shop lifecycle costs rather than headline rent; Ryder reported 2024 revenue of about 12.3 billion and highlights uptime and lifecycle savings to protect margins. Ryder markets uptime metrics and total cost reductions to justify premiums.
Multi-sourcing across 3PLs
Shippers increasingly multi-source across 3PLs, splitting lanes and warehouses to lower risk and drive competition; dual-sourcing reduces switching costs and raises buyer leverage. Performance scorecards enable rapid reallocation of volumes based on service KPIs, shortening the lag for procurement action. Ryder reported 2024 revenue of about $11.1 billion and counters churn by bundling integrated fleet, logistics and fulfillment to build stickiness.
Service-level penalties
Contracts often include uptime, on-time delivery, and accuracy penalties; in 2024 Ryder customers shifted more financial risk to providers via strict SLA clauses, empowering buyers and forcing providers to absorb variability. Tight SLAs can compress margins during disruptions, while proactive visibility and predictive maintenance are used to meet thresholds and avoid penalties.
- Uptime/on-time/accuracy penalties
- Financial risk shifted to provider
- Margins compressed in disruptions
- Visibility & predictive maintenance to meet SLAs
Vertical integration by customers
Large retailers and e-commerce players increasingly insource fleets and fulfillment—U.S. e-commerce sales reached about $1.03 trillion in 2023, raising incentives to control last‑mile and fulfillment costs. Amazon reported shipping and fulfillment costs of roughly $87.6 billion in 2023, illustrating scale that reduces dependence on third‑party providers and strengthens a credible threat to suppliers. That threat amplifies customer bargaining power; Ryder markets itself as a flexible extension to complement in‑house assets rather than a sole provider.
- Insourcing scale: U.S. e‑commerce $1.03T (2023)
- Example: Amazon shipping/fulfillment ~$87.6B (2023)
- Effect: stronger negotiating leverage for large customers
- Ryder stance: flexible extension to complement customer fleets
Concentrated RFPs and insourcing risks squeeze 3PL margins despite SLA bundling
Large shippers wield strong leverage over Ryder (2024 revenue ~$10.8B) via concentrated RFPs, price transparency and insourcing threats; Ryder defends margins with SLAs, uptime guarantees and integrated bundling.
| Metric | Value |
|---|---|
| Ryder revenue (2024) | $10.8B |
| US e‑commerce (2023) | $1.03T |
| Amazon shipping/fulfill (2023) | $87.6B |
Preview the Actual Deliverable
Ryder System Porter's Five Forces Analysis
This preview shows the exact Ryder System Porter's Five Forces Analysis you'll receive—fully formatted and ready for immediate download. It presents a concise evaluation of competitive rivalry, supplier and buyer power, threat of new entrants, and substitutes as they relate to Ryder's logistics and transportation business. No placeholders or samples—what you see is the final deliverable. Instant access upon purchase.
Original: $10.00
-65%$10.00
$3.50Description
Don't Miss the Bigger Picture
Ryder System faces moderate supplier power, strong buyer price sensitivity in fleet leasing, growing threat from asset-light logistics providers, and intense rivalry across transportation and last‑mile services. Regulatory and capital intensity raise barriers but also lock in incumbents. This brief snapshot only scratches the surface. Unlock the full Porter's Five Forces Analysis to explore Ryder System’s competitive dynamics, market pressures, and strategic advantages in detail.
Suppliers Bargaining Power
Concentrated OEM base
Ryder relies on a concentrated OEM base—Daimler, Paccar and Volvo among others—which collectively supply roughly 80% of U.S. Class 8 trucks, giving suppliers significant leverage. OEM production schedules and allocation can constrain Ryder’s access during tight markets, pressuring pricing and delivery terms. Ryder mitigates this risk via multi-OEM sourcing, long-term purchase agreements and a fleet exceeding 200,000 vehicles.
Fuel and parts volatility
Fluctuations in diesel (U.S. average $3.92/gal in 2024, EIA), tires and critical components give suppliers episodic pricing power, with spikes raising Ryder's operating costs quickly. Supply-chain disruptions and commodity spikes have driven short-term cost swings exceeding 5–10% in parts and fuel. Pass-through fuel surcharges mitigate impact but often lag; strategic procurement and hedging partially offset volatility.
Labor and maintenance skills
Skilled technicians and CDL drivers are scarce, elevating suppliers’ leverage; the American Trucking Associations estimated a 2024 driver shortage of about 80,000.
Wage inflation and certification requirements increase cost pressure, with BLS May 2024 showing mean hourly pay for heavy and tractor-trailer drivers at $23.58.
Unionized locations add rigidity to negotiations, and Ryder invests in training and benefits to retain talent and reduce dependence.
Telematics and software lock-in
Proprietary telematics, ELD and WMS vendors create strong software lock-in for Ryder by raising switching frictions through integration complexity and data migration risk, and by bundling features then escalating fees over time; open APIs and multi-vendor strategies materially reduce that vendor power.
- Proprietary integrations
- Data migration risk
- Bundled fees & escalation
- Open APIs mitigate lock-in
Equipment lead times and cycles
Lengthy build times and cyclical supply tighten supplier control during upcycles. ACT Research reported average North American Class 8 build times near 5 months in 2024, and EV powertrain and emissions component constraints further limit options. Expedited orders often carry premiums of roughly 10–20%, so Ryder blends new orders with used-equipment optimization to preserve flexibility.
- Build time: ~5 months (ACT Research, 2024)
- EV/emissions parts constrain sourcing
- Expedite premiums ~10–20%
- Ryder offsets risk via used-equipment optimization
Class 8 supply squeeze: OEMs ~80%, diesel $3.92/gal, 80k driver gap
Ryder faces strong supplier leverage: Daimler, Paccar and Volvo supply ~80% of U.S. Class 8 trucks, constraining availability and pricing. Key cost drivers in 2024 include diesel at $3.92/gal (EIA), a driver shortage ~80,000 (ATA) and mean driver pay $23.58/hr (BLS), while Class 8 build times ~5 months (ACT) create 10–20% expedite premiums; Ryder offsets via multi-OEM sourcing and a 200,000+ fleet.
| Metric | 2024 Value |
|---|---|
| OEM concentration | ~80% |
| Diesel (US avg) | $3.92/gal |
| Driver shortage | ~80,000 |
| Mean driver pay | $23.58/hr |
| Class 8 build time | ~5 months |
| Expedite premium | 10–20% |
What is included in the product
Detailed Word Document
Concise Porter’s Five Forces assessment tailored to Ryder System, evaluating competitive rivalry, buyer and supplier power, threat of substitutes and new entrants, and highlighting disruptive risks and strategic defenses.
Customizable Excel Spreadsheet
Concise five-forces snapshot for Ryder—instantly reveal carrier/customer bargaining power, asset intensity, and regulatory threats to remove strategic guesswork. Clean, slide-ready layout lets teams act fast on pricing, fleet and contract decisions without complex models.
Customers Bargaining Power
Large enterprise contracts
Large enterprise contracts give customers significant leverage over Ryder, as 2024 reported revenue of $10.8 billion reflects heavy exposure to sizable shippers whose procurement teams concentrate volumes and demand aggressive pricing and service levels. RFP-driven buying cycles in 2024 intensified concessioning pressure across core logistics bids. Ryder offsets this by offering differentiated SLAs and value-added services to protect margins and retain strategic accounts.
Price transparency in leasing
Price transparency in leasing lets customers benchmark Ryder's rental rates and TCO against competitors, comparing residual assumptions and maintenance inclusions, increasing price sensitivity. Industry comparisons and online tools mean buyers shop lifecycle costs rather than headline rent; Ryder reported 2024 revenue of about 12.3 billion and highlights uptime and lifecycle savings to protect margins. Ryder markets uptime metrics and total cost reductions to justify premiums.
Multi-sourcing across 3PLs
Shippers increasingly multi-source across 3PLs, splitting lanes and warehouses to lower risk and drive competition; dual-sourcing reduces switching costs and raises buyer leverage. Performance scorecards enable rapid reallocation of volumes based on service KPIs, shortening the lag for procurement action. Ryder reported 2024 revenue of about $11.1 billion and counters churn by bundling integrated fleet, logistics and fulfillment to build stickiness.
Service-level penalties
Contracts often include uptime, on-time delivery, and accuracy penalties; in 2024 Ryder customers shifted more financial risk to providers via strict SLA clauses, empowering buyers and forcing providers to absorb variability. Tight SLAs can compress margins during disruptions, while proactive visibility and predictive maintenance are used to meet thresholds and avoid penalties.
- Uptime/on-time/accuracy penalties
- Financial risk shifted to provider
- Margins compressed in disruptions
- Visibility & predictive maintenance to meet SLAs
Vertical integration by customers
Large retailers and e-commerce players increasingly insource fleets and fulfillment—U.S. e-commerce sales reached about $1.03 trillion in 2023, raising incentives to control last‑mile and fulfillment costs. Amazon reported shipping and fulfillment costs of roughly $87.6 billion in 2023, illustrating scale that reduces dependence on third‑party providers and strengthens a credible threat to suppliers. That threat amplifies customer bargaining power; Ryder markets itself as a flexible extension to complement in‑house assets rather than a sole provider.
- Insourcing scale: U.S. e‑commerce $1.03T (2023)
- Example: Amazon shipping/fulfillment ~$87.6B (2023)
- Effect: stronger negotiating leverage for large customers
- Ryder stance: flexible extension to complement customer fleets
Concentrated RFPs and insourcing risks squeeze 3PL margins despite SLA bundling
Large shippers wield strong leverage over Ryder (2024 revenue ~$10.8B) via concentrated RFPs, price transparency and insourcing threats; Ryder defends margins with SLAs, uptime guarantees and integrated bundling.
| Metric | Value |
|---|---|
| Ryder revenue (2024) | $10.8B |
| US e‑commerce (2023) | $1.03T |
| Amazon shipping/fulfill (2023) | $87.6B |
Preview the Actual Deliverable
Ryder System Porter's Five Forces Analysis
This preview shows the exact Ryder System Porter's Five Forces Analysis you'll receive—fully formatted and ready for immediate download. It presents a concise evaluation of competitive rivalry, supplier and buyer power, threat of new entrants, and substitutes as they relate to Ryder's logistics and transportation business. No placeholders or samples—what you see is the final deliverable. Instant access upon purchase.











