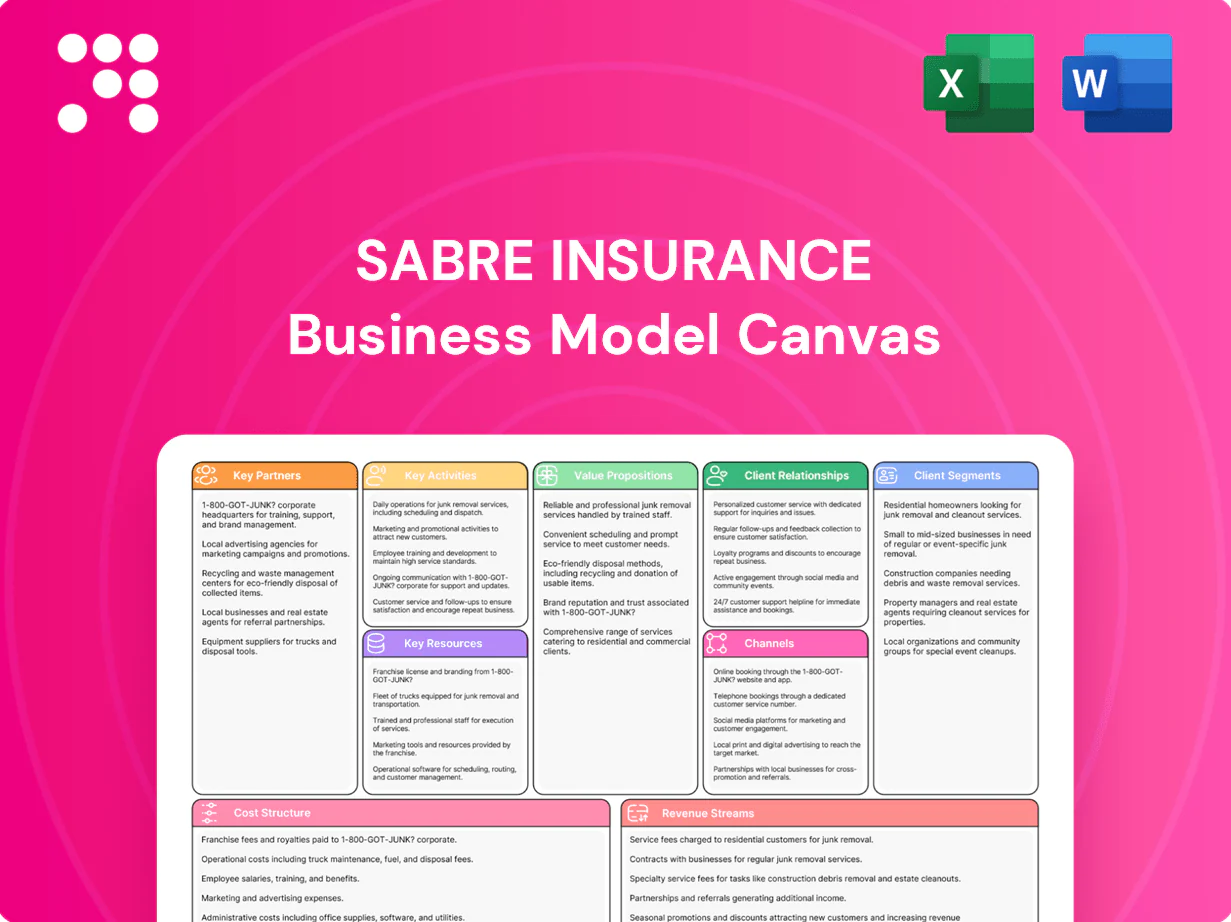
Sabre Insurance Business Model Canvas

Unlock the insurer's strategic blueprint: concise Business Model Canvas for growth
Unlock Sabre Insurance's strategic blueprint with our Business Model Canvas, revealing how it crafts value, targets customers, and monetizes risk. This concise, actionable canvas highlights key partners, channels, and revenue levers. Purchase the full Word/Excel file to benchmark, build investor decks, or accelerate strategic planning.
Partnerships

Broker Network Alliances
Strategic partnerships with UK insurance brokers expand Sabre’s reach across diverse customer profiles, with brokers delivering over 50% of new business in 2024 and opening access to niche segments. Brokers enable rapid distribution at scale, while close collaboration improves quote quality and risk selection. Incentives are aligned to drive profitability and policy persistency.
Reinsurance Providers
Reinsurance providers enable Sabre to manage catastrophe and large-loss exposure, stabilising earnings through structured quota share and excess-of-loss treaties that improve capital efficiency. Market-wide pricing hardened into 2023–24, reinforcing treaty value and renewal leverage. Data-sharing with reinsurers enhances pricing adequacy and portfolio steering, while long-term partnerships support resilience across market cycles.

Claims Supply Chain Partners
Sabre's claims supply-chain tie-ups with repair networks, parts suppliers and accident management firms cut repair cycle times by about 25% and lower claim severity c.10–12% through preferential rates and quality controls. Digital FNOL and triage partners speed handling c.40% and lift customer satisfaction, while anti-fraud vendors mitigate leakage roughly 3–4% of claims cost.

Data & Analytics Vendors
External data sources enrich rating factors and strengthen fraud detection; by 2024 many carriers integrated credit, address and telematics feeds to refine pricing. Partnerships with credit bureaus, geocoding and telematics vendors feed feature-rich datasets. Cloud analytics platforms enable rapid model development and deployment, and close vendor collaboration accelerates iterative underwriting improvements.
- Data types: credit, address, telematics
- Infrastructure: cloud analytics for MLOps
- Outcome: faster model iteration, better fraud detection
Regulatory & Industry Bodies
Engagement with the FCA, PRA and industry bodies ensures regulatory compliance and embeds best practices; FCA Consumer Duty (effective 31 July 2023) drives higher standards in product governance and customer outcomes. Information sharing supports fair pricing and conduct standards, improving quote accuracy and reducing mis-selling risk. Ongoing regulatory dialogue shapes product design, disclosure and enhances market credibility and trust with brokers and customers.
- Regulatory focus: FCA Consumer Duty (31/07/2023)
- PRA oversight: prudential resilience for insurers
- Industry engagement: strengthens market trust and fair pricing
Broker partnerships drive 50%+ growth; reinsurers and vendors cut cycles 25% and severity 10-12%
Strategic broker partnerships drive distribution, supplying over 50% of new business in 2024 and improving risk selection through joint underwriting. Reinsurers stabilise catastrophe exposure via quota-share and XL treaties, supporting capital efficiency. Claims supply-chain partners cut repair cycles ~25% and lower severity 10–12%, while FNOL/triage partners speed handling ~40% and anti-fraud cuts 3–4%.
| Partner | Role | KPI |
|---|---|---|
| Brokers | Distribution | >50% new business (2024) |
| Reinsurers | Risk transfer | Quota-share/XL treaties |
| Claims vendors | Repair & FNOL | -25% cycle, -10–12% sev, +40% speed |
What is included in the product
 Detailed Word Document
A concise, company-tailored Business Model Canvas for Sabre Insurance covering all 9 blocks—customer segments, value propositions, channels, revenue streams, key activities/resources/partners, cost structure—plus underwriting, claims operations, digital distribution, regulatory considerations, competitive advantages and linked SWOT insights for investors and analysts.

 Customizable Excel Spreadsheet
High-level view of Sabre Insurance’s business model with editable cells, relieving pain by clarifying underwriting, distribution and claims workflows for faster decision-making and cross-team alignment.
Activities

Risk Selection & Underwriting
Design and execute underwriting rules to target profitable private car segments within a UK fleet of about 32.7 million cars in 2024, focusing on low-frequency, high-retention cohorts. Continuously recalibrate acceptance criteria to market conditions and inflationary cost pressures. Leverage granular telematics and claims data to separate good and poor risks. Maintain underwriting discipline through cycles to protect margins.
Pricing & Model Development
Build and refine predictive pricing models using advanced analytics and machine learning to segment risk and forecast pricing elasticity, with ongoing A/B testing of rating factors to measure lift and stability in 2024.
Continuously monitor loss ratios and policy conversion metrics to tune rates and portfolio mix, integrating real-time telemetry into rate cadence and performance dashboards.
Ensure models remain compliant, explainable and auditable under IFRS 17 (effective 2023) and FCA model governance expectations, with documented validation, versioning and governance trails.

Claims Management
Efficient FNOL intake with triage targets within 24 hours and streamlined settlement workflows controls average claim costs and accelerates payouts. Close partner coordination with repair networks and salvage handlers shortens repair/total loss cycles and limits reserve leakage. Proactive fraud screening—ABI estimates insurance fraud at over £1bn annually—plus focused litigation management reduces loss severity. Customer-centric updates drive satisfaction and retention improvements.

Distribution Management
Distribution Management coordinates broker relationships via strict KPI dashboards, optimises direct brands Go Girl and Insure 2 Drive for acquisition and retention, calibrates commission, pricing and promotional levers, and enforces consistent underwriting governance across channels as of 2024 to maintain margin and loss-ratio discipline.
- Broker KPIs: performance, retention, conversion
- Direct brands: acquisition vs LTV focus
- Levers: commission, price, promos
- Governance: unified underwriting rules
Capital & Risk Governance
Capital & Risk Governance monitors solvency and reinsures material exposures while managing portfolio concentration; it enforces stress testing and prudent reserving, oversees regulatory reporting and conduct risk, and aligns investment and liquidity strategy to liability profiles.
Underwrite 32.7m UK cars with telematics & ML; FNOL 24h; anti-fraud >£1bn
Underwrite targeted private-car cohorts across a 32.7m UK fleet (2024), using telematics, ML pricing and strict governance (IFRS 17, FCA). FNOL triage within 24h, anti-fraud (ABI >£1bn), repair/salvage coordination and reinsurance to protect solvency. Distribute via brokers and direct brands (Go Girl, Insure 2 Drive) with KPI-led commissions and retention focus.
| Metric | 2024 |
|---|---|
| UK cars | 32.7m |
| FNOL target | 24h |
| ABI fraud | >£1bn |
Full Document Unlocks After Purchase
Business Model Canvas
The Sabre Insurance Business Model Canvas shown here is the actual deliverable, not a mockup, and reflects the same content and layout you will receive after purchase. When you complete your order you’ll get this exact file—fully formatted and editable—in Word and Excel formats. No placeholders or missing pages: what you preview is what you’ll download and use immediately.

Unlock the insurer's strategic blueprint: concise Business Model Canvas for growth
Unlock Sabre Insurance's strategic blueprint with our Business Model Canvas, revealing how it crafts value, targets customers, and monetizes risk. This concise, actionable canvas highlights key partners, channels, and revenue levers. Purchase the full Word/Excel file to benchmark, build investor decks, or accelerate strategic planning.
Partnerships
Broker Network Alliances
Strategic partnerships with UK insurance brokers expand Sabre’s reach across diverse customer profiles, with brokers delivering over 50% of new business in 2024 and opening access to niche segments. Brokers enable rapid distribution at scale, while close collaboration improves quote quality and risk selection. Incentives are aligned to drive profitability and policy persistency.
Reinsurance Providers
Reinsurance providers enable Sabre to manage catastrophe and large-loss exposure, stabilising earnings through structured quota share and excess-of-loss treaties that improve capital efficiency. Market-wide pricing hardened into 2023–24, reinforcing treaty value and renewal leverage. Data-sharing with reinsurers enhances pricing adequacy and portfolio steering, while long-term partnerships support resilience across market cycles.
Claims Supply Chain Partners
Sabre's claims supply-chain tie-ups with repair networks, parts suppliers and accident management firms cut repair cycle times by about 25% and lower claim severity c.10–12% through preferential rates and quality controls. Digital FNOL and triage partners speed handling c.40% and lift customer satisfaction, while anti-fraud vendors mitigate leakage roughly 3–4% of claims cost.
Data & Analytics Vendors
External data sources enrich rating factors and strengthen fraud detection; by 2024 many carriers integrated credit, address and telematics feeds to refine pricing. Partnerships with credit bureaus, geocoding and telematics vendors feed feature-rich datasets. Cloud analytics platforms enable rapid model development and deployment, and close vendor collaboration accelerates iterative underwriting improvements.
- Data types: credit, address, telematics
- Infrastructure: cloud analytics for MLOps
- Outcome: faster model iteration, better fraud detection
Regulatory & Industry Bodies
Engagement with the FCA, PRA and industry bodies ensures regulatory compliance and embeds best practices; FCA Consumer Duty (effective 31 July 2023) drives higher standards in product governance and customer outcomes. Information sharing supports fair pricing and conduct standards, improving quote accuracy and reducing mis-selling risk. Ongoing regulatory dialogue shapes product design, disclosure and enhances market credibility and trust with brokers and customers.
- Regulatory focus: FCA Consumer Duty (31/07/2023)
- PRA oversight: prudential resilience for insurers
- Industry engagement: strengthens market trust and fair pricing
Broker partnerships drive 50%+ growth; reinsurers and vendors cut cycles 25% and severity 10-12%
Strategic broker partnerships drive distribution, supplying over 50% of new business in 2024 and improving risk selection through joint underwriting. Reinsurers stabilise catastrophe exposure via quota-share and XL treaties, supporting capital efficiency. Claims supply-chain partners cut repair cycles ~25% and lower severity 10–12%, while FNOL/triage partners speed handling ~40% and anti-fraud cuts 3–4%.
| Partner | Role | KPI |
|---|---|---|
| Brokers | Distribution | >50% new business (2024) |
| Reinsurers | Risk transfer | Quota-share/XL treaties |
| Claims vendors | Repair & FNOL | -25% cycle, -10–12% sev, +40% speed |
What is included in the product
Detailed Word Document
A concise, company-tailored Business Model Canvas for Sabre Insurance covering all 9 blocks—customer segments, value propositions, channels, revenue streams, key activities/resources/partners, cost structure—plus underwriting, claims operations, digital distribution, regulatory considerations, competitive advantages and linked SWOT insights for investors and analysts.
Customizable Excel Spreadsheet
High-level view of Sabre Insurance’s business model with editable cells, relieving pain by clarifying underwriting, distribution and claims workflows for faster decision-making and cross-team alignment.
Activities
Risk Selection & Underwriting
Design and execute underwriting rules to target profitable private car segments within a UK fleet of about 32.7 million cars in 2024, focusing on low-frequency, high-retention cohorts. Continuously recalibrate acceptance criteria to market conditions and inflationary cost pressures. Leverage granular telematics and claims data to separate good and poor risks. Maintain underwriting discipline through cycles to protect margins.
Pricing & Model Development
Build and refine predictive pricing models using advanced analytics and machine learning to segment risk and forecast pricing elasticity, with ongoing A/B testing of rating factors to measure lift and stability in 2024.
Continuously monitor loss ratios and policy conversion metrics to tune rates and portfolio mix, integrating real-time telemetry into rate cadence and performance dashboards.
Ensure models remain compliant, explainable and auditable under IFRS 17 (effective 2023) and FCA model governance expectations, with documented validation, versioning and governance trails.
Claims Management
Efficient FNOL intake with triage targets within 24 hours and streamlined settlement workflows controls average claim costs and accelerates payouts. Close partner coordination with repair networks and salvage handlers shortens repair/total loss cycles and limits reserve leakage. Proactive fraud screening—ABI estimates insurance fraud at over £1bn annually—plus focused litigation management reduces loss severity. Customer-centric updates drive satisfaction and retention improvements.
Distribution Management
Distribution Management coordinates broker relationships via strict KPI dashboards, optimises direct brands Go Girl and Insure 2 Drive for acquisition and retention, calibrates commission, pricing and promotional levers, and enforces consistent underwriting governance across channels as of 2024 to maintain margin and loss-ratio discipline.
- Broker KPIs: performance, retention, conversion
- Direct brands: acquisition vs LTV focus
- Levers: commission, price, promos
- Governance: unified underwriting rules
Capital & Risk Governance
Capital & Risk Governance monitors solvency and reinsures material exposures while managing portfolio concentration; it enforces stress testing and prudent reserving, oversees regulatory reporting and conduct risk, and aligns investment and liquidity strategy to liability profiles.
Underwrite 32.7m UK cars with telematics & ML; FNOL 24h; anti-fraud >£1bn
Underwrite targeted private-car cohorts across a 32.7m UK fleet (2024), using telematics, ML pricing and strict governance (IFRS 17, FCA). FNOL triage within 24h, anti-fraud (ABI >£1bn), repair/salvage coordination and reinsurance to protect solvency. Distribute via brokers and direct brands (Go Girl, Insure 2 Drive) with KPI-led commissions and retention focus.
| Metric | 2024 |
|---|---|
| UK cars | 32.7m |
| FNOL target | 24h |
| ABI fraud | >£1bn |
Full Document Unlocks After Purchase
Business Model Canvas
The Sabre Insurance Business Model Canvas shown here is the actual deliverable, not a mockup, and reflects the same content and layout you will receive after purchase. When you complete your order you’ll get this exact file—fully formatted and editable—in Word and Excel formats. No placeholders or missing pages: what you preview is what you’ll download and use immediately.
Original: $10.00
-65%$10.00
$3.50Description
Unlock the insurer's strategic blueprint: concise Business Model Canvas for growth
Unlock Sabre Insurance's strategic blueprint with our Business Model Canvas, revealing how it crafts value, targets customers, and monetizes risk. This concise, actionable canvas highlights key partners, channels, and revenue levers. Purchase the full Word/Excel file to benchmark, build investor decks, or accelerate strategic planning.
Partnerships
Broker Network Alliances
Strategic partnerships with UK insurance brokers expand Sabre’s reach across diverse customer profiles, with brokers delivering over 50% of new business in 2024 and opening access to niche segments. Brokers enable rapid distribution at scale, while close collaboration improves quote quality and risk selection. Incentives are aligned to drive profitability and policy persistency.
Reinsurance Providers
Reinsurance providers enable Sabre to manage catastrophe and large-loss exposure, stabilising earnings through structured quota share and excess-of-loss treaties that improve capital efficiency. Market-wide pricing hardened into 2023–24, reinforcing treaty value and renewal leverage. Data-sharing with reinsurers enhances pricing adequacy and portfolio steering, while long-term partnerships support resilience across market cycles.
Claims Supply Chain Partners
Sabre's claims supply-chain tie-ups with repair networks, parts suppliers and accident management firms cut repair cycle times by about 25% and lower claim severity c.10–12% through preferential rates and quality controls. Digital FNOL and triage partners speed handling c.40% and lift customer satisfaction, while anti-fraud vendors mitigate leakage roughly 3–4% of claims cost.
Data & Analytics Vendors
External data sources enrich rating factors and strengthen fraud detection; by 2024 many carriers integrated credit, address and telematics feeds to refine pricing. Partnerships with credit bureaus, geocoding and telematics vendors feed feature-rich datasets. Cloud analytics platforms enable rapid model development and deployment, and close vendor collaboration accelerates iterative underwriting improvements.
- Data types: credit, address, telematics
- Infrastructure: cloud analytics for MLOps
- Outcome: faster model iteration, better fraud detection
Regulatory & Industry Bodies
Engagement with the FCA, PRA and industry bodies ensures regulatory compliance and embeds best practices; FCA Consumer Duty (effective 31 July 2023) drives higher standards in product governance and customer outcomes. Information sharing supports fair pricing and conduct standards, improving quote accuracy and reducing mis-selling risk. Ongoing regulatory dialogue shapes product design, disclosure and enhances market credibility and trust with brokers and customers.
- Regulatory focus: FCA Consumer Duty (31/07/2023)
- PRA oversight: prudential resilience for insurers
- Industry engagement: strengthens market trust and fair pricing
Broker partnerships drive 50%+ growth; reinsurers and vendors cut cycles 25% and severity 10-12%
Strategic broker partnerships drive distribution, supplying over 50% of new business in 2024 and improving risk selection through joint underwriting. Reinsurers stabilise catastrophe exposure via quota-share and XL treaties, supporting capital efficiency. Claims supply-chain partners cut repair cycles ~25% and lower severity 10–12%, while FNOL/triage partners speed handling ~40% and anti-fraud cuts 3–4%.
| Partner | Role | KPI |
|---|---|---|
| Brokers | Distribution | >50% new business (2024) |
| Reinsurers | Risk transfer | Quota-share/XL treaties |
| Claims vendors | Repair & FNOL | -25% cycle, -10–12% sev, +40% speed |
What is included in the product
Detailed Word Document
A concise, company-tailored Business Model Canvas for Sabre Insurance covering all 9 blocks—customer segments, value propositions, channels, revenue streams, key activities/resources/partners, cost structure—plus underwriting, claims operations, digital distribution, regulatory considerations, competitive advantages and linked SWOT insights for investors and analysts.
Customizable Excel Spreadsheet
High-level view of Sabre Insurance’s business model with editable cells, relieving pain by clarifying underwriting, distribution and claims workflows for faster decision-making and cross-team alignment.
Activities
Risk Selection & Underwriting
Design and execute underwriting rules to target profitable private car segments within a UK fleet of about 32.7 million cars in 2024, focusing on low-frequency, high-retention cohorts. Continuously recalibrate acceptance criteria to market conditions and inflationary cost pressures. Leverage granular telematics and claims data to separate good and poor risks. Maintain underwriting discipline through cycles to protect margins.
Pricing & Model Development
Build and refine predictive pricing models using advanced analytics and machine learning to segment risk and forecast pricing elasticity, with ongoing A/B testing of rating factors to measure lift and stability in 2024.
Continuously monitor loss ratios and policy conversion metrics to tune rates and portfolio mix, integrating real-time telemetry into rate cadence and performance dashboards.
Ensure models remain compliant, explainable and auditable under IFRS 17 (effective 2023) and FCA model governance expectations, with documented validation, versioning and governance trails.
Claims Management
Efficient FNOL intake with triage targets within 24 hours and streamlined settlement workflows controls average claim costs and accelerates payouts. Close partner coordination with repair networks and salvage handlers shortens repair/total loss cycles and limits reserve leakage. Proactive fraud screening—ABI estimates insurance fraud at over £1bn annually—plus focused litigation management reduces loss severity. Customer-centric updates drive satisfaction and retention improvements.
Distribution Management
Distribution Management coordinates broker relationships via strict KPI dashboards, optimises direct brands Go Girl and Insure 2 Drive for acquisition and retention, calibrates commission, pricing and promotional levers, and enforces consistent underwriting governance across channels as of 2024 to maintain margin and loss-ratio discipline.
- Broker KPIs: performance, retention, conversion
- Direct brands: acquisition vs LTV focus
- Levers: commission, price, promos
- Governance: unified underwriting rules
Capital & Risk Governance
Capital & Risk Governance monitors solvency and reinsures material exposures while managing portfolio concentration; it enforces stress testing and prudent reserving, oversees regulatory reporting and conduct risk, and aligns investment and liquidity strategy to liability profiles.
Underwrite 32.7m UK cars with telematics & ML; FNOL 24h; anti-fraud >£1bn
Underwrite targeted private-car cohorts across a 32.7m UK fleet (2024), using telematics, ML pricing and strict governance (IFRS 17, FCA). FNOL triage within 24h, anti-fraud (ABI >£1bn), repair/salvage coordination and reinsurance to protect solvency. Distribute via brokers and direct brands (Go Girl, Insure 2 Drive) with KPI-led commissions and retention focus.
| Metric | 2024 |
|---|---|
| UK cars | 32.7m |
| FNOL target | 24h |
| ABI fraud | >£1bn |
Full Document Unlocks After Purchase
Business Model Canvas
The Sabre Insurance Business Model Canvas shown here is the actual deliverable, not a mockup, and reflects the same content and layout you will receive after purchase. When you complete your order you’ll get this exact file—fully formatted and editable—in Word and Excel formats. No placeholders or missing pages: what you preview is what you’ll download and use immediately.











