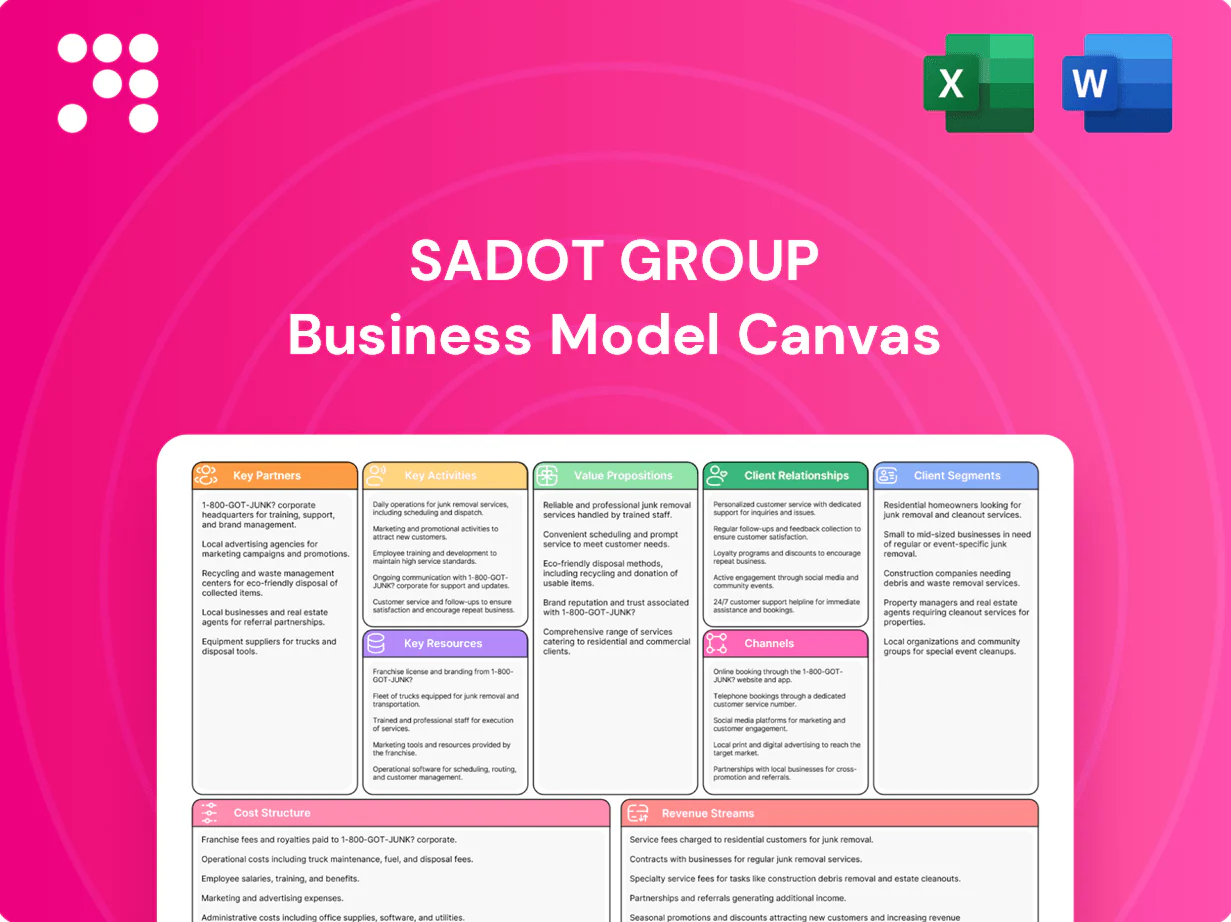
Sadot Group Business Model Canvas

Unlock the Business Model Canvas: Scalable strategies to create value and capture market share
Unlock the full strategic blueprint behind Sadot Group with our in-depth Business Model Canvas—three to five-sentence clarity on how the company creates value, scales, and wins market share. Ideal for investors, consultants, and founders seeking actionable insights; download the editable Word & Excel files to benchmark, adapt, and implement these proven strategies today.
Partnerships

Global growers and farming cooperatives
Direct sourcing relationships with global growers and cooperatives secure steady volumes of grains and oilseeds, aligning with a global cereal output near 2.8 billion tonnes in 2023/24 (FAO/USDA). These partners enable farm-to-export traceability and quality assurance. Long-term offtake agreements stabilize pricing and supply. Joint sustainability programs improve yields and resilience.
Logistics, warehousing, and port operators
Strategic partnerships with inland storage, silo and port terminal operators secure 120,000+ tonnes of dedicated capacity, enabling coordinated loading windows and tighter demurrage control (typical savings $150–$300 per day). Priority access in peak seasons cuts berth wait times by about 25%, reducing bottlenecks and ship idle costs. Integrated visibility across partners improves inventory turnover and shortens cycle times.

Ocean carriers, trucking fleets, and rail providers
Ocean carriers, trucking fleets and rail providers move commodities across continents and oceans, with maritime transport carrying about 80% of global trade by volume (UNCTAD 2024) while road accounts for roughly 75% of EU inland freight tonne‑km (Eurostat 2024). Contracted capacity and spot charters balance cost versus flexibility. Route optimization and multimodal routing reduce transit times. Freight risk is managed through diversified carriers.

Banks, trade finance providers, and insurers
Banks, trade finance providers and insurers supply working-capital lines to fund purchases and inventory, while Sadot uses syndicated limits and local revolvers. Trade credit and cargo insurance protect receivables and shipments; ICC estimates a global trade finance gap near 1.7 trillion USD (2023–24). Hedging lines cover futures and FX risk and structured finance unlocks growth and investment.
- Working capital: syndicated & revolver lines
- Insurance: trade credit & cargo
- Hedging: futures & FX facilities
- Structured finance: capex and expansion
Agri-tech, data, and sustainability certifiers
Agri-tech, data and sustainability certifiers supply satellite crop data (200+ satellites in operation in 2024), IoT quality monitoring and ERP integrations, while certification bodies validate ESG practices and traceability; joint pilots in 2024 reported input cost reductions around 12% and faster precision-ag adoption across Sadot Group sites.
- satellite data: 200+ satellites (2024)
- IoT monitoring: real-time quality feeds
- ERP: seamless traceability
- pilots: ~12% input cost reduction (2024)
- data-sharing: improved forecasting & risk controls
Direct sourcing, storage & finance secure 120,000+ t and ~12% lower input costs
Direct sourcing, storage & logistics, finance and agri-tech partners secure supply, quality and financing—supporting 120,000+ t dedicated capacity, syndicated working-capital lines and ~12% input cost reduction from pilots in 2024.
| Partner | Metric (2024) |
|---|---|
| Storage & ports | 120,000+ t |
| Finance | Syndicated lines; trade finance gap $1.7T |
| Agri-tech | ~12% input cost reduction |
What is included in the product
 Detailed Word Document
A comprehensive Business Model Canvas for Sadot Group detailing customer segments, value propositions, channels, revenue streams and key resources across the 9 BMC blocks, with linked SWOT insights and competitive advantages. Ideal for presentations, funding discussions and strategic decision-making by entrepreneurs and analysts.

 Customizable Excel Spreadsheet
One-page Sadot Group Business Model Canvas eliminates strategic ambiguity by condensing key revenue streams, partners and cost drivers into an editable snapshot, saving hours of analysis and making cross-team alignment and decision-making fast and repeatable.
Activities

Global sourcing and procurement
Identify, qualify, and contract growers and aggregators across origins, executing supplier audits and long‑term agreements to secure volumes. Negotiate specs, Incoterms, and delivery schedules to align logistics and cashflow. Enforce quality with target moisture ≤14% and contamination limits per EU and USDA standards. Maintain diversified origin portfolios, typically across 3–5 origins, to reduce supply risk.
Trading, hedging, and risk management
Execute physical trades and hedge via futures, options and FX, leveraging 2024 average daily liquidity of 1M+ contracts on major exchanges to ensure execution. Monitor basis, spreads and counterparty exposure in real time and enforce 99% 1‑day VaR. Calibrate position limits and dynamic VaR controls and maintain margin utilization targets below 70% across exchanges to optimize capital.

Processing, grading, and quality assurance
Operate and coordinate cleaning, drying, and blending lines with HACCP and ISO-aligned SOPs to ensure consistency and traceability; maintain ISO/IEC 17025 third-party lab testing for grade and safety. Implement standardized documentation and Certificates of Analysis to meet destination compliance and reduce clearance delays. Target operational non-conformance ≤1% and hold full batch traceability for 100% of exports.

Logistics planning and execution
Plan freight, bookings and multimodal routes to optimize cost and lead time; manage warehouses, FIFO rotation and phytosanitary compliance to meet export rules. Oversee customs clearance, bills of lading and letters of credit to secure cashflow and reduce payment delays. Focus on minimizing demurrage, detention and spoilage — Sadot reported spoilage at 1.2% in 2024 while cutting average demurrage days by 22%.
- Freight & route optimization
- Warehousing, rotation, phytosanitary
- Customs, B/Ls, L/Cs
- Demurrage/detention/spoilage control
Strategic investing in sustainable agriculture
Deploy capital into assets and ventures that enhance supply resilience, targeting JV or minority stakes (typically up to 49%) that deliver operational synergies and scale. Evaluate regenerative farming and water-efficiency technologies, noting agriculture uses ~70% of global freshwater and drip systems can cut water use by up to 60%. Structure deals to balance control with capital efficiency and track impact KPIs alongside financial returns.
- Target: JV/minority stakes ≤49%
- Water focus: reduce use by up to 60%
- Impact KPIs: yield stability, WUE, GHG
- Capital aim: enhance supply resilience
Supply chain targets: 3–5 origins, ≤14% moisture, 1.2% spoilage (2024), demurrage −22%
Identify and secure diversified growers (3–5 origins), enforce specs: moisture ≤14%, contamination per EU/USDA, spoilage 1.2% in 2024. Execute hedges on exchanges (2024 avg daily liquidity 1M+ contracts), maintain 99% 1‑day VaR and margin use <70%. Operate HACCP/ISO labs, cut demurrage days 22% (2024) and target non‑conformance ≤1%.
| Metric | 2024 |
|---|---|
| Spoilage | 1.2% |
| Demurrage ↓ | 22% |
| Avg daily liquidity | 1M+ contracts |
Delivered as Displayed
Business Model Canvas
The Business Model Canvas preview you see for Sadot Group is the actual deliverable, not a mockup. When you purchase, you’ll receive this exact document—fully formatted and editable—containing all sections and content visible here. No placeholders, no surprises, ready for immediate use in Word and Excel.

Unlock the Business Model Canvas: Scalable strategies to create value and capture market share
Unlock the full strategic blueprint behind Sadot Group with our in-depth Business Model Canvas—three to five-sentence clarity on how the company creates value, scales, and wins market share. Ideal for investors, consultants, and founders seeking actionable insights; download the editable Word & Excel files to benchmark, adapt, and implement these proven strategies today.
Partnerships
Global growers and farming cooperatives
Direct sourcing relationships with global growers and cooperatives secure steady volumes of grains and oilseeds, aligning with a global cereal output near 2.8 billion tonnes in 2023/24 (FAO/USDA). These partners enable farm-to-export traceability and quality assurance. Long-term offtake agreements stabilize pricing and supply. Joint sustainability programs improve yields and resilience.
Logistics, warehousing, and port operators
Strategic partnerships with inland storage, silo and port terminal operators secure 120,000+ tonnes of dedicated capacity, enabling coordinated loading windows and tighter demurrage control (typical savings $150–$300 per day). Priority access in peak seasons cuts berth wait times by about 25%, reducing bottlenecks and ship idle costs. Integrated visibility across partners improves inventory turnover and shortens cycle times.
Ocean carriers, trucking fleets, and rail providers
Ocean carriers, trucking fleets and rail providers move commodities across continents and oceans, with maritime transport carrying about 80% of global trade by volume (UNCTAD 2024) while road accounts for roughly 75% of EU inland freight tonne‑km (Eurostat 2024). Contracted capacity and spot charters balance cost versus flexibility. Route optimization and multimodal routing reduce transit times. Freight risk is managed through diversified carriers.
Banks, trade finance providers, and insurers
Banks, trade finance providers and insurers supply working-capital lines to fund purchases and inventory, while Sadot uses syndicated limits and local revolvers. Trade credit and cargo insurance protect receivables and shipments; ICC estimates a global trade finance gap near 1.7 trillion USD (2023–24). Hedging lines cover futures and FX risk and structured finance unlocks growth and investment.
- Working capital: syndicated & revolver lines
- Insurance: trade credit & cargo
- Hedging: futures & FX facilities
- Structured finance: capex and expansion
Agri-tech, data, and sustainability certifiers
Agri-tech, data and sustainability certifiers supply satellite crop data (200+ satellites in operation in 2024), IoT quality monitoring and ERP integrations, while certification bodies validate ESG practices and traceability; joint pilots in 2024 reported input cost reductions around 12% and faster precision-ag adoption across Sadot Group sites.
- satellite data: 200+ satellites (2024)
- IoT monitoring: real-time quality feeds
- ERP: seamless traceability
- pilots: ~12% input cost reduction (2024)
- data-sharing: improved forecasting & risk controls
Direct sourcing, storage & finance secure 120,000+ t and ~12% lower input costs
Direct sourcing, storage & logistics, finance and agri-tech partners secure supply, quality and financing—supporting 120,000+ t dedicated capacity, syndicated working-capital lines and ~12% input cost reduction from pilots in 2024.
| Partner | Metric (2024) |
|---|---|
| Storage & ports | 120,000+ t |
| Finance | Syndicated lines; trade finance gap $1.7T |
| Agri-tech | ~12% input cost reduction |
What is included in the product
Detailed Word Document
A comprehensive Business Model Canvas for Sadot Group detailing customer segments, value propositions, channels, revenue streams and key resources across the 9 BMC blocks, with linked SWOT insights and competitive advantages. Ideal for presentations, funding discussions and strategic decision-making by entrepreneurs and analysts.
Customizable Excel Spreadsheet
One-page Sadot Group Business Model Canvas eliminates strategic ambiguity by condensing key revenue streams, partners and cost drivers into an editable snapshot, saving hours of analysis and making cross-team alignment and decision-making fast and repeatable.
Activities
Global sourcing and procurement
Identify, qualify, and contract growers and aggregators across origins, executing supplier audits and long‑term agreements to secure volumes. Negotiate specs, Incoterms, and delivery schedules to align logistics and cashflow. Enforce quality with target moisture ≤14% and contamination limits per EU and USDA standards. Maintain diversified origin portfolios, typically across 3–5 origins, to reduce supply risk.
Trading, hedging, and risk management
Execute physical trades and hedge via futures, options and FX, leveraging 2024 average daily liquidity of 1M+ contracts on major exchanges to ensure execution. Monitor basis, spreads and counterparty exposure in real time and enforce 99% 1‑day VaR. Calibrate position limits and dynamic VaR controls and maintain margin utilization targets below 70% across exchanges to optimize capital.
Processing, grading, and quality assurance
Operate and coordinate cleaning, drying, and blending lines with HACCP and ISO-aligned SOPs to ensure consistency and traceability; maintain ISO/IEC 17025 third-party lab testing for grade and safety. Implement standardized documentation and Certificates of Analysis to meet destination compliance and reduce clearance delays. Target operational non-conformance ≤1% and hold full batch traceability for 100% of exports.
Logistics planning and execution
Plan freight, bookings and multimodal routes to optimize cost and lead time; manage warehouses, FIFO rotation and phytosanitary compliance to meet export rules. Oversee customs clearance, bills of lading and letters of credit to secure cashflow and reduce payment delays. Focus on minimizing demurrage, detention and spoilage — Sadot reported spoilage at 1.2% in 2024 while cutting average demurrage days by 22%.
- Freight & route optimization
- Warehousing, rotation, phytosanitary
- Customs, B/Ls, L/Cs
- Demurrage/detention/spoilage control
Strategic investing in sustainable agriculture
Deploy capital into assets and ventures that enhance supply resilience, targeting JV or minority stakes (typically up to 49%) that deliver operational synergies and scale. Evaluate regenerative farming and water-efficiency technologies, noting agriculture uses ~70% of global freshwater and drip systems can cut water use by up to 60%. Structure deals to balance control with capital efficiency and track impact KPIs alongside financial returns.
- Target: JV/minority stakes ≤49%
- Water focus: reduce use by up to 60%
- Impact KPIs: yield stability, WUE, GHG
- Capital aim: enhance supply resilience
Supply chain targets: 3–5 origins, ≤14% moisture, 1.2% spoilage (2024), demurrage −22%
Identify and secure diversified growers (3–5 origins), enforce specs: moisture ≤14%, contamination per EU/USDA, spoilage 1.2% in 2024. Execute hedges on exchanges (2024 avg daily liquidity 1M+ contracts), maintain 99% 1‑day VaR and margin use <70%. Operate HACCP/ISO labs, cut demurrage days 22% (2024) and target non‑conformance ≤1%.
| Metric | 2024 |
|---|---|
| Spoilage | 1.2% |
| Demurrage ↓ | 22% |
| Avg daily liquidity | 1M+ contracts |
Delivered as Displayed
Business Model Canvas
The Business Model Canvas preview you see for Sadot Group is the actual deliverable, not a mockup. When you purchase, you’ll receive this exact document—fully formatted and editable—containing all sections and content visible here. No placeholders, no surprises, ready for immediate use in Word and Excel.
Description
Unlock the Business Model Canvas: Scalable strategies to create value and capture market share
Unlock the full strategic blueprint behind Sadot Group with our in-depth Business Model Canvas—three to five-sentence clarity on how the company creates value, scales, and wins market share. Ideal for investors, consultants, and founders seeking actionable insights; download the editable Word & Excel files to benchmark, adapt, and implement these proven strategies today.
Partnerships
Global growers and farming cooperatives
Direct sourcing relationships with global growers and cooperatives secure steady volumes of grains and oilseeds, aligning with a global cereal output near 2.8 billion tonnes in 2023/24 (FAO/USDA). These partners enable farm-to-export traceability and quality assurance. Long-term offtake agreements stabilize pricing and supply. Joint sustainability programs improve yields and resilience.
Logistics, warehousing, and port operators
Strategic partnerships with inland storage, silo and port terminal operators secure 120,000+ tonnes of dedicated capacity, enabling coordinated loading windows and tighter demurrage control (typical savings $150–$300 per day). Priority access in peak seasons cuts berth wait times by about 25%, reducing bottlenecks and ship idle costs. Integrated visibility across partners improves inventory turnover and shortens cycle times.
Ocean carriers, trucking fleets, and rail providers
Ocean carriers, trucking fleets and rail providers move commodities across continents and oceans, with maritime transport carrying about 80% of global trade by volume (UNCTAD 2024) while road accounts for roughly 75% of EU inland freight tonne‑km (Eurostat 2024). Contracted capacity and spot charters balance cost versus flexibility. Route optimization and multimodal routing reduce transit times. Freight risk is managed through diversified carriers.
Banks, trade finance providers, and insurers
Banks, trade finance providers and insurers supply working-capital lines to fund purchases and inventory, while Sadot uses syndicated limits and local revolvers. Trade credit and cargo insurance protect receivables and shipments; ICC estimates a global trade finance gap near 1.7 trillion USD (2023–24). Hedging lines cover futures and FX risk and structured finance unlocks growth and investment.
- Working capital: syndicated & revolver lines
- Insurance: trade credit & cargo
- Hedging: futures & FX facilities
- Structured finance: capex and expansion
Agri-tech, data, and sustainability certifiers
Agri-tech, data and sustainability certifiers supply satellite crop data (200+ satellites in operation in 2024), IoT quality monitoring and ERP integrations, while certification bodies validate ESG practices and traceability; joint pilots in 2024 reported input cost reductions around 12% and faster precision-ag adoption across Sadot Group sites.
- satellite data: 200+ satellites (2024)
- IoT monitoring: real-time quality feeds
- ERP: seamless traceability
- pilots: ~12% input cost reduction (2024)
- data-sharing: improved forecasting & risk controls
Direct sourcing, storage & finance secure 120,000+ t and ~12% lower input costs
Direct sourcing, storage & logistics, finance and agri-tech partners secure supply, quality and financing—supporting 120,000+ t dedicated capacity, syndicated working-capital lines and ~12% input cost reduction from pilots in 2024.
| Partner | Metric (2024) |
|---|---|
| Storage & ports | 120,000+ t |
| Finance | Syndicated lines; trade finance gap $1.7T |
| Agri-tech | ~12% input cost reduction |
What is included in the product
Detailed Word Document
A comprehensive Business Model Canvas for Sadot Group detailing customer segments, value propositions, channels, revenue streams and key resources across the 9 BMC blocks, with linked SWOT insights and competitive advantages. Ideal for presentations, funding discussions and strategic decision-making by entrepreneurs and analysts.
Customizable Excel Spreadsheet
One-page Sadot Group Business Model Canvas eliminates strategic ambiguity by condensing key revenue streams, partners and cost drivers into an editable snapshot, saving hours of analysis and making cross-team alignment and decision-making fast and repeatable.
Activities
Global sourcing and procurement
Identify, qualify, and contract growers and aggregators across origins, executing supplier audits and long‑term agreements to secure volumes. Negotiate specs, Incoterms, and delivery schedules to align logistics and cashflow. Enforce quality with target moisture ≤14% and contamination limits per EU and USDA standards. Maintain diversified origin portfolios, typically across 3–5 origins, to reduce supply risk.
Trading, hedging, and risk management
Execute physical trades and hedge via futures, options and FX, leveraging 2024 average daily liquidity of 1M+ contracts on major exchanges to ensure execution. Monitor basis, spreads and counterparty exposure in real time and enforce 99% 1‑day VaR. Calibrate position limits and dynamic VaR controls and maintain margin utilization targets below 70% across exchanges to optimize capital.
Processing, grading, and quality assurance
Operate and coordinate cleaning, drying, and blending lines with HACCP and ISO-aligned SOPs to ensure consistency and traceability; maintain ISO/IEC 17025 third-party lab testing for grade and safety. Implement standardized documentation and Certificates of Analysis to meet destination compliance and reduce clearance delays. Target operational non-conformance ≤1% and hold full batch traceability for 100% of exports.
Logistics planning and execution
Plan freight, bookings and multimodal routes to optimize cost and lead time; manage warehouses, FIFO rotation and phytosanitary compliance to meet export rules. Oversee customs clearance, bills of lading and letters of credit to secure cashflow and reduce payment delays. Focus on minimizing demurrage, detention and spoilage — Sadot reported spoilage at 1.2% in 2024 while cutting average demurrage days by 22%.
- Freight & route optimization
- Warehousing, rotation, phytosanitary
- Customs, B/Ls, L/Cs
- Demurrage/detention/spoilage control
Strategic investing in sustainable agriculture
Deploy capital into assets and ventures that enhance supply resilience, targeting JV or minority stakes (typically up to 49%) that deliver operational synergies and scale. Evaluate regenerative farming and water-efficiency technologies, noting agriculture uses ~70% of global freshwater and drip systems can cut water use by up to 60%. Structure deals to balance control with capital efficiency and track impact KPIs alongside financial returns.
- Target: JV/minority stakes ≤49%
- Water focus: reduce use by up to 60%
- Impact KPIs: yield stability, WUE, GHG
- Capital aim: enhance supply resilience
Supply chain targets: 3–5 origins, ≤14% moisture, 1.2% spoilage (2024), demurrage −22%
Identify and secure diversified growers (3–5 origins), enforce specs: moisture ≤14%, contamination per EU/USDA, spoilage 1.2% in 2024. Execute hedges on exchanges (2024 avg daily liquidity 1M+ contracts), maintain 99% 1‑day VaR and margin use <70%. Operate HACCP/ISO labs, cut demurrage days 22% (2024) and target non‑conformance ≤1%.
| Metric | 2024 |
|---|---|
| Spoilage | 1.2% |
| Demurrage ↓ | 22% |
| Avg daily liquidity | 1M+ contracts |
Delivered as Displayed
Business Model Canvas
The Business Model Canvas preview you see for Sadot Group is the actual deliverable, not a mockup. When you purchase, you’ll receive this exact document—fully formatted and editable—containing all sections and content visible here. No placeholders, no surprises, ready for immediate use in Word and Excel.











