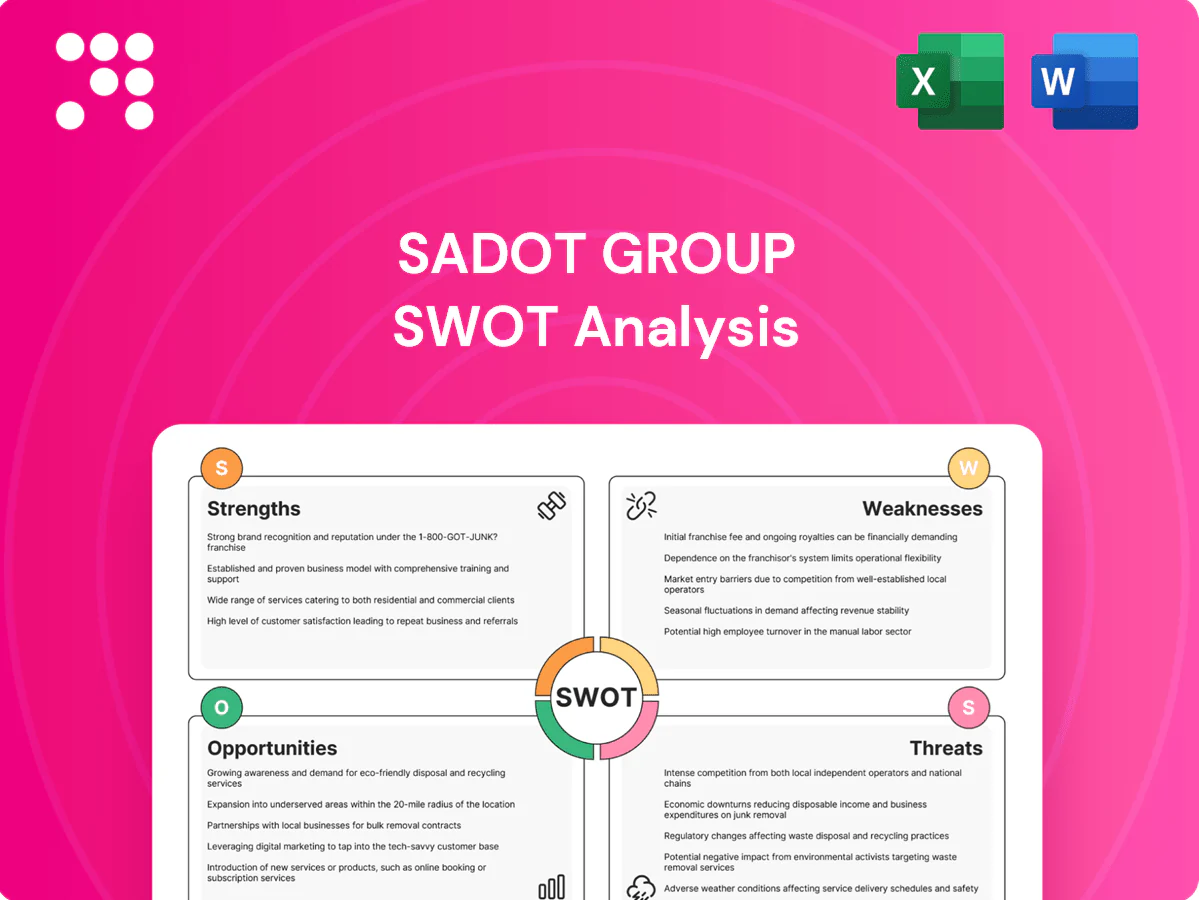
Sadot Group SWOT Analysis

Your Strategic Toolkit Starts Here
Explore a concise SWOT snapshot of Sadot Group—highlighting core strengths, emerging risks, and key growth drivers that shape its market position. Want the full picture with actionable insights, financial context, and editable deliverables? Purchase the complete SWOT analysis to access a professionally written Word report and bonus Excel tools for strategy, pitching, and investment decisions.
Strengths

Integrated agri-supply chain
End-to-end capabilities from sourcing to distribution let Sadot Group control costs and assure quality across the chain, addressing a global context where FAO reports roughly 1.3 billion tonnes of food lost or wasted annually. Vertical coordination improves responsiveness to market dislocations, supporting faster rerouting and inventory turns in a $1.9 trillion global agricultural trade market (2023). This integration enables margin capture across nodes and fosters reliability for counterparties.
Global trading footprint
Sadot Group's global trading footprint reduces single-country risk by diversifying origination and destination markets, while network effects boost deal flow and market intelligence; access to multiple ports and partners increases logistical optionality and supports scaling in core grains and food products.

Risk management know-how
Sadot Group's risk management know-how covers hedging, logistics and counterparty controls, key for commodity trading where margins typically run 1–3%. Process discipline protects thin margins in volatile markets; structured contracts and hedges stabilize cash flows and can cut earnings volatility by up to 30–40% in industry studies. Institutional practices build lender and supplier confidence, supporting trade finance lines and lower borrowing costs.

Data-driven logistics optimization
Operational data optimizes routing, storage and timing, reducing empty miles and improving on-time delivery; industry studies show data-driven logistics can cut transport costs by around 15% (2023–24 benchmarks). Better load planning lowers demurrage and wastage, helping reduce turnaround days and inventory shrink. Analytics enable basis and freight arbitrage, improving working-capital turns and incremental ROIC.
- ~15% transport cost reduction
- Lower demurrage/turnaround days
- Improved working-capital turns and ROIC
Strategic investment mandate
Strategic investment mandate lets Sadot Group allocate capital into sustainable agriculture, opening new growth avenues and reducing dependence on commodity cycles through portfolio optionality; adjacent stakes can secure upstream supply and differentiate product offerings, while appealing to ESG-oriented partners and institutional capital.
- Capital into sustainable ag
- Supply-securing adjacencies
- Portfolio cyclicality hedge
- Attracts ESG partners/capital
Sourcing-to-distribution cuts costs, trims volatility ~30-40% and protects 1-3% margin
Integrated sourcing-to-distribution control reduces costs and quality risk, supporting margin capture across nodes in a $1.9T global ag trade (2023) and addressing FAO 1.3bn t food loss. Global footprint lowers country risk; hedging and controls cut earnings volatility ~30–40% and protect 1–3% commodity margins.
| Metric | Value |
|---|---|
| Global ag trade (2023) | $1.9T |
| Food loss (FAO) | 1.3bn t |
| Transport cost cut | ~15% |
| Margin range | 1–3% |
| Volatility reduction | 30–40% |
What is included in the product
 Detailed Word Document
Delivers a strategic overview of Sadot Group’s internal and external business factors, outlining strengths, weaknesses, opportunities and threats to assess its competitive position, growth drivers, operational gaps and market risks.

 Customizable Excel Spreadsheet
Provides a concise SWOT matrix for Sadot Group that quickly identifies strengths, weaknesses, opportunities and threats to relieve strategic planning bottlenecks. Editable format allows fast updates to reflect shifting market or operational priorities for rapid decision-making.
Weaknesses

Thin, volatile margins
Thin, volatile margins: agri-trading margins often run below 3%, so competitive pricing quickly compresses Sadot Group’s profitability. Small basis errors or logistics slippages can erase gains on single contracts. Scaling earnings demands high throughput and tight cost control, while cycle-driven price swings make revenue predictability challenging.
Working-capital intensity
Sadot Group exhibits high working-capital intensity: inventory, receivables and trade-finance needs are substantial, creating liquidity constraints that can limit deal execution. Rising interest-rate levels directly pressure net income through higher financing costs. Debt covenants in existing facilities may restrict strategic flexibility. Latest company-level figures are not publicly verifiable for 2024–2025.

Exposure to operational bottlenecks
Port congestion, storage limits and transport disruptions impair Sadot Group service levels, with execution failures exposing the firm to penalties and direct losses; insufficient redundancy in warehousing and transport networks elevates operational risk and can cascade into missed SLAs, while repeated delays erode customer trust and contract renewals.

Concentration in core commodities
Reliance on grains and staple foods concentrates Sadot Group's market exposure, making revenues sensitive to single-commodity cycles. Adverse harvests or export policy shifts in key origins can quickly ripple through margins and volumes. Limited product diversification reduces pricing power and constrains cross-cycle resilience.
- Concentration risk
- Supply-origin vulnerability
- Weak pricing leverage
- Low cyclical hedging
Scale versus majors
Global agribusiness giants (top four control ~70% of global grain trade) have deeper capital, larger fleets and origination networks, enabling lower unit costs and higher capacity; Cargill reported roughly $165B revenue in 2023, illustrating scale gaps. Supplier access and freight terms often favor these players, and Sadot Group may struggle with brand recognition in new markets.
- Scale concentration: top4 ~70% global grain trade
- Capital gap: Cargill ~$165B revenue (2023)
- Competitive pressure: price & capacity disadvantage
- Supply/freight terms and brand recognition risks
Sub-3% margins and capital-heavy grain trading squeezed by top-four global dominance
Thin sub-3% trading margins, high working-capital intensity and logistics bottlenecks compress profitability and limit growth; concentration in grains exposes Sadot Group to single-commodity cycles while top-four players control ~70% of global grain trade, creating scale and freight-cost disadvantages (Cargill revenue ~$165B in 2023).
| Metric | Value | Source |
|---|---|---|
| Trading margins | <3% | Industry |
| Top-4 market share | ~70% | Industry |
| Cargill revenue | $165B (2023) | Company filings |
Preview the Actual Deliverable
Sadot Group SWOT Analysis
This is the actual SWOT analysis of Sadot Group you’ll receive upon purchase—no surprises, just professional quality. The preview below is taken directly from the full SWOT report you'll get; purchase unlocks the complete, editable version. You’re viewing a live preview of the real file—buy now to access the full, detailed report.

Your Strategic Toolkit Starts Here
Explore a concise SWOT snapshot of Sadot Group—highlighting core strengths, emerging risks, and key growth drivers that shape its market position. Want the full picture with actionable insights, financial context, and editable deliverables? Purchase the complete SWOT analysis to access a professionally written Word report and bonus Excel tools for strategy, pitching, and investment decisions.
Strengths
Integrated agri-supply chain
End-to-end capabilities from sourcing to distribution let Sadot Group control costs and assure quality across the chain, addressing a global context where FAO reports roughly 1.3 billion tonnes of food lost or wasted annually. Vertical coordination improves responsiveness to market dislocations, supporting faster rerouting and inventory turns in a $1.9 trillion global agricultural trade market (2023). This integration enables margin capture across nodes and fosters reliability for counterparties.
Global trading footprint
Sadot Group's global trading footprint reduces single-country risk by diversifying origination and destination markets, while network effects boost deal flow and market intelligence; access to multiple ports and partners increases logistical optionality and supports scaling in core grains and food products.
Risk management know-how
Sadot Group's risk management know-how covers hedging, logistics and counterparty controls, key for commodity trading where margins typically run 1–3%. Process discipline protects thin margins in volatile markets; structured contracts and hedges stabilize cash flows and can cut earnings volatility by up to 30–40% in industry studies. Institutional practices build lender and supplier confidence, supporting trade finance lines and lower borrowing costs.
Data-driven logistics optimization
Operational data optimizes routing, storage and timing, reducing empty miles and improving on-time delivery; industry studies show data-driven logistics can cut transport costs by around 15% (2023–24 benchmarks). Better load planning lowers demurrage and wastage, helping reduce turnaround days and inventory shrink. Analytics enable basis and freight arbitrage, improving working-capital turns and incremental ROIC.
- ~15% transport cost reduction
- Lower demurrage/turnaround days
- Improved working-capital turns and ROIC
Strategic investment mandate
Strategic investment mandate lets Sadot Group allocate capital into sustainable agriculture, opening new growth avenues and reducing dependence on commodity cycles through portfolio optionality; adjacent stakes can secure upstream supply and differentiate product offerings, while appealing to ESG-oriented partners and institutional capital.
- Capital into sustainable ag
- Supply-securing adjacencies
- Portfolio cyclicality hedge
- Attracts ESG partners/capital
Sourcing-to-distribution cuts costs, trims volatility ~30-40% and protects 1-3% margin
Integrated sourcing-to-distribution control reduces costs and quality risk, supporting margin capture across nodes in a $1.9T global ag trade (2023) and addressing FAO 1.3bn t food loss. Global footprint lowers country risk; hedging and controls cut earnings volatility ~30–40% and protect 1–3% commodity margins.
| Metric | Value |
|---|---|
| Global ag trade (2023) | $1.9T |
| Food loss (FAO) | 1.3bn t |
| Transport cost cut | ~15% |
| Margin range | 1–3% |
| Volatility reduction | 30–40% |
What is included in the product
Detailed Word Document
Delivers a strategic overview of Sadot Group’s internal and external business factors, outlining strengths, weaknesses, opportunities and threats to assess its competitive position, growth drivers, operational gaps and market risks.
Customizable Excel Spreadsheet
Provides a concise SWOT matrix for Sadot Group that quickly identifies strengths, weaknesses, opportunities and threats to relieve strategic planning bottlenecks. Editable format allows fast updates to reflect shifting market or operational priorities for rapid decision-making.
Weaknesses
Thin, volatile margins
Thin, volatile margins: agri-trading margins often run below 3%, so competitive pricing quickly compresses Sadot Group’s profitability. Small basis errors or logistics slippages can erase gains on single contracts. Scaling earnings demands high throughput and tight cost control, while cycle-driven price swings make revenue predictability challenging.
Working-capital intensity
Sadot Group exhibits high working-capital intensity: inventory, receivables and trade-finance needs are substantial, creating liquidity constraints that can limit deal execution. Rising interest-rate levels directly pressure net income through higher financing costs. Debt covenants in existing facilities may restrict strategic flexibility. Latest company-level figures are not publicly verifiable for 2024–2025.
Exposure to operational bottlenecks
Port congestion, storage limits and transport disruptions impair Sadot Group service levels, with execution failures exposing the firm to penalties and direct losses; insufficient redundancy in warehousing and transport networks elevates operational risk and can cascade into missed SLAs, while repeated delays erode customer trust and contract renewals.
Concentration in core commodities
Reliance on grains and staple foods concentrates Sadot Group's market exposure, making revenues sensitive to single-commodity cycles. Adverse harvests or export policy shifts in key origins can quickly ripple through margins and volumes. Limited product diversification reduces pricing power and constrains cross-cycle resilience.
- Concentration risk
- Supply-origin vulnerability
- Weak pricing leverage
- Low cyclical hedging
Scale versus majors
Global agribusiness giants (top four control ~70% of global grain trade) have deeper capital, larger fleets and origination networks, enabling lower unit costs and higher capacity; Cargill reported roughly $165B revenue in 2023, illustrating scale gaps. Supplier access and freight terms often favor these players, and Sadot Group may struggle with brand recognition in new markets.
- Scale concentration: top4 ~70% global grain trade
- Capital gap: Cargill ~$165B revenue (2023)
- Competitive pressure: price & capacity disadvantage
- Supply/freight terms and brand recognition risks
Sub-3% margins and capital-heavy grain trading squeezed by top-four global dominance
Thin sub-3% trading margins, high working-capital intensity and logistics bottlenecks compress profitability and limit growth; concentration in grains exposes Sadot Group to single-commodity cycles while top-four players control ~70% of global grain trade, creating scale and freight-cost disadvantages (Cargill revenue ~$165B in 2023).
| Metric | Value | Source |
|---|---|---|
| Trading margins | <3% | Industry |
| Top-4 market share | ~70% | Industry |
| Cargill revenue | $165B (2023) | Company filings |
Preview the Actual Deliverable
Sadot Group SWOT Analysis
This is the actual SWOT analysis of Sadot Group you’ll receive upon purchase—no surprises, just professional quality. The preview below is taken directly from the full SWOT report you'll get; purchase unlocks the complete, editable version. You’re viewing a live preview of the real file—buy now to access the full, detailed report.
Original: $10.00
-65%$10.00
$3.50Description
Your Strategic Toolkit Starts Here
Explore a concise SWOT snapshot of Sadot Group—highlighting core strengths, emerging risks, and key growth drivers that shape its market position. Want the full picture with actionable insights, financial context, and editable deliverables? Purchase the complete SWOT analysis to access a professionally written Word report and bonus Excel tools for strategy, pitching, and investment decisions.
Strengths
Integrated agri-supply chain
End-to-end capabilities from sourcing to distribution let Sadot Group control costs and assure quality across the chain, addressing a global context where FAO reports roughly 1.3 billion tonnes of food lost or wasted annually. Vertical coordination improves responsiveness to market dislocations, supporting faster rerouting and inventory turns in a $1.9 trillion global agricultural trade market (2023). This integration enables margin capture across nodes and fosters reliability for counterparties.
Global trading footprint
Sadot Group's global trading footprint reduces single-country risk by diversifying origination and destination markets, while network effects boost deal flow and market intelligence; access to multiple ports and partners increases logistical optionality and supports scaling in core grains and food products.
Risk management know-how
Sadot Group's risk management know-how covers hedging, logistics and counterparty controls, key for commodity trading where margins typically run 1–3%. Process discipline protects thin margins in volatile markets; structured contracts and hedges stabilize cash flows and can cut earnings volatility by up to 30–40% in industry studies. Institutional practices build lender and supplier confidence, supporting trade finance lines and lower borrowing costs.
Data-driven logistics optimization
Operational data optimizes routing, storage and timing, reducing empty miles and improving on-time delivery; industry studies show data-driven logistics can cut transport costs by around 15% (2023–24 benchmarks). Better load planning lowers demurrage and wastage, helping reduce turnaround days and inventory shrink. Analytics enable basis and freight arbitrage, improving working-capital turns and incremental ROIC.
- ~15% transport cost reduction
- Lower demurrage/turnaround days
- Improved working-capital turns and ROIC
Strategic investment mandate
Strategic investment mandate lets Sadot Group allocate capital into sustainable agriculture, opening new growth avenues and reducing dependence on commodity cycles through portfolio optionality; adjacent stakes can secure upstream supply and differentiate product offerings, while appealing to ESG-oriented partners and institutional capital.
- Capital into sustainable ag
- Supply-securing adjacencies
- Portfolio cyclicality hedge
- Attracts ESG partners/capital
Sourcing-to-distribution cuts costs, trims volatility ~30-40% and protects 1-3% margin
Integrated sourcing-to-distribution control reduces costs and quality risk, supporting margin capture across nodes in a $1.9T global ag trade (2023) and addressing FAO 1.3bn t food loss. Global footprint lowers country risk; hedging and controls cut earnings volatility ~30–40% and protect 1–3% commodity margins.
| Metric | Value |
|---|---|
| Global ag trade (2023) | $1.9T |
| Food loss (FAO) | 1.3bn t |
| Transport cost cut | ~15% |
| Margin range | 1–3% |
| Volatility reduction | 30–40% |
What is included in the product
Detailed Word Document
Delivers a strategic overview of Sadot Group’s internal and external business factors, outlining strengths, weaknesses, opportunities and threats to assess its competitive position, growth drivers, operational gaps and market risks.
Customizable Excel Spreadsheet
Provides a concise SWOT matrix for Sadot Group that quickly identifies strengths, weaknesses, opportunities and threats to relieve strategic planning bottlenecks. Editable format allows fast updates to reflect shifting market or operational priorities for rapid decision-making.
Weaknesses
Thin, volatile margins
Thin, volatile margins: agri-trading margins often run below 3%, so competitive pricing quickly compresses Sadot Group’s profitability. Small basis errors or logistics slippages can erase gains on single contracts. Scaling earnings demands high throughput and tight cost control, while cycle-driven price swings make revenue predictability challenging.
Working-capital intensity
Sadot Group exhibits high working-capital intensity: inventory, receivables and trade-finance needs are substantial, creating liquidity constraints that can limit deal execution. Rising interest-rate levels directly pressure net income through higher financing costs. Debt covenants in existing facilities may restrict strategic flexibility. Latest company-level figures are not publicly verifiable for 2024–2025.
Exposure to operational bottlenecks
Port congestion, storage limits and transport disruptions impair Sadot Group service levels, with execution failures exposing the firm to penalties and direct losses; insufficient redundancy in warehousing and transport networks elevates operational risk and can cascade into missed SLAs, while repeated delays erode customer trust and contract renewals.
Concentration in core commodities
Reliance on grains and staple foods concentrates Sadot Group's market exposure, making revenues sensitive to single-commodity cycles. Adverse harvests or export policy shifts in key origins can quickly ripple through margins and volumes. Limited product diversification reduces pricing power and constrains cross-cycle resilience.
- Concentration risk
- Supply-origin vulnerability
- Weak pricing leverage
- Low cyclical hedging
Scale versus majors
Global agribusiness giants (top four control ~70% of global grain trade) have deeper capital, larger fleets and origination networks, enabling lower unit costs and higher capacity; Cargill reported roughly $165B revenue in 2023, illustrating scale gaps. Supplier access and freight terms often favor these players, and Sadot Group may struggle with brand recognition in new markets.
- Scale concentration: top4 ~70% global grain trade
- Capital gap: Cargill ~$165B revenue (2023)
- Competitive pressure: price & capacity disadvantage
- Supply/freight terms and brand recognition risks
Sub-3% margins and capital-heavy grain trading squeezed by top-four global dominance
Thin sub-3% trading margins, high working-capital intensity and logistics bottlenecks compress profitability and limit growth; concentration in grains exposes Sadot Group to single-commodity cycles while top-four players control ~70% of global grain trade, creating scale and freight-cost disadvantages (Cargill revenue ~$165B in 2023).
| Metric | Value | Source |
|---|---|---|
| Trading margins | <3% | Industry |
| Top-4 market share | ~70% | Industry |
| Cargill revenue | $165B (2023) | Company filings |
Preview the Actual Deliverable
Sadot Group SWOT Analysis
This is the actual SWOT analysis of Sadot Group you’ll receive upon purchase—no surprises, just professional quality. The preview below is taken directly from the full SWOT report you'll get; purchase unlocks the complete, editable version. You’re viewing a live preview of the real file—buy now to access the full, detailed report.











