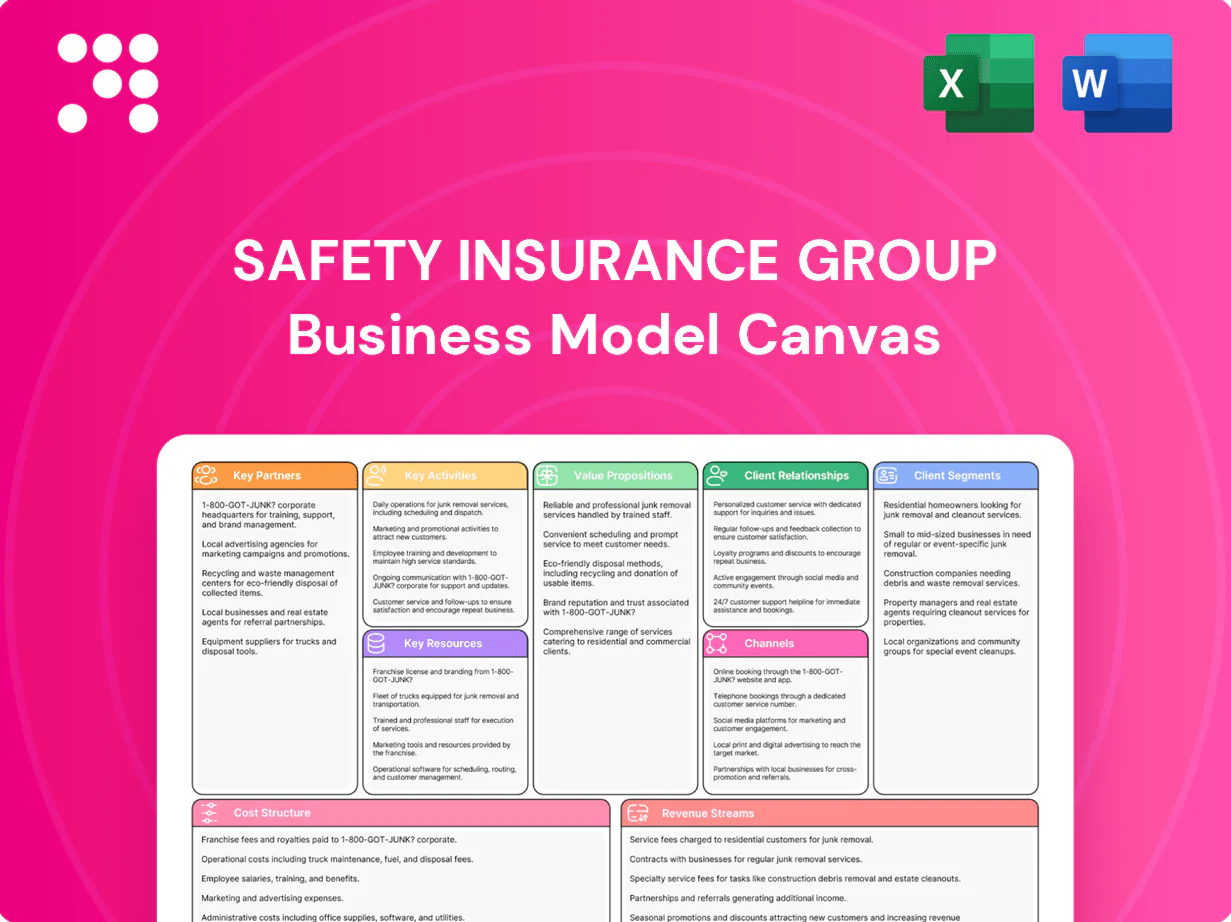
Safety Insurance Group Business Model Canvas

Business Model Canvas: 5 Strategic Insights for Insurance Investors and Founders
Unlock the full strategic blueprint behind Safety Insurance Group with our Business Model Canvas—three to five concise, company-specific insights into value propositions, customer segments, and revenue streams. Ideal for investors, analysts, and founders seeking actionable strategy. Download the complete Word & Excel canvas to benchmark, adapt, and execute with confidence.
Partnerships

Independent agents
Independent agents are the exclusive distribution partners for Safety Insurance Group across MA, NH, and ME in 2024, originating, advising and servicing both personal and commercial lines. Their local relationships drive market penetration and retention, supporting regional growth. Ongoing incentive alignment and targeted training programs ensure higher-quality submissions and increased cross-sell.
Reinsurance providers
Catastrophe and excess-of-loss reinsurers supply capital protection, with industry insured catastrophe losses at about $110 billion in 2023 per Aon, underscoring need for cover. Programs stabilize earnings and expand underwriting capacity, while partner selection prioritizes A.M. Best A/A+ strength and proven claims responsiveness. Terms and attachment points shift with cat exposure and reinsurance market cycles; rate-on-line moved ~15–25% in 2023–24.

Auto repair networks
Preferred body shops and glass vendors accelerate claims repairs, with industry reports in 2024 showing preferred-network repairs can cut cycle time by about 25%. Direct billing and quality guarantees reduce leakage and lower out-of-pocket costs, improving repair audit outcomes. Partnerships boost post-accident customer satisfaction and loyalty. Repair data flows into pricing models and fraud-detection systems, sharpening loss estimates and reserving.

Data & tech vendors
Data and tech vendors supply telematics, credit, and geospatial feeds that refine underwriting and risk selection; claims analytics platforms accelerate triage and subrogation while core system partners underpin policy, billing, and claims workflows; cybersecurity and cloud providers deliver resilience, regulatory compliance, and secure data handling.
- telematics: enriched risk scoring
- claims analytics: faster triage/subrogation
- core systems: policy/billing/claims
- cyber/cloud: resilience & compliance
Regulators & industry bodies
Collaboration with 51 state insurance departments ensures regulatory compliance and licensing across jurisdictions; engagement with ISO and AAIS—serving over 1,200 insurers—provides rating content and standardized forms; industry associations share loss trends and best practices; participation supports advocacy and catastrophe preparedness amid rising annual insured catastrophe losses.
- Regulators: 51 state departments
- ISO/AAIS: >1,200 insurer clients
- Associations: loss-trend sharing
- Focus: advocacy & catastrophe readiness
Agents, tech & reinsurers cut claims cycles ~25%, stabilize after $110B losses
Independent agents (exclusive in MA/NH/ME in 2024) drive origination, retention and cross-sell; preferred-repair networks cut cycle time ~25% and boost satisfaction. Reinsurers (A.M. Best A/A+) stabilize capacity as global insured catastrophe losses were ~$110B in 2023; rate-on-line moved ~15–25% in 2023–24. Data/tech vendors improve underwriting, claims triage and fraud detection.
| Partner | Role | Key metric | 2024 |
|---|---|---|---|
| Independent agents | Distribution | Exclusive markets | MA/NH/ME |
| Reinsurers | Capital protection | Rate-on-line change | 15–25% |
| Repair vendors | Claims speed | Cycle reduction | ~25% |
| Data/tech | Underwriting/claims | Catastrophe data | $110B (2023) |
What is included in the product
 Detailed Word Document
A comprehensive Business Model Canvas for Safety Insurance Group outlining customer segments, channels, value propositions, revenue streams and cost structure across the 9 BMC blocks, reflecting real-world operations and strategic plans. Ideal for investors and analysts, it includes competitive advantages, SWOT-linked insights and polished narratives to support presentations and decision-making.

 Customizable Excel Spreadsheet
Condenses Safety Insurance Group’s strategy into a digestible one-page canvas with editable cells to quickly identify value propositions, distribution channels, and cost drivers — ideal for boardrooms, teams, and fast decision-making.
Activities

Underwriting & pricing
Risk selection, rating, and policy issuance are core underwriting activities at Safety Insurance Group as of 2024, driving portfolio composition and exposure limits. Pricing models incorporate territory, driver, property, and business exposures to set actuarially sound premiums. Governance defines authority matrices and referral thresholds to control underwriting risk. Continuous monitoring and monthly loss-ratio reviews calibrate pricing and profitability.
Claims management
First notice of loss, timely investigation, and efficient settlement drive claim outcomes by minimizing indemnity and expense cycles; preferred vendor networks and active subrogation programs reduce claim severity and recover costs. Robust fraud detection and litigation management protect underwriting margins and limit loss development. Predefined catastrophe response plans enable rapid adjuster surge and resource allocation during peak events.

Distribution enablement
Agent onboarding, training, and quoting support drive growth by reducing time-to-bind and increasing retention; independent agents account for about 70% of U.S. personal-line distribution (NAIC 2024). Co-op marketing and lead sharing lift conversion rates and lower acquisition cost. Portal and API tools streamline submissions and endorsements, cutting processing time and errors. Performance dashboards provide KPIs for targeted agency optimization.

Risk & capital management
Risk and capital management centers on reinsurance placement and capital allocation to balance risk/return, with 2024 programs favoring quota share and excess-of-loss layers to protect surplus. Investment portfolios manage float with prudent duration and high-investment-grade credit, while scenario testing captures catastrophe, inflation, and evolving legal trends. An ERM framework governs solvency metrics and rating agency requirements to sustain capital strength.
- 2024: reinsurance mix—quota share + XL
- Investments—short-to-intermediate duration, IG credit
- Scenario testing—cat, inflation, legal
- ERM—solvency, ratings focus
Product & compliance
Product and compliance ensure filings and rate changes strictly align with state regulation, with product updates driven by observed loss experience and market demand. Telematics programs and targeted discounts enable finer segmentation and improved retention while audit controls preserve regulatory and financial integrity. All changes are governed by documented control frameworks and regulatory filings.
- Form filings: regulatory-aligned
- Product updates: loss-driven
- Telematics: segmentation & retention
- Audits: compliance & financial controls
Precision underwriting, rapid FNOL claims, agent-led distribution, quota-share and XL reinsurance
Underwriting focuses on risk selection, rating, policy issuance and monthly loss-ratio calibration. Claims emphasize FNOL rapidity, investigation, vendor networks and active subrogation to limit severity. Distribution relies on agent onboarding/portals; independent agents ~70% (NAIC 2024). Capital management uses quota-share + XL reinsurance and short-to-intermediate IG investments.
| Metric | 2024 |
|---|---|
| Independent agent share | ~70% (NAIC) |
| Reinsurance mix | Quota share + XL |
| Investments | Short–intermediate duration, IG |
Full Document Unlocks After Purchase
Business Model Canvas
The document you're previewing is the actual Safety Insurance Group Business Model Canvas, not a mockup or summary. When you purchase, you’ll receive this exact file with all sections, formatting, and content intact. The deliverable comes ready to edit, present, or export in Word and Excel. No surprises—what you see is what you’ll download.

Business Model Canvas: 5 Strategic Insights for Insurance Investors and Founders
Unlock the full strategic blueprint behind Safety Insurance Group with our Business Model Canvas—three to five concise, company-specific insights into value propositions, customer segments, and revenue streams. Ideal for investors, analysts, and founders seeking actionable strategy. Download the complete Word & Excel canvas to benchmark, adapt, and execute with confidence.
Partnerships
Independent agents
Independent agents are the exclusive distribution partners for Safety Insurance Group across MA, NH, and ME in 2024, originating, advising and servicing both personal and commercial lines. Their local relationships drive market penetration and retention, supporting regional growth. Ongoing incentive alignment and targeted training programs ensure higher-quality submissions and increased cross-sell.
Reinsurance providers
Catastrophe and excess-of-loss reinsurers supply capital protection, with industry insured catastrophe losses at about $110 billion in 2023 per Aon, underscoring need for cover. Programs stabilize earnings and expand underwriting capacity, while partner selection prioritizes A.M. Best A/A+ strength and proven claims responsiveness. Terms and attachment points shift with cat exposure and reinsurance market cycles; rate-on-line moved ~15–25% in 2023–24.
Auto repair networks
Preferred body shops and glass vendors accelerate claims repairs, with industry reports in 2024 showing preferred-network repairs can cut cycle time by about 25%. Direct billing and quality guarantees reduce leakage and lower out-of-pocket costs, improving repair audit outcomes. Partnerships boost post-accident customer satisfaction and loyalty. Repair data flows into pricing models and fraud-detection systems, sharpening loss estimates and reserving.
Data & tech vendors
Data and tech vendors supply telematics, credit, and geospatial feeds that refine underwriting and risk selection; claims analytics platforms accelerate triage and subrogation while core system partners underpin policy, billing, and claims workflows; cybersecurity and cloud providers deliver resilience, regulatory compliance, and secure data handling.
- telematics: enriched risk scoring
- claims analytics: faster triage/subrogation
- core systems: policy/billing/claims
- cyber/cloud: resilience & compliance
Regulators & industry bodies
Collaboration with 51 state insurance departments ensures regulatory compliance and licensing across jurisdictions; engagement with ISO and AAIS—serving over 1,200 insurers—provides rating content and standardized forms; industry associations share loss trends and best practices; participation supports advocacy and catastrophe preparedness amid rising annual insured catastrophe losses.
- Regulators: 51 state departments
- ISO/AAIS: >1,200 insurer clients
- Associations: loss-trend sharing
- Focus: advocacy & catastrophe readiness
Agents, tech & reinsurers cut claims cycles ~25%, stabilize after $110B losses
Independent agents (exclusive in MA/NH/ME in 2024) drive origination, retention and cross-sell; preferred-repair networks cut cycle time ~25% and boost satisfaction. Reinsurers (A.M. Best A/A+) stabilize capacity as global insured catastrophe losses were ~$110B in 2023; rate-on-line moved ~15–25% in 2023–24. Data/tech vendors improve underwriting, claims triage and fraud detection.
| Partner | Role | Key metric | 2024 |
|---|---|---|---|
| Independent agents | Distribution | Exclusive markets | MA/NH/ME |
| Reinsurers | Capital protection | Rate-on-line change | 15–25% |
| Repair vendors | Claims speed | Cycle reduction | ~25% |
| Data/tech | Underwriting/claims | Catastrophe data | $110B (2023) |
What is included in the product
Detailed Word Document
A comprehensive Business Model Canvas for Safety Insurance Group outlining customer segments, channels, value propositions, revenue streams and cost structure across the 9 BMC blocks, reflecting real-world operations and strategic plans. Ideal for investors and analysts, it includes competitive advantages, SWOT-linked insights and polished narratives to support presentations and decision-making.
Customizable Excel Spreadsheet
Condenses Safety Insurance Group’s strategy into a digestible one-page canvas with editable cells to quickly identify value propositions, distribution channels, and cost drivers — ideal for boardrooms, teams, and fast decision-making.
Activities
Underwriting & pricing
Risk selection, rating, and policy issuance are core underwriting activities at Safety Insurance Group as of 2024, driving portfolio composition and exposure limits. Pricing models incorporate territory, driver, property, and business exposures to set actuarially sound premiums. Governance defines authority matrices and referral thresholds to control underwriting risk. Continuous monitoring and monthly loss-ratio reviews calibrate pricing and profitability.
Claims management
First notice of loss, timely investigation, and efficient settlement drive claim outcomes by minimizing indemnity and expense cycles; preferred vendor networks and active subrogation programs reduce claim severity and recover costs. Robust fraud detection and litigation management protect underwriting margins and limit loss development. Predefined catastrophe response plans enable rapid adjuster surge and resource allocation during peak events.
Distribution enablement
Agent onboarding, training, and quoting support drive growth by reducing time-to-bind and increasing retention; independent agents account for about 70% of U.S. personal-line distribution (NAIC 2024). Co-op marketing and lead sharing lift conversion rates and lower acquisition cost. Portal and API tools streamline submissions and endorsements, cutting processing time and errors. Performance dashboards provide KPIs for targeted agency optimization.
Risk & capital management
Risk and capital management centers on reinsurance placement and capital allocation to balance risk/return, with 2024 programs favoring quota share and excess-of-loss layers to protect surplus. Investment portfolios manage float with prudent duration and high-investment-grade credit, while scenario testing captures catastrophe, inflation, and evolving legal trends. An ERM framework governs solvency metrics and rating agency requirements to sustain capital strength.
- 2024: reinsurance mix—quota share + XL
- Investments—short-to-intermediate duration, IG credit
- Scenario testing—cat, inflation, legal
- ERM—solvency, ratings focus
Product & compliance
Product and compliance ensure filings and rate changes strictly align with state regulation, with product updates driven by observed loss experience and market demand. Telematics programs and targeted discounts enable finer segmentation and improved retention while audit controls preserve regulatory and financial integrity. All changes are governed by documented control frameworks and regulatory filings.
- Form filings: regulatory-aligned
- Product updates: loss-driven
- Telematics: segmentation & retention
- Audits: compliance & financial controls
Precision underwriting, rapid FNOL claims, agent-led distribution, quota-share and XL reinsurance
Underwriting focuses on risk selection, rating, policy issuance and monthly loss-ratio calibration. Claims emphasize FNOL rapidity, investigation, vendor networks and active subrogation to limit severity. Distribution relies on agent onboarding/portals; independent agents ~70% (NAIC 2024). Capital management uses quota-share + XL reinsurance and short-to-intermediate IG investments.
| Metric | 2024 |
|---|---|
| Independent agent share | ~70% (NAIC) |
| Reinsurance mix | Quota share + XL |
| Investments | Short–intermediate duration, IG |
Full Document Unlocks After Purchase
Business Model Canvas
The document you're previewing is the actual Safety Insurance Group Business Model Canvas, not a mockup or summary. When you purchase, you’ll receive this exact file with all sections, formatting, and content intact. The deliverable comes ready to edit, present, or export in Word and Excel. No surprises—what you see is what you’ll download.
Original: $10.00
-65%$10.00
$3.50Description
Business Model Canvas: 5 Strategic Insights for Insurance Investors and Founders
Unlock the full strategic blueprint behind Safety Insurance Group with our Business Model Canvas—three to five concise, company-specific insights into value propositions, customer segments, and revenue streams. Ideal for investors, analysts, and founders seeking actionable strategy. Download the complete Word & Excel canvas to benchmark, adapt, and execute with confidence.
Partnerships
Independent agents
Independent agents are the exclusive distribution partners for Safety Insurance Group across MA, NH, and ME in 2024, originating, advising and servicing both personal and commercial lines. Their local relationships drive market penetration and retention, supporting regional growth. Ongoing incentive alignment and targeted training programs ensure higher-quality submissions and increased cross-sell.
Reinsurance providers
Catastrophe and excess-of-loss reinsurers supply capital protection, with industry insured catastrophe losses at about $110 billion in 2023 per Aon, underscoring need for cover. Programs stabilize earnings and expand underwriting capacity, while partner selection prioritizes A.M. Best A/A+ strength and proven claims responsiveness. Terms and attachment points shift with cat exposure and reinsurance market cycles; rate-on-line moved ~15–25% in 2023–24.
Auto repair networks
Preferred body shops and glass vendors accelerate claims repairs, with industry reports in 2024 showing preferred-network repairs can cut cycle time by about 25%. Direct billing and quality guarantees reduce leakage and lower out-of-pocket costs, improving repair audit outcomes. Partnerships boost post-accident customer satisfaction and loyalty. Repair data flows into pricing models and fraud-detection systems, sharpening loss estimates and reserving.
Data & tech vendors
Data and tech vendors supply telematics, credit, and geospatial feeds that refine underwriting and risk selection; claims analytics platforms accelerate triage and subrogation while core system partners underpin policy, billing, and claims workflows; cybersecurity and cloud providers deliver resilience, regulatory compliance, and secure data handling.
- telematics: enriched risk scoring
- claims analytics: faster triage/subrogation
- core systems: policy/billing/claims
- cyber/cloud: resilience & compliance
Regulators & industry bodies
Collaboration with 51 state insurance departments ensures regulatory compliance and licensing across jurisdictions; engagement with ISO and AAIS—serving over 1,200 insurers—provides rating content and standardized forms; industry associations share loss trends and best practices; participation supports advocacy and catastrophe preparedness amid rising annual insured catastrophe losses.
- Regulators: 51 state departments
- ISO/AAIS: >1,200 insurer clients
- Associations: loss-trend sharing
- Focus: advocacy & catastrophe readiness
Agents, tech & reinsurers cut claims cycles ~25%, stabilize after $110B losses
Independent agents (exclusive in MA/NH/ME in 2024) drive origination, retention and cross-sell; preferred-repair networks cut cycle time ~25% and boost satisfaction. Reinsurers (A.M. Best A/A+) stabilize capacity as global insured catastrophe losses were ~$110B in 2023; rate-on-line moved ~15–25% in 2023–24. Data/tech vendors improve underwriting, claims triage and fraud detection.
| Partner | Role | Key metric | 2024 |
|---|---|---|---|
| Independent agents | Distribution | Exclusive markets | MA/NH/ME |
| Reinsurers | Capital protection | Rate-on-line change | 15–25% |
| Repair vendors | Claims speed | Cycle reduction | ~25% |
| Data/tech | Underwriting/claims | Catastrophe data | $110B (2023) |
What is included in the product
Detailed Word Document
A comprehensive Business Model Canvas for Safety Insurance Group outlining customer segments, channels, value propositions, revenue streams and cost structure across the 9 BMC blocks, reflecting real-world operations and strategic plans. Ideal for investors and analysts, it includes competitive advantages, SWOT-linked insights and polished narratives to support presentations and decision-making.
Customizable Excel Spreadsheet
Condenses Safety Insurance Group’s strategy into a digestible one-page canvas with editable cells to quickly identify value propositions, distribution channels, and cost drivers — ideal for boardrooms, teams, and fast decision-making.
Activities
Underwriting & pricing
Risk selection, rating, and policy issuance are core underwriting activities at Safety Insurance Group as of 2024, driving portfolio composition and exposure limits. Pricing models incorporate territory, driver, property, and business exposures to set actuarially sound premiums. Governance defines authority matrices and referral thresholds to control underwriting risk. Continuous monitoring and monthly loss-ratio reviews calibrate pricing and profitability.
Claims management
First notice of loss, timely investigation, and efficient settlement drive claim outcomes by minimizing indemnity and expense cycles; preferred vendor networks and active subrogation programs reduce claim severity and recover costs. Robust fraud detection and litigation management protect underwriting margins and limit loss development. Predefined catastrophe response plans enable rapid adjuster surge and resource allocation during peak events.
Distribution enablement
Agent onboarding, training, and quoting support drive growth by reducing time-to-bind and increasing retention; independent agents account for about 70% of U.S. personal-line distribution (NAIC 2024). Co-op marketing and lead sharing lift conversion rates and lower acquisition cost. Portal and API tools streamline submissions and endorsements, cutting processing time and errors. Performance dashboards provide KPIs for targeted agency optimization.
Risk & capital management
Risk and capital management centers on reinsurance placement and capital allocation to balance risk/return, with 2024 programs favoring quota share and excess-of-loss layers to protect surplus. Investment portfolios manage float with prudent duration and high-investment-grade credit, while scenario testing captures catastrophe, inflation, and evolving legal trends. An ERM framework governs solvency metrics and rating agency requirements to sustain capital strength.
- 2024: reinsurance mix—quota share + XL
- Investments—short-to-intermediate duration, IG credit
- Scenario testing—cat, inflation, legal
- ERM—solvency, ratings focus
Product & compliance
Product and compliance ensure filings and rate changes strictly align with state regulation, with product updates driven by observed loss experience and market demand. Telematics programs and targeted discounts enable finer segmentation and improved retention while audit controls preserve regulatory and financial integrity. All changes are governed by documented control frameworks and regulatory filings.
- Form filings: regulatory-aligned
- Product updates: loss-driven
- Telematics: segmentation & retention
- Audits: compliance & financial controls
Precision underwriting, rapid FNOL claims, agent-led distribution, quota-share and XL reinsurance
Underwriting focuses on risk selection, rating, policy issuance and monthly loss-ratio calibration. Claims emphasize FNOL rapidity, investigation, vendor networks and active subrogation to limit severity. Distribution relies on agent onboarding/portals; independent agents ~70% (NAIC 2024). Capital management uses quota-share + XL reinsurance and short-to-intermediate IG investments.
| Metric | 2024 |
|---|---|
| Independent agent share | ~70% (NAIC) |
| Reinsurance mix | Quota share + XL |
| Investments | Short–intermediate duration, IG |
Full Document Unlocks After Purchase
Business Model Canvas
The document you're previewing is the actual Safety Insurance Group Business Model Canvas, not a mockup or summary. When you purchase, you’ll receive this exact file with all sections, formatting, and content intact. The deliverable comes ready to edit, present, or export in Word and Excel. No surprises—what you see is what you’ll download.











