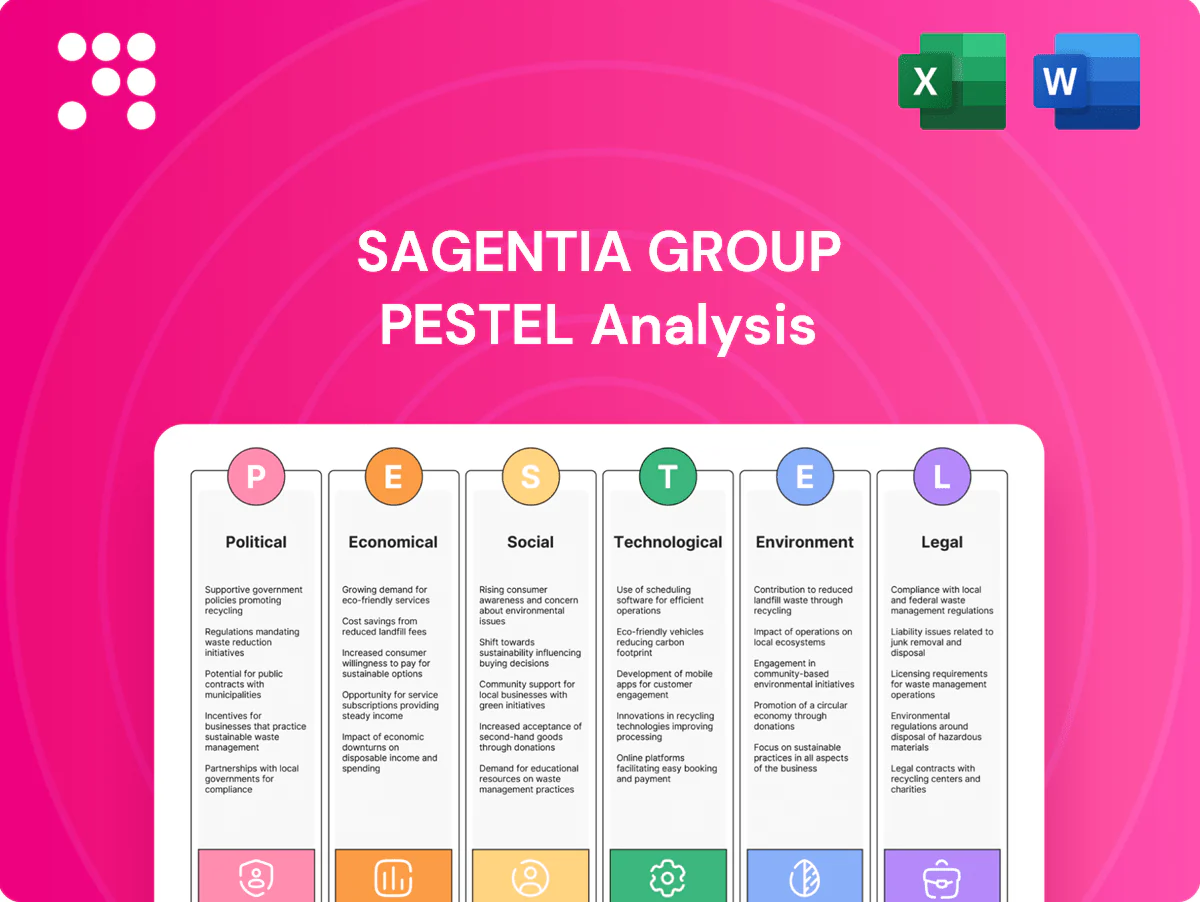
Sagentia Group PESTLE Analysis

Make Smarter Strategic Decisions with a Complete PESTEL View
Unlock how political shifts, economic cycles, and rapid technological change are shaping Sagentia Group’s strategic outlook with our concise PESTLE snapshot—perfect for investors and strategists who need actionable context fast. Buy the full PESTLE analysis to access detailed risks, opportunities, and ready-to-use recommendations.
Political factors

Healthcare policy shifts
Changes in FDA, EMA and NHS policies — notably EU MDR effective 26 May 2021 and IVDR effective 26 May 2022 — are raising evidence thresholds and shifting development timelines, forcing Sagentia Innovation to tighten design controls and clinical strategies rapidly; proactive horizon scanning and modular architectures cut rework, while stability in priority markets determines portfolio allocation.
Government R&D funding priorities
Public grants in medtech, sustainability and advanced manufacturing—driven in the UK by the government R&D target of 2.4% of GDP by 2027 and delivery via agencies such as Innovate UK—can catalyze client projects; aligning bids to national missions measurably improves pipeline and bid success. Sagentia Innovation can co-develop proposals to de-risk early-stage work, while funding cycles and eligibility rules dictate staffing and capability roadmaps.

Trade policy and market access
Tariffs (global applied MFN average ~2.8% per WTO) and local content rules plus mutual recognition agreements reshape BOMs and certification routes, raising compliance costs and part qualification timelines. Multi-region strategies force variant designs and regulatory planning across markets. Sagentia Innovation mitigates risk by designing for supply optionality and standards convergence. Nearshoring—spurred by policies like the US CHIPS Act ($52B)—reshapes partner ecosystems.

Geopolitical risk and supply security
Geopolitical conflict and sanctions have repeatedly disrupted components, semiconductors, and specialty materials, prompting clients to adopt resilience-by-design and multi-sourcing; US CHIPS Act funding of $52 billion (2022) and rising onshoring incentives in 2024 accelerate this shift. Sagentia Innovation models risk and redesigns for alternative platforms while scenario planning guides go-to-market sequencing.
- Supply shocks: concentrate risk in key hubs
- Resilience: resilience-by-design, multi-sourcing
- Capability: Sagentia models alternative platforms
- Strategy: scenario-driven GTM sequencing
Public procurement and health system agendas
Central purchasing bodies increasingly prioritize value-based outcomes and sustainability, with EU public procurement representing about 14% of EU GDP (~€2.1 trillion) per the European Commission; winning tenders requires demonstrable clinical-economic value and complete compliance artifacts. Sagentia Innovation supports evidence generation and tender documentation, while regional variations demand tailored messaging and configurable features.
- Value-based outcomes
- Clinical-economic evidence
- Compliance artifacts
- Sagentia: evidence & tenders
- Regional tailoring
MDR/IVDR and UK R&D targets plus US CHIPS push medtech nearshoring and tighter design controls
Regulatory tightening (EU MDR 26-May-2021, IVDR 26-May-2022) raises evidence thresholds and lengthens time-to-market, forcing tighter design controls and modular approaches. Public R&D incentives (UK 2.4% GDP target by 2027; Innovate UK) and grants boost medtech projects but require aligned bids. Trade rules (WTO MFN avg ~2.8%) and onshoring incentives (US CHIPS $52B) drive supply diversification and nearshoring.
| Metric | Value |
|---|---|
| EU public procurement | ~14% GDP (~€2.1tn) |
| WTO MFN avg | ~2.8% |
| US CHIPS funding | $52B (2022) |
What is included in the product
 Detailed Word Document
Explores how Political, Economic, Social, Technological, Environmental and Legal forces uniquely affect Sagentia Group, with data-backed trends and region- and sector-specific examples to surface risks and opportunities.

 Customizable Excel Spreadsheet
Clean, visually segmented PESTLE summary for Sagentia Group that’s editable for region or business-line notes, drop-in ready for presentations and easily shared across teams—streamlining external risk discussions and client-facing reports.
Economic factors

R&D budget cyclicality
Macroeconomic slowdowns compress client innovation spend and shift budgets toward ROI-fast projects; global R&D investment exceeded roughly $2.5 trillion in 2021–22, but firms often tighten discretionary innovation in downturns. Sagentia Innovation can emphasize cost-out, line extensions and platform reuse to deliver faster payback. In upcycles demand tilts to breakthrough programs and higher-risk R&D. Flexible resourcing models help protect margins across these cycles.
Inflation and input costs
Wage growth in the UK averaged about 6% in 2024 (ONS), while global manufacturing input inflation ran near 5.5% in 2024 (World Bank commodity and input indices), squeezing project profitability for Sagentia Group through higher wages, components and lab consumables. Index-linked pricing and stage-gate risk sharing can hedge client exposure. Design-to-cost and value engineering become core differentiators, and supplier framework agreements help stabilize critical inputs and reduce volatility.

Currency fluctuations
Multi-currency revenues and costs expose Sagentia Group earnings to FX volatility across USD, EUR and GBP, with BIS reporting near-term FX volatility in major pairs averaging around 10% in 2023–24. Regional delivery and matching costs to revenues provide natural hedges that materially reduce translation risk. Transparent FX clauses in client contracts maintain trust and price pass-through. A USD/EUR/GBP portfolio mix helps balance net exposure.

Client consolidation and VC flows
Client consolidation via M&A across medtech, CPG and industrials is shifting decision centers and reshaping product pipelines; global deal activity remained elevated after 2022–2023 consolidation waves. Venture funding cycles—down roughly 50% from 2021 peaks to about $200bn annually by 2023—tighten startup demand for end-to-end development, increasing reliance on external partners. Sagentia Innovation is expanding key-account services and venture-focused offerings, with diligence and technical commercial due diligence emerging as a growing revenue stream.
- Impact: consolidated buying centers, longer pipeline approval
- VC trend: leaner funding, higher demand for development partners
- Sagentia response: key-account growth, venture services, paid diligence
Productivity and time-to-market pressure
Shorter payback horizons—commonly under 24 months in medical devices and industrial IoT in 2024—drive aggressive timelines and milestone payments. Toolchains that compress verification and transfer-to-manufacture win business, with leading firms reporting 20–30% faster launch cycles. Sagentia Innovation leverages concurrent engineering and digital twins to shorten cycles and boost repeat engagements and client retention.
- Payback horizon: under 24 months (2024)
- Faster launch: 20–30% time-to-market reduction
- Sagentia methods: concurrent engineering + digital twins
- Outcome: stronger repeat engagements and retention
MDR/IVDR and UK R&D targets plus US CHIPS push medtech nearshoring and tighter design controls
Macroeconomic slowdowns compress client innovation spend despite global R&D near $2.6T (2021–24), shifting demand to faster-payback projects. UK wage growth ~6% (2024) and input inflation ~5.5% (2024) squeeze margins; design-to-cost and index-linked pricing mitigate risk. FX volatility (~10% in 2023–24) and leaner VC ($200B 2023) boost demand for flexible, account-led services.
| Metric | 2024/25 |
|---|---|
| Global R&D | $2.6T |
| UK wage growth | 6% |
| Input inflation | 5.5% |
| FX volatility | ~10% |
| VC funding | $200B (2023) |
What You See Is What You Get
Sagentia Group PESTLE Analysis
The Sagentia Group PESTLE Analysis shown here is the exact document you’ll receive after purchase—fully formatted and ready to use. This preview displays the real file content, structure, and visuals you’ll download immediately after checkout. No placeholders or teasers: the insights and sections you see are the final deliverable. Use it straight away for strategic planning, research, or presentations.

Make Smarter Strategic Decisions with a Complete PESTEL View
Unlock how political shifts, economic cycles, and rapid technological change are shaping Sagentia Group’s strategic outlook with our concise PESTLE snapshot—perfect for investors and strategists who need actionable context fast. Buy the full PESTLE analysis to access detailed risks, opportunities, and ready-to-use recommendations.
Political factors
Healthcare policy shifts
Changes in FDA, EMA and NHS policies — notably EU MDR effective 26 May 2021 and IVDR effective 26 May 2022 — are raising evidence thresholds and shifting development timelines, forcing Sagentia Innovation to tighten design controls and clinical strategies rapidly; proactive horizon scanning and modular architectures cut rework, while stability in priority markets determines portfolio allocation.
Government R&D funding priorities
Public grants in medtech, sustainability and advanced manufacturing—driven in the UK by the government R&D target of 2.4% of GDP by 2027 and delivery via agencies such as Innovate UK—can catalyze client projects; aligning bids to national missions measurably improves pipeline and bid success. Sagentia Innovation can co-develop proposals to de-risk early-stage work, while funding cycles and eligibility rules dictate staffing and capability roadmaps.
Trade policy and market access
Tariffs (global applied MFN average ~2.8% per WTO) and local content rules plus mutual recognition agreements reshape BOMs and certification routes, raising compliance costs and part qualification timelines. Multi-region strategies force variant designs and regulatory planning across markets. Sagentia Innovation mitigates risk by designing for supply optionality and standards convergence. Nearshoring—spurred by policies like the US CHIPS Act ($52B)—reshapes partner ecosystems.
Geopolitical risk and supply security
Geopolitical conflict and sanctions have repeatedly disrupted components, semiconductors, and specialty materials, prompting clients to adopt resilience-by-design and multi-sourcing; US CHIPS Act funding of $52 billion (2022) and rising onshoring incentives in 2024 accelerate this shift. Sagentia Innovation models risk and redesigns for alternative platforms while scenario planning guides go-to-market sequencing.
- Supply shocks: concentrate risk in key hubs
- Resilience: resilience-by-design, multi-sourcing
- Capability: Sagentia models alternative platforms
- Strategy: scenario-driven GTM sequencing
Public procurement and health system agendas
Central purchasing bodies increasingly prioritize value-based outcomes and sustainability, with EU public procurement representing about 14% of EU GDP (~€2.1 trillion) per the European Commission; winning tenders requires demonstrable clinical-economic value and complete compliance artifacts. Sagentia Innovation supports evidence generation and tender documentation, while regional variations demand tailored messaging and configurable features.
- Value-based outcomes
- Clinical-economic evidence
- Compliance artifacts
- Sagentia: evidence & tenders
- Regional tailoring
MDR/IVDR and UK R&D targets plus US CHIPS push medtech nearshoring and tighter design controls
Regulatory tightening (EU MDR 26-May-2021, IVDR 26-May-2022) raises evidence thresholds and lengthens time-to-market, forcing tighter design controls and modular approaches. Public R&D incentives (UK 2.4% GDP target by 2027; Innovate UK) and grants boost medtech projects but require aligned bids. Trade rules (WTO MFN avg ~2.8%) and onshoring incentives (US CHIPS $52B) drive supply diversification and nearshoring.
| Metric | Value |
|---|---|
| EU public procurement | ~14% GDP (~€2.1tn) |
| WTO MFN avg | ~2.8% |
| US CHIPS funding | $52B (2022) |
What is included in the product
Detailed Word Document
Explores how Political, Economic, Social, Technological, Environmental and Legal forces uniquely affect Sagentia Group, with data-backed trends and region- and sector-specific examples to surface risks and opportunities.
Customizable Excel Spreadsheet
Clean, visually segmented PESTLE summary for Sagentia Group that’s editable for region or business-line notes, drop-in ready for presentations and easily shared across teams—streamlining external risk discussions and client-facing reports.
Economic factors
R&D budget cyclicality
Macroeconomic slowdowns compress client innovation spend and shift budgets toward ROI-fast projects; global R&D investment exceeded roughly $2.5 trillion in 2021–22, but firms often tighten discretionary innovation in downturns. Sagentia Innovation can emphasize cost-out, line extensions and platform reuse to deliver faster payback. In upcycles demand tilts to breakthrough programs and higher-risk R&D. Flexible resourcing models help protect margins across these cycles.
Inflation and input costs
Wage growth in the UK averaged about 6% in 2024 (ONS), while global manufacturing input inflation ran near 5.5% in 2024 (World Bank commodity and input indices), squeezing project profitability for Sagentia Group through higher wages, components and lab consumables. Index-linked pricing and stage-gate risk sharing can hedge client exposure. Design-to-cost and value engineering become core differentiators, and supplier framework agreements help stabilize critical inputs and reduce volatility.
Currency fluctuations
Multi-currency revenues and costs expose Sagentia Group earnings to FX volatility across USD, EUR and GBP, with BIS reporting near-term FX volatility in major pairs averaging around 10% in 2023–24. Regional delivery and matching costs to revenues provide natural hedges that materially reduce translation risk. Transparent FX clauses in client contracts maintain trust and price pass-through. A USD/EUR/GBP portfolio mix helps balance net exposure.
Client consolidation and VC flows
Client consolidation via M&A across medtech, CPG and industrials is shifting decision centers and reshaping product pipelines; global deal activity remained elevated after 2022–2023 consolidation waves. Venture funding cycles—down roughly 50% from 2021 peaks to about $200bn annually by 2023—tighten startup demand for end-to-end development, increasing reliance on external partners. Sagentia Innovation is expanding key-account services and venture-focused offerings, with diligence and technical commercial due diligence emerging as a growing revenue stream.
- Impact: consolidated buying centers, longer pipeline approval
- VC trend: leaner funding, higher demand for development partners
- Sagentia response: key-account growth, venture services, paid diligence
Productivity and time-to-market pressure
Shorter payback horizons—commonly under 24 months in medical devices and industrial IoT in 2024—drive aggressive timelines and milestone payments. Toolchains that compress verification and transfer-to-manufacture win business, with leading firms reporting 20–30% faster launch cycles. Sagentia Innovation leverages concurrent engineering and digital twins to shorten cycles and boost repeat engagements and client retention.
- Payback horizon: under 24 months (2024)
- Faster launch: 20–30% time-to-market reduction
- Sagentia methods: concurrent engineering + digital twins
- Outcome: stronger repeat engagements and retention
MDR/IVDR and UK R&D targets plus US CHIPS push medtech nearshoring and tighter design controls
Macroeconomic slowdowns compress client innovation spend despite global R&D near $2.6T (2021–24), shifting demand to faster-payback projects. UK wage growth ~6% (2024) and input inflation ~5.5% (2024) squeeze margins; design-to-cost and index-linked pricing mitigate risk. FX volatility (~10% in 2023–24) and leaner VC ($200B 2023) boost demand for flexible, account-led services.
| Metric | 2024/25 |
|---|---|
| Global R&D | $2.6T |
| UK wage growth | 6% |
| Input inflation | 5.5% |
| FX volatility | ~10% |
| VC funding | $200B (2023) |
What You See Is What You Get
Sagentia Group PESTLE Analysis
The Sagentia Group PESTLE Analysis shown here is the exact document you’ll receive after purchase—fully formatted and ready to use. This preview displays the real file content, structure, and visuals you’ll download immediately after checkout. No placeholders or teasers: the insights and sections you see are the final deliverable. Use it straight away for strategic planning, research, or presentations.
Original: $10.00
-65%$10.00
$3.50Description
Make Smarter Strategic Decisions with a Complete PESTEL View
Unlock how political shifts, economic cycles, and rapid technological change are shaping Sagentia Group’s strategic outlook with our concise PESTLE snapshot—perfect for investors and strategists who need actionable context fast. Buy the full PESTLE analysis to access detailed risks, opportunities, and ready-to-use recommendations.
Political factors
Healthcare policy shifts
Changes in FDA, EMA and NHS policies — notably EU MDR effective 26 May 2021 and IVDR effective 26 May 2022 — are raising evidence thresholds and shifting development timelines, forcing Sagentia Innovation to tighten design controls and clinical strategies rapidly; proactive horizon scanning and modular architectures cut rework, while stability in priority markets determines portfolio allocation.
Government R&D funding priorities
Public grants in medtech, sustainability and advanced manufacturing—driven in the UK by the government R&D target of 2.4% of GDP by 2027 and delivery via agencies such as Innovate UK—can catalyze client projects; aligning bids to national missions measurably improves pipeline and bid success. Sagentia Innovation can co-develop proposals to de-risk early-stage work, while funding cycles and eligibility rules dictate staffing and capability roadmaps.
Trade policy and market access
Tariffs (global applied MFN average ~2.8% per WTO) and local content rules plus mutual recognition agreements reshape BOMs and certification routes, raising compliance costs and part qualification timelines. Multi-region strategies force variant designs and regulatory planning across markets. Sagentia Innovation mitigates risk by designing for supply optionality and standards convergence. Nearshoring—spurred by policies like the US CHIPS Act ($52B)—reshapes partner ecosystems.
Geopolitical risk and supply security
Geopolitical conflict and sanctions have repeatedly disrupted components, semiconductors, and specialty materials, prompting clients to adopt resilience-by-design and multi-sourcing; US CHIPS Act funding of $52 billion (2022) and rising onshoring incentives in 2024 accelerate this shift. Sagentia Innovation models risk and redesigns for alternative platforms while scenario planning guides go-to-market sequencing.
- Supply shocks: concentrate risk in key hubs
- Resilience: resilience-by-design, multi-sourcing
- Capability: Sagentia models alternative platforms
- Strategy: scenario-driven GTM sequencing
Public procurement and health system agendas
Central purchasing bodies increasingly prioritize value-based outcomes and sustainability, with EU public procurement representing about 14% of EU GDP (~€2.1 trillion) per the European Commission; winning tenders requires demonstrable clinical-economic value and complete compliance artifacts. Sagentia Innovation supports evidence generation and tender documentation, while regional variations demand tailored messaging and configurable features.
- Value-based outcomes
- Clinical-economic evidence
- Compliance artifacts
- Sagentia: evidence & tenders
- Regional tailoring
MDR/IVDR and UK R&D targets plus US CHIPS push medtech nearshoring and tighter design controls
Regulatory tightening (EU MDR 26-May-2021, IVDR 26-May-2022) raises evidence thresholds and lengthens time-to-market, forcing tighter design controls and modular approaches. Public R&D incentives (UK 2.4% GDP target by 2027; Innovate UK) and grants boost medtech projects but require aligned bids. Trade rules (WTO MFN avg ~2.8%) and onshoring incentives (US CHIPS $52B) drive supply diversification and nearshoring.
| Metric | Value |
|---|---|
| EU public procurement | ~14% GDP (~€2.1tn) |
| WTO MFN avg | ~2.8% |
| US CHIPS funding | $52B (2022) |
What is included in the product
Detailed Word Document
Explores how Political, Economic, Social, Technological, Environmental and Legal forces uniquely affect Sagentia Group, with data-backed trends and region- and sector-specific examples to surface risks and opportunities.
Customizable Excel Spreadsheet
Clean, visually segmented PESTLE summary for Sagentia Group that’s editable for region or business-line notes, drop-in ready for presentations and easily shared across teams—streamlining external risk discussions and client-facing reports.
Economic factors
R&D budget cyclicality
Macroeconomic slowdowns compress client innovation spend and shift budgets toward ROI-fast projects; global R&D investment exceeded roughly $2.5 trillion in 2021–22, but firms often tighten discretionary innovation in downturns. Sagentia Innovation can emphasize cost-out, line extensions and platform reuse to deliver faster payback. In upcycles demand tilts to breakthrough programs and higher-risk R&D. Flexible resourcing models help protect margins across these cycles.
Inflation and input costs
Wage growth in the UK averaged about 6% in 2024 (ONS), while global manufacturing input inflation ran near 5.5% in 2024 (World Bank commodity and input indices), squeezing project profitability for Sagentia Group through higher wages, components and lab consumables. Index-linked pricing and stage-gate risk sharing can hedge client exposure. Design-to-cost and value engineering become core differentiators, and supplier framework agreements help stabilize critical inputs and reduce volatility.
Currency fluctuations
Multi-currency revenues and costs expose Sagentia Group earnings to FX volatility across USD, EUR and GBP, with BIS reporting near-term FX volatility in major pairs averaging around 10% in 2023–24. Regional delivery and matching costs to revenues provide natural hedges that materially reduce translation risk. Transparent FX clauses in client contracts maintain trust and price pass-through. A USD/EUR/GBP portfolio mix helps balance net exposure.
Client consolidation and VC flows
Client consolidation via M&A across medtech, CPG and industrials is shifting decision centers and reshaping product pipelines; global deal activity remained elevated after 2022–2023 consolidation waves. Venture funding cycles—down roughly 50% from 2021 peaks to about $200bn annually by 2023—tighten startup demand for end-to-end development, increasing reliance on external partners. Sagentia Innovation is expanding key-account services and venture-focused offerings, with diligence and technical commercial due diligence emerging as a growing revenue stream.
- Impact: consolidated buying centers, longer pipeline approval
- VC trend: leaner funding, higher demand for development partners
- Sagentia response: key-account growth, venture services, paid diligence
Productivity and time-to-market pressure
Shorter payback horizons—commonly under 24 months in medical devices and industrial IoT in 2024—drive aggressive timelines and milestone payments. Toolchains that compress verification and transfer-to-manufacture win business, with leading firms reporting 20–30% faster launch cycles. Sagentia Innovation leverages concurrent engineering and digital twins to shorten cycles and boost repeat engagements and client retention.
- Payback horizon: under 24 months (2024)
- Faster launch: 20–30% time-to-market reduction
- Sagentia methods: concurrent engineering + digital twins
- Outcome: stronger repeat engagements and retention
MDR/IVDR and UK R&D targets plus US CHIPS push medtech nearshoring and tighter design controls
Macroeconomic slowdowns compress client innovation spend despite global R&D near $2.6T (2021–24), shifting demand to faster-payback projects. UK wage growth ~6% (2024) and input inflation ~5.5% (2024) squeeze margins; design-to-cost and index-linked pricing mitigate risk. FX volatility (~10% in 2023–24) and leaner VC ($200B 2023) boost demand for flexible, account-led services.
| Metric | 2024/25 |
|---|---|
| Global R&D | $2.6T |
| UK wage growth | 6% |
| Input inflation | 5.5% |
| FX volatility | ~10% |
| VC funding | $200B (2023) |
What You See Is What You Get
Sagentia Group PESTLE Analysis
The Sagentia Group PESTLE Analysis shown here is the exact document you’ll receive after purchase—fully formatted and ready to use. This preview displays the real file content, structure, and visuals you’ll download immediately after checkout. No placeholders or teasers: the insights and sections you see are the final deliverable. Use it straight away for strategic planning, research, or presentations.











