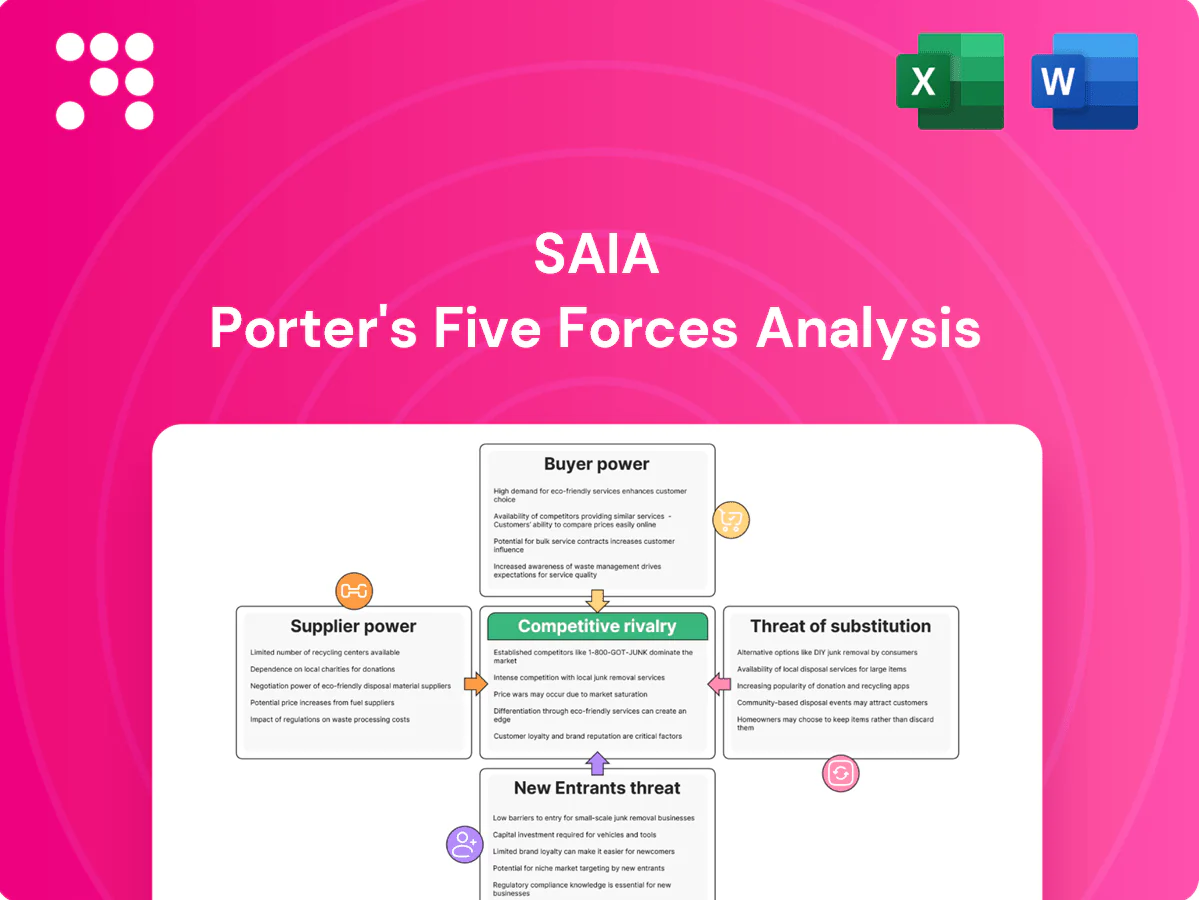
Saia Porter's Five Forces Analysis

A Must-Have Tool for Decision-Makers
Saia’s Porter's Five Forces snapshot highlights strong buyer pressure, moderate supplier leverage, intense rivalry among LTL carriers, constrained threat of new entrants, and manageable substitute risks from other transport modes. These forces shape margins and growth potential in regional freight. This brief can't capture all nuances. Unlock the full Porter's Five Forces Analysis for force-by-force ratings, visuals, and actionable strategy tailored to Saia.
Suppliers Bargaining Power

Fuel and energy dependence
Diesel suppliers are numerous, but fuel remains a large, volatile input—U.S. on‑highway diesel averaged about $3.77/gal in 2024 (EIA), limiting Saia’s pricing control. Fuel surcharges pass through much cost, yet timing lags can compress margins during spikes. Regional supply disruptions tighten spot pricing and reduce routing flexibility. Long‑term hedges partially offset exposure but introduce basis risk.
Truck, trailer, and parts OEMs
Concentrated truck, trailer and parts OEMs (top three control roughly 70% of the US Class 8 market in 2024) can push pricing and extend lead times; emissions and advanced safety tech add specification complexity and can increase unit cost by tens of thousands of dollars, raising switching costs. Backlogs during demand spikes have produced 6–9 month waits, constraining fleet refreshes. Multi-vendor buying mitigates risk but compatibility and maintenance standardization limit true substitution.

Labor and driver market
Qualified drivers and dockworkers are a critical supplier pool; industry driver shortage ~80,000 (ATA, 2024) pushes wages and sign-on bonuses, with average truck driver pay near $60,000 annually in 2024. Tight labor markets raise training and pickup-and-delivery costs for LTL routes. Saia’s non-union model offers scheduling flexibility but must compete on pay, conditions, and schedules; turnover above 70% in large fleets risks disrupting service quality and density economics.

Terminal real estate and equipment leasing
- Scarcity: vacancy <4% (2024)
- Leverage: permitting/infrastructure barriers
- Cost impact: lease escalations raise fixed costs
- Mitigation: ownership reduces exposure but requires significant capex
Technology and telematics vendors
TMS, telemetry, and visibility platforms are core to Saia’s service differentiation and regulatory compliance; the telematics market surpassed $10 billion in 2024, driving strategic vendor reliance. Integration, proprietary data models, and workflow customizations create lock-in while license, sensor, and data fees often scale with fleet size. Open APIs and multi-sourcing lower dependence but raise integration complexity and costs.
- Vendor lock-in
- Rising per-asset costs
- Open API trade-offs
- Compliance-driven necessity
Logistics cost shock: diesel $3.77/gal, driver shortfall ~80,000
Suppliers exert moderate-to-high power: diesel volatility (US on‑highway diesel ~$3.77/gal in 2024) and concentrated OEMs (top 3 ≈70% of US Class 8 market) raise input cost and lead-time risk. Driver shortage (~80,000 deficit, ATA 2024) pushes wages; industrial vacancy <4% increases terminal lease leverage. Telematics market >$10B (2024) creates vendor lock-in and rising per-asset fees.
| Factor | 2024 Metric |
|---|---|
| Diesel | $3.77/gal |
| OEM Concentration | Top3 ≈70% |
| Driver Shortage | ~80,000 |
| Industrial Vacancy | <4% |
| Telematics | >$10B |
What is included in the product
 Detailed Word Document
Concise Porter's Five Forces analysis tailored for Saia that uncovers the key competitive drivers, supplier and buyer power, substitutes and entrant threats, and strategic barriers protecting incumbency, with actionable insights to inform pricing, growth and defensive strategies—fully editable for use in investor materials, strategy decks, or academic projects.

 Customizable Excel Spreadsheet
One-sheet Porter's Five Forces tailored for Saia—visual spider chart and editable pressure sliders let you instantly gauge competitive stress, customize for regulation or new entrants, and drop a clean slide-ready summary into decks without macros or complex setup.
Customers Bargaining Power

Large shippers and 3PLs
Large shippers and 3PLs wield strong leverage: consolidated RFPs covering $100M+ in annual spend and a North American 3PL market ~ $230B in 2024 force Saia into tough rate negotiations. They demand service-level guarantees, volume discounts and performance penalties, increasing price transparency and switching power. To protect margins, Saia must trade price for density and lane balance across its ~3B‑$ network.
Service sensitivity and alternatives
Buyers closely benchmark transit times, damage rates and on-time performance—industry on-time averages hovered around 90% in 2024—so narrowing service differentials shift decisions to price. If carriers show similar KPIs, price becomes the deciding factor, pressuring yield; Saia reported approximately $3.06 billion in 2024 revenue, highlighting scale but not immunity to price competition. Strong service in core lanes (where Saia concentrates capacity) reduces price sensitivity, while weaker coverage in peripheral lanes increases buyer leverage to dual-source.

Digital procurement and visibility
eBids, TMS integrations and freight marketplaces have made rates and capacity highly comparable, and by 2024 roughly 90% of shippers expect real-time visibility as table stakes. Data-backed scorecards now let buyers quantify service gaps and renegotiate contracts when on-time and detention KPIs fall short. Carriers must continuously lift KPIs to defend rate integrity or face commoditization and margin pressure.

Demand cyclicality
During soft freight cycles excess capacity shifts bargaining power to shippers, who press Saia for spot-rate discounts and steeper accessorial concessions; in tight markets pricing leverage swings back toward carriers and yields recover.
Saia’s dense regional network and cross-dock model buffer revenue volatility and limit customer churn but cannot fully neutralize broad cycle-driven rate pressure.
- soft cycles: buyers demand spot discounts
- tight cycles: carriers regain pricing power
- Saia buffer: network density reduces but not removes cycle impact
Switching costs and contracts
Switching costs in LTL are present but often manageable through multi-carrier routing; Saia reported roughly $3.6 billion in revenue in 2024, reflecting scale that supports contractual commitments. Annual contracts and guaranteed service tiers reduce frequent switching, yet performance slippage prompts rapid lane reallocation by buyers. Consistent service quality remains essential to sustain pricing power.
- Multi-carrier routing lowers effective switching costs
- Annual contracts + guaranteed tiers stabilize volumes
- Performance slippage → fast lane reallocation
- Consistent quality needed to preserve pricing power
Shipper scale forces 3PLs into rate vs service tradeoffs despite carriers' dense networks
Large shippers/3PLs (North American 3PL market ≈ $230B in 2024) exert strong bargaining power, forcing Saia into rate/service tradeoffs; buyers benchmark KPIs (industry on-time ≈90% in 2024) and shift to price when service parity exists. Saia's $3.06B 2024 revenue and dense network partly buffer but cannot eliminate cycle-driven rate pressure.
| Metric | 2024 Value | Impact |
|---|---|---|
| 3PL market | $230B | Concentrated buying power |
| On-time avg | ~90% | Benchmarking → price focus |
| Saia revenue | $3.06B | Scale buffer vs. churn |
What You See Is What You Get
Saia Porter's Five Forces Analysis
This preview shows the exact Saia Porter’s Five Forces Analysis you’ll receive immediately after purchase—no placeholders. The file is fully formatted, professionally written, and ready for download and use the moment you buy. No mockups; this is the complete deliverable.

A Must-Have Tool for Decision-Makers
Saia’s Porter's Five Forces snapshot highlights strong buyer pressure, moderate supplier leverage, intense rivalry among LTL carriers, constrained threat of new entrants, and manageable substitute risks from other transport modes. These forces shape margins and growth potential in regional freight. This brief can't capture all nuances. Unlock the full Porter's Five Forces Analysis for force-by-force ratings, visuals, and actionable strategy tailored to Saia.
Suppliers Bargaining Power
Fuel and energy dependence
Diesel suppliers are numerous, but fuel remains a large, volatile input—U.S. on‑highway diesel averaged about $3.77/gal in 2024 (EIA), limiting Saia’s pricing control. Fuel surcharges pass through much cost, yet timing lags can compress margins during spikes. Regional supply disruptions tighten spot pricing and reduce routing flexibility. Long‑term hedges partially offset exposure but introduce basis risk.
Truck, trailer, and parts OEMs
Concentrated truck, trailer and parts OEMs (top three control roughly 70% of the US Class 8 market in 2024) can push pricing and extend lead times; emissions and advanced safety tech add specification complexity and can increase unit cost by tens of thousands of dollars, raising switching costs. Backlogs during demand spikes have produced 6–9 month waits, constraining fleet refreshes. Multi-vendor buying mitigates risk but compatibility and maintenance standardization limit true substitution.
Labor and driver market
Qualified drivers and dockworkers are a critical supplier pool; industry driver shortage ~80,000 (ATA, 2024) pushes wages and sign-on bonuses, with average truck driver pay near $60,000 annually in 2024. Tight labor markets raise training and pickup-and-delivery costs for LTL routes. Saia’s non-union model offers scheduling flexibility but must compete on pay, conditions, and schedules; turnover above 70% in large fleets risks disrupting service quality and density economics.
Terminal real estate and equipment leasing
- Scarcity: vacancy <4% (2024)
- Leverage: permitting/infrastructure barriers
- Cost impact: lease escalations raise fixed costs
- Mitigation: ownership reduces exposure but requires significant capex
Technology and telematics vendors
TMS, telemetry, and visibility platforms are core to Saia’s service differentiation and regulatory compliance; the telematics market surpassed $10 billion in 2024, driving strategic vendor reliance. Integration, proprietary data models, and workflow customizations create lock-in while license, sensor, and data fees often scale with fleet size. Open APIs and multi-sourcing lower dependence but raise integration complexity and costs.
- Vendor lock-in
- Rising per-asset costs
- Open API trade-offs
- Compliance-driven necessity
Logistics cost shock: diesel $3.77/gal, driver shortfall ~80,000
Suppliers exert moderate-to-high power: diesel volatility (US on‑highway diesel ~$3.77/gal in 2024) and concentrated OEMs (top 3 ≈70% of US Class 8 market) raise input cost and lead-time risk. Driver shortage (~80,000 deficit, ATA 2024) pushes wages; industrial vacancy <4% increases terminal lease leverage. Telematics market >$10B (2024) creates vendor lock-in and rising per-asset fees.
| Factor | 2024 Metric |
|---|---|
| Diesel | $3.77/gal |
| OEM Concentration | Top3 ≈70% |
| Driver Shortage | ~80,000 |
| Industrial Vacancy | <4% |
| Telematics | >$10B |
What is included in the product
Detailed Word Document
Concise Porter's Five Forces analysis tailored for Saia that uncovers the key competitive drivers, supplier and buyer power, substitutes and entrant threats, and strategic barriers protecting incumbency, with actionable insights to inform pricing, growth and defensive strategies—fully editable for use in investor materials, strategy decks, or academic projects.
Customizable Excel Spreadsheet
One-sheet Porter's Five Forces tailored for Saia—visual spider chart and editable pressure sliders let you instantly gauge competitive stress, customize for regulation or new entrants, and drop a clean slide-ready summary into decks without macros or complex setup.
Customers Bargaining Power
Large shippers and 3PLs
Large shippers and 3PLs wield strong leverage: consolidated RFPs covering $100M+ in annual spend and a North American 3PL market ~ $230B in 2024 force Saia into tough rate negotiations. They demand service-level guarantees, volume discounts and performance penalties, increasing price transparency and switching power. To protect margins, Saia must trade price for density and lane balance across its ~3B‑$ network.
Service sensitivity and alternatives
Buyers closely benchmark transit times, damage rates and on-time performance—industry on-time averages hovered around 90% in 2024—so narrowing service differentials shift decisions to price. If carriers show similar KPIs, price becomes the deciding factor, pressuring yield; Saia reported approximately $3.06 billion in 2024 revenue, highlighting scale but not immunity to price competition. Strong service in core lanes (where Saia concentrates capacity) reduces price sensitivity, while weaker coverage in peripheral lanes increases buyer leverage to dual-source.
Digital procurement and visibility
eBids, TMS integrations and freight marketplaces have made rates and capacity highly comparable, and by 2024 roughly 90% of shippers expect real-time visibility as table stakes. Data-backed scorecards now let buyers quantify service gaps and renegotiate contracts when on-time and detention KPIs fall short. Carriers must continuously lift KPIs to defend rate integrity or face commoditization and margin pressure.
Demand cyclicality
During soft freight cycles excess capacity shifts bargaining power to shippers, who press Saia for spot-rate discounts and steeper accessorial concessions; in tight markets pricing leverage swings back toward carriers and yields recover.
Saia’s dense regional network and cross-dock model buffer revenue volatility and limit customer churn but cannot fully neutralize broad cycle-driven rate pressure.
- soft cycles: buyers demand spot discounts
- tight cycles: carriers regain pricing power
- Saia buffer: network density reduces but not removes cycle impact
Switching costs and contracts
Switching costs in LTL are present but often manageable through multi-carrier routing; Saia reported roughly $3.6 billion in revenue in 2024, reflecting scale that supports contractual commitments. Annual contracts and guaranteed service tiers reduce frequent switching, yet performance slippage prompts rapid lane reallocation by buyers. Consistent service quality remains essential to sustain pricing power.
- Multi-carrier routing lowers effective switching costs
- Annual contracts + guaranteed tiers stabilize volumes
- Performance slippage → fast lane reallocation
- Consistent quality needed to preserve pricing power
Shipper scale forces 3PLs into rate vs service tradeoffs despite carriers' dense networks
Large shippers/3PLs (North American 3PL market ≈ $230B in 2024) exert strong bargaining power, forcing Saia into rate/service tradeoffs; buyers benchmark KPIs (industry on-time ≈90% in 2024) and shift to price when service parity exists. Saia's $3.06B 2024 revenue and dense network partly buffer but cannot eliminate cycle-driven rate pressure.
| Metric | 2024 Value | Impact |
|---|---|---|
| 3PL market | $230B | Concentrated buying power |
| On-time avg | ~90% | Benchmarking → price focus |
| Saia revenue | $3.06B | Scale buffer vs. churn |
What You See Is What You Get
Saia Porter's Five Forces Analysis
This preview shows the exact Saia Porter’s Five Forces Analysis you’ll receive immediately after purchase—no placeholders. The file is fully formatted, professionally written, and ready for download and use the moment you buy. No mockups; this is the complete deliverable.
Description
A Must-Have Tool for Decision-Makers
Saia’s Porter's Five Forces snapshot highlights strong buyer pressure, moderate supplier leverage, intense rivalry among LTL carriers, constrained threat of new entrants, and manageable substitute risks from other transport modes. These forces shape margins and growth potential in regional freight. This brief can't capture all nuances. Unlock the full Porter's Five Forces Analysis for force-by-force ratings, visuals, and actionable strategy tailored to Saia.
Suppliers Bargaining Power
Fuel and energy dependence
Diesel suppliers are numerous, but fuel remains a large, volatile input—U.S. on‑highway diesel averaged about $3.77/gal in 2024 (EIA), limiting Saia’s pricing control. Fuel surcharges pass through much cost, yet timing lags can compress margins during spikes. Regional supply disruptions tighten spot pricing and reduce routing flexibility. Long‑term hedges partially offset exposure but introduce basis risk.
Truck, trailer, and parts OEMs
Concentrated truck, trailer and parts OEMs (top three control roughly 70% of the US Class 8 market in 2024) can push pricing and extend lead times; emissions and advanced safety tech add specification complexity and can increase unit cost by tens of thousands of dollars, raising switching costs. Backlogs during demand spikes have produced 6–9 month waits, constraining fleet refreshes. Multi-vendor buying mitigates risk but compatibility and maintenance standardization limit true substitution.
Labor and driver market
Qualified drivers and dockworkers are a critical supplier pool; industry driver shortage ~80,000 (ATA, 2024) pushes wages and sign-on bonuses, with average truck driver pay near $60,000 annually in 2024. Tight labor markets raise training and pickup-and-delivery costs for LTL routes. Saia’s non-union model offers scheduling flexibility but must compete on pay, conditions, and schedules; turnover above 70% in large fleets risks disrupting service quality and density economics.
Terminal real estate and equipment leasing
- Scarcity: vacancy <4% (2024)
- Leverage: permitting/infrastructure barriers
- Cost impact: lease escalations raise fixed costs
- Mitigation: ownership reduces exposure but requires significant capex
Technology and telematics vendors
TMS, telemetry, and visibility platforms are core to Saia’s service differentiation and regulatory compliance; the telematics market surpassed $10 billion in 2024, driving strategic vendor reliance. Integration, proprietary data models, and workflow customizations create lock-in while license, sensor, and data fees often scale with fleet size. Open APIs and multi-sourcing lower dependence but raise integration complexity and costs.
- Vendor lock-in
- Rising per-asset costs
- Open API trade-offs
- Compliance-driven necessity
Logistics cost shock: diesel $3.77/gal, driver shortfall ~80,000
Suppliers exert moderate-to-high power: diesel volatility (US on‑highway diesel ~$3.77/gal in 2024) and concentrated OEMs (top 3 ≈70% of US Class 8 market) raise input cost and lead-time risk. Driver shortage (~80,000 deficit, ATA 2024) pushes wages; industrial vacancy <4% increases terminal lease leverage. Telematics market >$10B (2024) creates vendor lock-in and rising per-asset fees.
| Factor | 2024 Metric |
|---|---|
| Diesel | $3.77/gal |
| OEM Concentration | Top3 ≈70% |
| Driver Shortage | ~80,000 |
| Industrial Vacancy | <4% |
| Telematics | >$10B |
What is included in the product
Detailed Word Document
Concise Porter's Five Forces analysis tailored for Saia that uncovers the key competitive drivers, supplier and buyer power, substitutes and entrant threats, and strategic barriers protecting incumbency, with actionable insights to inform pricing, growth and defensive strategies—fully editable for use in investor materials, strategy decks, or academic projects.
Customizable Excel Spreadsheet
One-sheet Porter's Five Forces tailored for Saia—visual spider chart and editable pressure sliders let you instantly gauge competitive stress, customize for regulation or new entrants, and drop a clean slide-ready summary into decks without macros or complex setup.
Customers Bargaining Power
Large shippers and 3PLs
Large shippers and 3PLs wield strong leverage: consolidated RFPs covering $100M+ in annual spend and a North American 3PL market ~ $230B in 2024 force Saia into tough rate negotiations. They demand service-level guarantees, volume discounts and performance penalties, increasing price transparency and switching power. To protect margins, Saia must trade price for density and lane balance across its ~3B‑$ network.
Service sensitivity and alternatives
Buyers closely benchmark transit times, damage rates and on-time performance—industry on-time averages hovered around 90% in 2024—so narrowing service differentials shift decisions to price. If carriers show similar KPIs, price becomes the deciding factor, pressuring yield; Saia reported approximately $3.06 billion in 2024 revenue, highlighting scale but not immunity to price competition. Strong service in core lanes (where Saia concentrates capacity) reduces price sensitivity, while weaker coverage in peripheral lanes increases buyer leverage to dual-source.
Digital procurement and visibility
eBids, TMS integrations and freight marketplaces have made rates and capacity highly comparable, and by 2024 roughly 90% of shippers expect real-time visibility as table stakes. Data-backed scorecards now let buyers quantify service gaps and renegotiate contracts when on-time and detention KPIs fall short. Carriers must continuously lift KPIs to defend rate integrity or face commoditization and margin pressure.
Demand cyclicality
During soft freight cycles excess capacity shifts bargaining power to shippers, who press Saia for spot-rate discounts and steeper accessorial concessions; in tight markets pricing leverage swings back toward carriers and yields recover.
Saia’s dense regional network and cross-dock model buffer revenue volatility and limit customer churn but cannot fully neutralize broad cycle-driven rate pressure.
- soft cycles: buyers demand spot discounts
- tight cycles: carriers regain pricing power
- Saia buffer: network density reduces but not removes cycle impact
Switching costs and contracts
Switching costs in LTL are present but often manageable through multi-carrier routing; Saia reported roughly $3.6 billion in revenue in 2024, reflecting scale that supports contractual commitments. Annual contracts and guaranteed service tiers reduce frequent switching, yet performance slippage prompts rapid lane reallocation by buyers. Consistent service quality remains essential to sustain pricing power.
- Multi-carrier routing lowers effective switching costs
- Annual contracts + guaranteed tiers stabilize volumes
- Performance slippage → fast lane reallocation
- Consistent quality needed to preserve pricing power
Shipper scale forces 3PLs into rate vs service tradeoffs despite carriers' dense networks
Large shippers/3PLs (North American 3PL market ≈ $230B in 2024) exert strong bargaining power, forcing Saia into rate/service tradeoffs; buyers benchmark KPIs (industry on-time ≈90% in 2024) and shift to price when service parity exists. Saia's $3.06B 2024 revenue and dense network partly buffer but cannot eliminate cycle-driven rate pressure.
| Metric | 2024 Value | Impact |
|---|---|---|
| 3PL market | $230B | Concentrated buying power |
| On-time avg | ~90% | Benchmarking → price focus |
| Saia revenue | $3.06B | Scale buffer vs. churn |
What You See Is What You Get
Saia Porter's Five Forces Analysis
This preview shows the exact Saia Porter’s Five Forces Analysis you’ll receive immediately after purchase—no placeholders. The file is fully formatted, professionally written, and ready for download and use the moment you buy. No mockups; this is the complete deliverable.











