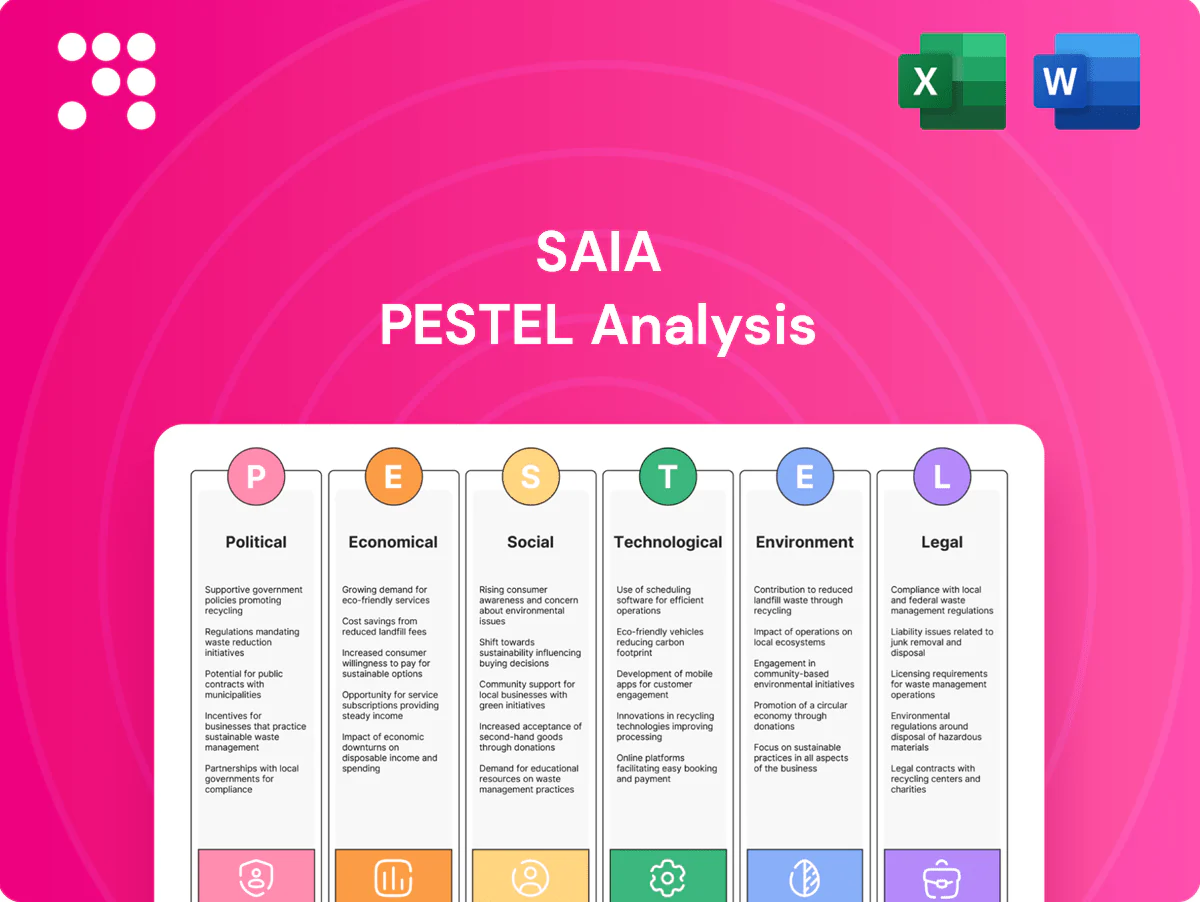
Saia PESTLE Analysis

Skip the Research. Get the Strategy.
Gain a competitive edge with our targeted PESTLE Analysis of Saia, revealing how political, economic, social, technological, legal, and environmental forces shape its logistics strategy. This concise, actionable report highlights risks and growth levers for investors and executives. Ready-to-use and fully researched—purchase the full analysis for immediate strategic insights and data you can act on.
Political factors

Federal infrastructure spending and policy
Shifts in U.S. infrastructure priorities directly affect highway quality, congestion, and Saia’s transit times; concentrated federal investment under the Bipartisan Infrastructure Law includes $110 billion for roads, bridges and major projects. Targeted funding for bridges and freight corridors can cut maintenance downtime and boost reliability, while deferred spending raises accident risk and equipment wear. Monitoring DOT allocations lets Saia align network investments with funding windows.
Fuel taxation and energy policy
Changes to diesel taxes or carbon pricing—limited at federal level but active in California and RGGI states—directly raise LTL costs and surcharges; U.S. average on‑highway diesel was about $3.95/gal in 2024 (EIA). Incentives from the Inflation Reduction Act and state programs are accelerating alternative‑fuel truck procurement and reshaping fleet economics. Policy volatility increases pricing complexity with customers, so Saia mitigates risk via DOE‑indexed fuel surcharges and targeted fuel‑efficiency programs.

Interstate regulations and state-by-state rules
Interstate divergence—federal interstate gross vehicle weight cap commonly 80,000 lbs vs varying state axle/permit regimes—plus differing tolling and emissions rules (eg. CARB-heavy West) complicate multi-state routing for carriers like Saia, which serves 48 states, raising compliance and training burdens. Harmonization can cut costs; fragmentation increases them. Dynamic routing and real‑time toll/emissions overlays let fleets avoid high‑cost corridors.

Labor and workforce policies
Minimum wage (federal $7.25) and evolving overtime rules raise driver and dock labor costs, while collective bargaining in some regions increases wages and benefits, pressuring Saia (2023 revenue $3.41B) margins. Immigration policy and an industry driver shortage estimated at 60–80k reduce available labor pools. Federal and state CDL training grants have grown, easing shortages, so Saia’s staffing model must pivot quickly to policy shifts.
- Minimum wage: federal $7.25; state differentials
- Driver shortage: est. 60–80k
- Saia revenue (2023): $3.41B
- CDL training grants rising — strategic hiring needed
Trade and procurement sensitivities
Tariffs and import policy swings alter shipment mix and regional volumes across Saia’s network, shifting load density and lane profitability. Cross-border dynamics with Mexico and Canada indirectly reshape domestic freight flows and capacity balance. Policy-driven reshoring raises regional LTL demand as manufacturers shorten supply chains. As a top-5 US LTL carrier, Saia’s terminal placement benefits from tracking these shifts.
- Tariff-driven volume shifts raise regional LTL demand
- Cross-border flows affect domestic capacity balance
- Reshoring boosts short-haul terminal utilization
- Network placement supports rapid redeployment
Political shifts, $110B roads, $3.95/gal fuel, 60–80k driver gap
Political shifts—BIL $110B for roads, state carbon rules, diesel avg $3.95/gal (2024 EIA)—directly affect Saia’s costs, routing and fleet investments. Wage/overtime changes and 60–80k driver shortage pressure labor costs vs Saia $3.41B 2023 revenue. Tariffs, reshoring and cross‑border policy reshape regional LTL demand.
| Factor | Key datapoint | Impact |
|---|---|---|
| Infrastructure | $110B BIL | Reduced congestion |
| Fuel | $3.95/gal (2024) | Higher OPEX |
| Labor | 60–80k shortage | Wage pressure |
What is included in the product
 Detailed Word Document
Explores how Political, Economic, Social, Technological, Environmental and Legal forces uniquely impact Saia, with data-backed trends, region- and industry-specific examples, and forward-looking insights to support executives, consultants and investors in identifying risks, opportunities and scenario-based strategic actions.

 Customizable Excel Spreadsheet
Condensed Saia PESTLE analysis that’s visually segmented by category for rapid interpretation, easily dropped into presentations or shared across teams to align on regulatory, economic, and operational risks; editable notes let users tailor insights to region or business line for faster strategic decisions.
Economic factors

Industrial production and inventory cycles
LTL volumes closely track manufacturing output and retail restocking: ISM Manufacturing PMI readings above 50 signal expansion and higher volumes, while readings below 50 indicate contraction and destocking that compress yields and load factors. Restocking raises load mix and density, so monitoring PMI and retail inventory levels guides capacity and pricing. Saia can dynamically reprice lanes to align with cycle phases.
Fuel price volatility
Volatile diesel costs — U.S. on-highway diesel averaged about $3.86/gal in June 2025 — pressure Saia’s operating margins despite fuel surcharges that often lag by several weeks, creating short-term margin drag. Strategic hedging and fuel-efficiency programs (route planning, speed governance) improve resilience. Network optimization to cut empty miles during high-price periods further mitigates cost spikes.

Interest rates and capital intensity
Rising benchmark policy rates (federal funds ~5.25–5.50% in 2024–25) increase the effective cost to finance tractors, trailers and terminal expansions, pushing carriers to delay growth capex or favor leasing. Higher financing costs compress returns, so Saia’s strong balance-sheet management preserves flexibility through cycles. Saia should prioritize ROIC-driven densification projects over fleet-heavy expansion.

Labor market tightness and wage inflation
Driver and dock labor availability directly affects Saia service reliability and unit cost; ATA estimated a US driver shortfall of about 80,000 in 2023, pushing carriers into higher wages, sign-on bonuses and training spend. Investments in automation, telematics and route-optimization can offset labor pressure, while service premiums allow Saia to price when capacity is scarce.
- Driver/dock availability → reliability & cost
- Tight market → wage growth, bonuses, training
- Automation → productivity offset
- Service premiums → pricing power
E-commerce and distribution shifts
Political shifts, $110B roads, $3.95/gal fuel, 60–80k driver gap
LTL volumes follow ISM PMI cycles; e‑commerce (16% of US retail sales in 2024) lifts smaller, frequent shipments favoring Saia’s ~600 terminals. Diesel averaged $3.86/gal in June 2025 and squeezes margins; fuel hedging and empty‑mile cuts mitigate. Fed funds ~5.25–5.50% (2024–25) raises capex cost; driver shortfall ~80,000 (2023) keeps wage inflation high.
| Metric | 2024–25 | Impact |
|---|---|---|
| ISM PMI | ±50 | Volumes/yields |
| Diesel | $3.86/gal (Jun 2025) | Margin pressure |
| Fed funds | 5.25–5.50% | Capex cost |
| Driver gap | ~80,000 (2023) | Wage inflation |
Preview the Actual Deliverable
Saia PESTLE Analysis
The preview shown here is the exact Saia PESTLE Analysis you’ll receive after purchase—fully formatted, professionally structured, and ready to use. No placeholders or teasers; the content and layout are identical to the downloadable file. After payment you’ll instantly get this exact document.

Skip the Research. Get the Strategy.
Gain a competitive edge with our targeted PESTLE Analysis of Saia, revealing how political, economic, social, technological, legal, and environmental forces shape its logistics strategy. This concise, actionable report highlights risks and growth levers for investors and executives. Ready-to-use and fully researched—purchase the full analysis for immediate strategic insights and data you can act on.
Political factors
Federal infrastructure spending and policy
Shifts in U.S. infrastructure priorities directly affect highway quality, congestion, and Saia’s transit times; concentrated federal investment under the Bipartisan Infrastructure Law includes $110 billion for roads, bridges and major projects. Targeted funding for bridges and freight corridors can cut maintenance downtime and boost reliability, while deferred spending raises accident risk and equipment wear. Monitoring DOT allocations lets Saia align network investments with funding windows.
Fuel taxation and energy policy
Changes to diesel taxes or carbon pricing—limited at federal level but active in California and RGGI states—directly raise LTL costs and surcharges; U.S. average on‑highway diesel was about $3.95/gal in 2024 (EIA). Incentives from the Inflation Reduction Act and state programs are accelerating alternative‑fuel truck procurement and reshaping fleet economics. Policy volatility increases pricing complexity with customers, so Saia mitigates risk via DOE‑indexed fuel surcharges and targeted fuel‑efficiency programs.
Interstate regulations and state-by-state rules
Interstate divergence—federal interstate gross vehicle weight cap commonly 80,000 lbs vs varying state axle/permit regimes—plus differing tolling and emissions rules (eg. CARB-heavy West) complicate multi-state routing for carriers like Saia, which serves 48 states, raising compliance and training burdens. Harmonization can cut costs; fragmentation increases them. Dynamic routing and real‑time toll/emissions overlays let fleets avoid high‑cost corridors.
Labor and workforce policies
Minimum wage (federal $7.25) and evolving overtime rules raise driver and dock labor costs, while collective bargaining in some regions increases wages and benefits, pressuring Saia (2023 revenue $3.41B) margins. Immigration policy and an industry driver shortage estimated at 60–80k reduce available labor pools. Federal and state CDL training grants have grown, easing shortages, so Saia’s staffing model must pivot quickly to policy shifts.
- Minimum wage: federal $7.25; state differentials
- Driver shortage: est. 60–80k
- Saia revenue (2023): $3.41B
- CDL training grants rising — strategic hiring needed
Trade and procurement sensitivities
Tariffs and import policy swings alter shipment mix and regional volumes across Saia’s network, shifting load density and lane profitability. Cross-border dynamics with Mexico and Canada indirectly reshape domestic freight flows and capacity balance. Policy-driven reshoring raises regional LTL demand as manufacturers shorten supply chains. As a top-5 US LTL carrier, Saia’s terminal placement benefits from tracking these shifts.
- Tariff-driven volume shifts raise regional LTL demand
- Cross-border flows affect domestic capacity balance
- Reshoring boosts short-haul terminal utilization
- Network placement supports rapid redeployment
Political shifts, $110B roads, $3.95/gal fuel, 60–80k driver gap
Political shifts—BIL $110B for roads, state carbon rules, diesel avg $3.95/gal (2024 EIA)—directly affect Saia’s costs, routing and fleet investments. Wage/overtime changes and 60–80k driver shortage pressure labor costs vs Saia $3.41B 2023 revenue. Tariffs, reshoring and cross‑border policy reshape regional LTL demand.
| Factor | Key datapoint | Impact |
|---|---|---|
| Infrastructure | $110B BIL | Reduced congestion |
| Fuel | $3.95/gal (2024) | Higher OPEX |
| Labor | 60–80k shortage | Wage pressure |
What is included in the product
Detailed Word Document
Explores how Political, Economic, Social, Technological, Environmental and Legal forces uniquely impact Saia, with data-backed trends, region- and industry-specific examples, and forward-looking insights to support executives, consultants and investors in identifying risks, opportunities and scenario-based strategic actions.
Customizable Excel Spreadsheet
Condensed Saia PESTLE analysis that’s visually segmented by category for rapid interpretation, easily dropped into presentations or shared across teams to align on regulatory, economic, and operational risks; editable notes let users tailor insights to region or business line for faster strategic decisions.
Economic factors
Industrial production and inventory cycles
LTL volumes closely track manufacturing output and retail restocking: ISM Manufacturing PMI readings above 50 signal expansion and higher volumes, while readings below 50 indicate contraction and destocking that compress yields and load factors. Restocking raises load mix and density, so monitoring PMI and retail inventory levels guides capacity and pricing. Saia can dynamically reprice lanes to align with cycle phases.
Fuel price volatility
Volatile diesel costs — U.S. on-highway diesel averaged about $3.86/gal in June 2025 — pressure Saia’s operating margins despite fuel surcharges that often lag by several weeks, creating short-term margin drag. Strategic hedging and fuel-efficiency programs (route planning, speed governance) improve resilience. Network optimization to cut empty miles during high-price periods further mitigates cost spikes.
Interest rates and capital intensity
Rising benchmark policy rates (federal funds ~5.25–5.50% in 2024–25) increase the effective cost to finance tractors, trailers and terminal expansions, pushing carriers to delay growth capex or favor leasing. Higher financing costs compress returns, so Saia’s strong balance-sheet management preserves flexibility through cycles. Saia should prioritize ROIC-driven densification projects over fleet-heavy expansion.
Labor market tightness and wage inflation
Driver and dock labor availability directly affects Saia service reliability and unit cost; ATA estimated a US driver shortfall of about 80,000 in 2023, pushing carriers into higher wages, sign-on bonuses and training spend. Investments in automation, telematics and route-optimization can offset labor pressure, while service premiums allow Saia to price when capacity is scarce.
- Driver/dock availability → reliability & cost
- Tight market → wage growth, bonuses, training
- Automation → productivity offset
- Service premiums → pricing power
E-commerce and distribution shifts
Political shifts, $110B roads, $3.95/gal fuel, 60–80k driver gap
LTL volumes follow ISM PMI cycles; e‑commerce (16% of US retail sales in 2024) lifts smaller, frequent shipments favoring Saia’s ~600 terminals. Diesel averaged $3.86/gal in June 2025 and squeezes margins; fuel hedging and empty‑mile cuts mitigate. Fed funds ~5.25–5.50% (2024–25) raises capex cost; driver shortfall ~80,000 (2023) keeps wage inflation high.
| Metric | 2024–25 | Impact |
|---|---|---|
| ISM PMI | ±50 | Volumes/yields |
| Diesel | $3.86/gal (Jun 2025) | Margin pressure |
| Fed funds | 5.25–5.50% | Capex cost |
| Driver gap | ~80,000 (2023) | Wage inflation |
Preview the Actual Deliverable
Saia PESTLE Analysis
The preview shown here is the exact Saia PESTLE Analysis you’ll receive after purchase—fully formatted, professionally structured, and ready to use. No placeholders or teasers; the content and layout are identical to the downloadable file. After payment you’ll instantly get this exact document.
Original: $10.00
-65%$10.00
$3.50Description
Skip the Research. Get the Strategy.
Gain a competitive edge with our targeted PESTLE Analysis of Saia, revealing how political, economic, social, technological, legal, and environmental forces shape its logistics strategy. This concise, actionable report highlights risks and growth levers for investors and executives. Ready-to-use and fully researched—purchase the full analysis for immediate strategic insights and data you can act on.
Political factors
Federal infrastructure spending and policy
Shifts in U.S. infrastructure priorities directly affect highway quality, congestion, and Saia’s transit times; concentrated federal investment under the Bipartisan Infrastructure Law includes $110 billion for roads, bridges and major projects. Targeted funding for bridges and freight corridors can cut maintenance downtime and boost reliability, while deferred spending raises accident risk and equipment wear. Monitoring DOT allocations lets Saia align network investments with funding windows.
Fuel taxation and energy policy
Changes to diesel taxes or carbon pricing—limited at federal level but active in California and RGGI states—directly raise LTL costs and surcharges; U.S. average on‑highway diesel was about $3.95/gal in 2024 (EIA). Incentives from the Inflation Reduction Act and state programs are accelerating alternative‑fuel truck procurement and reshaping fleet economics. Policy volatility increases pricing complexity with customers, so Saia mitigates risk via DOE‑indexed fuel surcharges and targeted fuel‑efficiency programs.
Interstate regulations and state-by-state rules
Interstate divergence—federal interstate gross vehicle weight cap commonly 80,000 lbs vs varying state axle/permit regimes—plus differing tolling and emissions rules (eg. CARB-heavy West) complicate multi-state routing for carriers like Saia, which serves 48 states, raising compliance and training burdens. Harmonization can cut costs; fragmentation increases them. Dynamic routing and real‑time toll/emissions overlays let fleets avoid high‑cost corridors.
Labor and workforce policies
Minimum wage (federal $7.25) and evolving overtime rules raise driver and dock labor costs, while collective bargaining in some regions increases wages and benefits, pressuring Saia (2023 revenue $3.41B) margins. Immigration policy and an industry driver shortage estimated at 60–80k reduce available labor pools. Federal and state CDL training grants have grown, easing shortages, so Saia’s staffing model must pivot quickly to policy shifts.
- Minimum wage: federal $7.25; state differentials
- Driver shortage: est. 60–80k
- Saia revenue (2023): $3.41B
- CDL training grants rising — strategic hiring needed
Trade and procurement sensitivities
Tariffs and import policy swings alter shipment mix and regional volumes across Saia’s network, shifting load density and lane profitability. Cross-border dynamics with Mexico and Canada indirectly reshape domestic freight flows and capacity balance. Policy-driven reshoring raises regional LTL demand as manufacturers shorten supply chains. As a top-5 US LTL carrier, Saia’s terminal placement benefits from tracking these shifts.
- Tariff-driven volume shifts raise regional LTL demand
- Cross-border flows affect domestic capacity balance
- Reshoring boosts short-haul terminal utilization
- Network placement supports rapid redeployment
Political shifts, $110B roads, $3.95/gal fuel, 60–80k driver gap
Political shifts—BIL $110B for roads, state carbon rules, diesel avg $3.95/gal (2024 EIA)—directly affect Saia’s costs, routing and fleet investments. Wage/overtime changes and 60–80k driver shortage pressure labor costs vs Saia $3.41B 2023 revenue. Tariffs, reshoring and cross‑border policy reshape regional LTL demand.
| Factor | Key datapoint | Impact |
|---|---|---|
| Infrastructure | $110B BIL | Reduced congestion |
| Fuel | $3.95/gal (2024) | Higher OPEX |
| Labor | 60–80k shortage | Wage pressure |
What is included in the product
Detailed Word Document
Explores how Political, Economic, Social, Technological, Environmental and Legal forces uniquely impact Saia, with data-backed trends, region- and industry-specific examples, and forward-looking insights to support executives, consultants and investors in identifying risks, opportunities and scenario-based strategic actions.
Customizable Excel Spreadsheet
Condensed Saia PESTLE analysis that’s visually segmented by category for rapid interpretation, easily dropped into presentations or shared across teams to align on regulatory, economic, and operational risks; editable notes let users tailor insights to region or business line for faster strategic decisions.
Economic factors
Industrial production and inventory cycles
LTL volumes closely track manufacturing output and retail restocking: ISM Manufacturing PMI readings above 50 signal expansion and higher volumes, while readings below 50 indicate contraction and destocking that compress yields and load factors. Restocking raises load mix and density, so monitoring PMI and retail inventory levels guides capacity and pricing. Saia can dynamically reprice lanes to align with cycle phases.
Fuel price volatility
Volatile diesel costs — U.S. on-highway diesel averaged about $3.86/gal in June 2025 — pressure Saia’s operating margins despite fuel surcharges that often lag by several weeks, creating short-term margin drag. Strategic hedging and fuel-efficiency programs (route planning, speed governance) improve resilience. Network optimization to cut empty miles during high-price periods further mitigates cost spikes.
Interest rates and capital intensity
Rising benchmark policy rates (federal funds ~5.25–5.50% in 2024–25) increase the effective cost to finance tractors, trailers and terminal expansions, pushing carriers to delay growth capex or favor leasing. Higher financing costs compress returns, so Saia’s strong balance-sheet management preserves flexibility through cycles. Saia should prioritize ROIC-driven densification projects over fleet-heavy expansion.
Labor market tightness and wage inflation
Driver and dock labor availability directly affects Saia service reliability and unit cost; ATA estimated a US driver shortfall of about 80,000 in 2023, pushing carriers into higher wages, sign-on bonuses and training spend. Investments in automation, telematics and route-optimization can offset labor pressure, while service premiums allow Saia to price when capacity is scarce.
- Driver/dock availability → reliability & cost
- Tight market → wage growth, bonuses, training
- Automation → productivity offset
- Service premiums → pricing power
E-commerce and distribution shifts
Political shifts, $110B roads, $3.95/gal fuel, 60–80k driver gap
LTL volumes follow ISM PMI cycles; e‑commerce (16% of US retail sales in 2024) lifts smaller, frequent shipments favoring Saia’s ~600 terminals. Diesel averaged $3.86/gal in June 2025 and squeezes margins; fuel hedging and empty‑mile cuts mitigate. Fed funds ~5.25–5.50% (2024–25) raises capex cost; driver shortfall ~80,000 (2023) keeps wage inflation high.
| Metric | 2024–25 | Impact |
|---|---|---|
| ISM PMI | ±50 | Volumes/yields |
| Diesel | $3.86/gal (Jun 2025) | Margin pressure |
| Fed funds | 5.25–5.50% | Capex cost |
| Driver gap | ~80,000 (2023) | Wage inflation |
Preview the Actual Deliverable
Saia PESTLE Analysis
The preview shown here is the exact Saia PESTLE Analysis you’ll receive after purchase—fully formatted, professionally structured, and ready to use. No placeholders or teasers; the content and layout are identical to the downloadable file. After payment you’ll instantly get this exact document.











