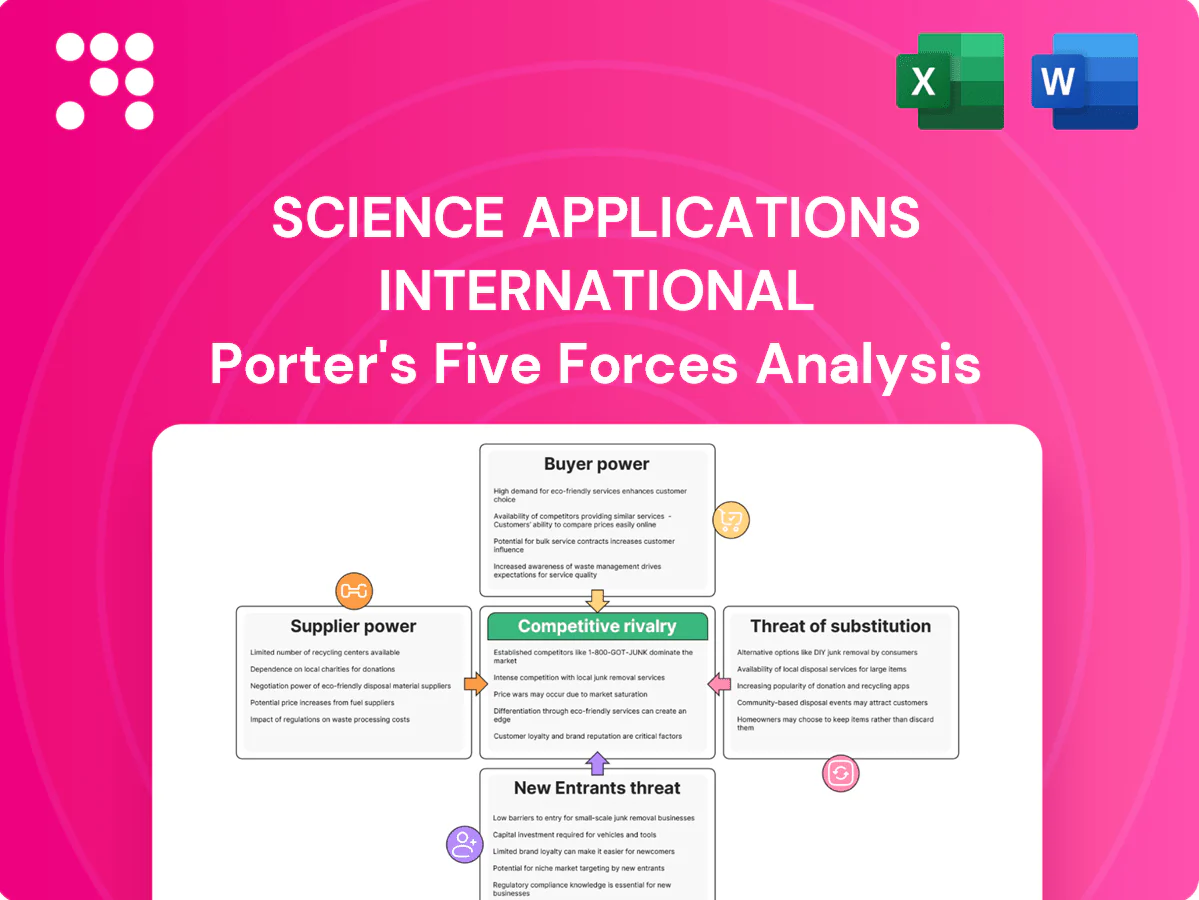
Science Applications International Porter's Five Forces Analysis

A Must-Have Tool for Decision-Makers
Science Applications International faces shifting defense budgets, concentrated buyers, and high supplier specialization that shape its competitive intensity; niche tech capabilities raise barriers yet evolving commercial threats and talent pressures increase risk—unlock the full Porter's Five Forces Analysis to explore force-by-force ratings, visuals, and strategic implications tailored to SAIC.
Suppliers Bargaining Power

Cleared talent scarcity
SAIC depends on highly cleared engineers and analysts within a U.S. cleared workforce of about 3 million, a chronically tight labor pool; specialized certifications and polygraph rules concentrate bargaining power with individuals and staffing firms, driving wage inflation and retention premiums that raise input costs and can delay delivery and compress margins against SAIC’s ~$7.2B 2023 revenue.
Dependence on OEM platforms
Key SAIC solutions depend heavily on hyperscaler and defense OEM platforms—AWS held ~31% cloud IaaS market share in 2024, Azure ~23%, GCP ~11%—giving vendors control over pricing, licensing, and roadmap changes. Bundled support and proprietary standards from OEMs raise switching costs and lock integrators in. With the US defense budget near $858 billion in FY2024, SAIC must align tightly to partner ecosystems to remain competitive.

Niche subcontractors and SB partners
Program execution often requires niche small businesses for set-asides or unique know-how; the government-wide small business contracting goal remains 23% (SBA), concentrating leverage in those suppliers.
Limited alternatives in specialized domains raise bargaining power, with single-source subcontract awards common on classified and technical programs.
Flow-down compliance and oversight add coordination costs and administrative burden (often several percent of program value), and overreliance increases schedule and quality risk.

Classified tools and data dependencies
Access to secure facilities, datasets and specialized toolchains for SAIC are concentrated with a few cleared providers, giving them outsized leverage; FY2024 US defense budget was about 858 billion, concentrating classified spend among prime contractors. Scarcity, accreditation and multi‑month approval lead times elevate supplier influence and can delay program delivery, enabling suppliers to extract favorable contractual terms due to high substitution barriers.
- Concentration: top primes capture >60% of classified contracting
- Approval lag: multi‑month lead times for accreditations
- Barrier: limited cleared toolchain providers, high switching costs
Hardware lead times and export controls
~3M cleared labor hikes wages vs $7.2B defense firm
SAIC faces strong supplier leverage from a limited cleared workforce (~3M US cleared) driving wage inflation vs SAIC $7.2B 2023 revenue.
Hyperscalers (AWS ~31% 2024) and defense OEMs control platforms, licensing and switching costs.
Specialized small-business set‑asides and single‑source classified suppliers concentrate bargaining power (>60% prime share).
| Metric | Value | Impact |
|---|---|---|
| Cleared workforce | ~3M | Wage pressure |
| SAIC rev | $7.2B (2023) | Margin squeeze |
| Lead times | 6–18 mo | Schedule risk |
What is included in the product
 Detailed Word Document
Porter's Five Forces analysis for Science Applications International uncovers competitive dynamics, supplier/buyer power, entry barriers, substitutes, and emerging threats shaping its defense and government services market position.

 Customizable Excel Spreadsheet
A clear one-sheet Porter’s Five Forces for Science Applications International (SAIC) that visualizes competitive pressure with a spider chart, lets you customize force levels for evolving defense and tech markets, integrates into decks/Excel, and requires no macros—ready for quick strategic decisions.
Customers Bargaining Power

Dominant government customers
U.S. federal agencies drive concentrated demand for SAIC, accounting for over 90% of its business and roughly $7.0 billion in FY2024 revenue, with sophisticated procurement offices that press for lower prices and tighter SLAs. Wide use of IDIQ and GWAC contract vehicles amplifies price competition and reduces deal-by-deal negotiating leverage. Standardized payment terms, extended invoice reviews and audit rights further shift risk and cash-flow advantages to the buyer.
Switching costs vs mission risk
Integration depth and SAIC incumbency in federal programs create moderate-to-high switching costs, especially on multi-year IT and systems contracts frequently structured with 5-year base terms and option years. However, agencies commonly recompete task orders and IDIQs, enabling downward price pressure. FAR-mandated transition and handover plans reduce mission transition risk. Buyers therefore balance continuity versus price, sustaining bargaining power.

Procurement modalities (LPTA vs Best-Value)
Under LPTA price dominates procurement, compressing contractor margins and favoring low bids over innovation. Best-Value evaluations still weight past performance and technical merit, tempering pure price pressure and supporting higher-value firms. Agencies, including DoD with a $858 billion 2024 budget, can mix task orders to extract concessions. Evaluation flexibility further enhances buyer leverage in negotiations.

Budget cycles and appropriations
Federal budget timing (fiscal year begins Oct 1) and continuing resolutions, including CRs that extended into March 2024, create funding uncertainty that compresses award windows and negotiation leverage for contractors. Agencies routinely use option‑year decisions to extract improvements or change scope, while schedule slips shift scope and burn rates onto contractors. Buyers time awards to align with fiscal execution and favorable terms.
- CRs-2024: funding uncertainty
- OptionYears: leverage for agencies
- Slips: increased contractor burn rates
- AwardTiming: buyers optimize fiscal terms
Performance oversight and CPARS
Rigorous SLA and EVMS oversight enables remedies and fee withholds for underperformance, directly reducing contractor revenue and raising exit costs. As of 2024, CPARS remains the primary federal performance-rating tool across DoD and civilian agencies and materially influences source-selection and recompete decisions, disciplining contractors via lower past-performance ratings. Buyers can demand corrective action plans rapidly, accelerating remediation and preserving leverage. This governance framework thus strengthens buyer power over SAIC on awarded contracts.
- CPARS: primary federal tool in 2024
- SLA/EVMS: enables fee withholds and remedies
- Buyers: can demand fast corrective action
- Result: increased buyer leverage in awards
U.S. federal buyers drive >90% of revenue; DoD $858B and CRs heighten cash-flow risk
U.S. federal agencies drive over 90% of SAIC revenue (~$7.0B FY2024), with procurement teams enforcing lower prices and strict SLAs. IDIQ/GWAC vehicles and LPTA compress margins, while Best-Value and DoD's $858B 2024 budget allow task-order mix to extract concessions. CPARS, EVMS and CRs through March 2024 heighten buyer leverage and cash-flow risk.
| Metric | 2024 |
|---|---|
| Federal share | >90% |
| SAIC revenue | $7.0B |
| DoD budget | $858B |
| CRs | Extended into Mar 2024 |
| CPARS | Primary tool |
What You See Is What You Get
Science Applications International Porter's Five Forces Analysis
This preview shows the exact Science Applications International (SAIC) Porter's Five Forces analysis you'll receive immediately after purchase—no placeholders or mockups. The document is fully formatted and ready to download and use for strategic or investment decisions. What you see here is the complete deliverable, available instantly upon payment.

A Must-Have Tool for Decision-Makers
Science Applications International faces shifting defense budgets, concentrated buyers, and high supplier specialization that shape its competitive intensity; niche tech capabilities raise barriers yet evolving commercial threats and talent pressures increase risk—unlock the full Porter's Five Forces Analysis to explore force-by-force ratings, visuals, and strategic implications tailored to SAIC.
Suppliers Bargaining Power
Cleared talent scarcity
SAIC depends on highly cleared engineers and analysts within a U.S. cleared workforce of about 3 million, a chronically tight labor pool; specialized certifications and polygraph rules concentrate bargaining power with individuals and staffing firms, driving wage inflation and retention premiums that raise input costs and can delay delivery and compress margins against SAIC’s ~$7.2B 2023 revenue.
Dependence on OEM platforms
Key SAIC solutions depend heavily on hyperscaler and defense OEM platforms—AWS held ~31% cloud IaaS market share in 2024, Azure ~23%, GCP ~11%—giving vendors control over pricing, licensing, and roadmap changes. Bundled support and proprietary standards from OEMs raise switching costs and lock integrators in. With the US defense budget near $858 billion in FY2024, SAIC must align tightly to partner ecosystems to remain competitive.
Niche subcontractors and SB partners
Program execution often requires niche small businesses for set-asides or unique know-how; the government-wide small business contracting goal remains 23% (SBA), concentrating leverage in those suppliers.
Limited alternatives in specialized domains raise bargaining power, with single-source subcontract awards common on classified and technical programs.
Flow-down compliance and oversight add coordination costs and administrative burden (often several percent of program value), and overreliance increases schedule and quality risk.
Classified tools and data dependencies
Access to secure facilities, datasets and specialized toolchains for SAIC are concentrated with a few cleared providers, giving them outsized leverage; FY2024 US defense budget was about 858 billion, concentrating classified spend among prime contractors. Scarcity, accreditation and multi‑month approval lead times elevate supplier influence and can delay program delivery, enabling suppliers to extract favorable contractual terms due to high substitution barriers.
- Concentration: top primes capture >60% of classified contracting
- Approval lag: multi‑month lead times for accreditations
- Barrier: limited cleared toolchain providers, high switching costs
Hardware lead times and export controls
~3M cleared labor hikes wages vs $7.2B defense firm
SAIC faces strong supplier leverage from a limited cleared workforce (~3M US cleared) driving wage inflation vs SAIC $7.2B 2023 revenue.
Hyperscalers (AWS ~31% 2024) and defense OEMs control platforms, licensing and switching costs.
Specialized small-business set‑asides and single‑source classified suppliers concentrate bargaining power (>60% prime share).
| Metric | Value | Impact |
|---|---|---|
| Cleared workforce | ~3M | Wage pressure |
| SAIC rev | $7.2B (2023) | Margin squeeze |
| Lead times | 6–18 mo | Schedule risk |
What is included in the product
Detailed Word Document
Porter's Five Forces analysis for Science Applications International uncovers competitive dynamics, supplier/buyer power, entry barriers, substitutes, and emerging threats shaping its defense and government services market position.
Customizable Excel Spreadsheet
A clear one-sheet Porter’s Five Forces for Science Applications International (SAIC) that visualizes competitive pressure with a spider chart, lets you customize force levels for evolving defense and tech markets, integrates into decks/Excel, and requires no macros—ready for quick strategic decisions.
Customers Bargaining Power
Dominant government customers
U.S. federal agencies drive concentrated demand for SAIC, accounting for over 90% of its business and roughly $7.0 billion in FY2024 revenue, with sophisticated procurement offices that press for lower prices and tighter SLAs. Wide use of IDIQ and GWAC contract vehicles amplifies price competition and reduces deal-by-deal negotiating leverage. Standardized payment terms, extended invoice reviews and audit rights further shift risk and cash-flow advantages to the buyer.
Switching costs vs mission risk
Integration depth and SAIC incumbency in federal programs create moderate-to-high switching costs, especially on multi-year IT and systems contracts frequently structured with 5-year base terms and option years. However, agencies commonly recompete task orders and IDIQs, enabling downward price pressure. FAR-mandated transition and handover plans reduce mission transition risk. Buyers therefore balance continuity versus price, sustaining bargaining power.
Procurement modalities (LPTA vs Best-Value)
Under LPTA price dominates procurement, compressing contractor margins and favoring low bids over innovation. Best-Value evaluations still weight past performance and technical merit, tempering pure price pressure and supporting higher-value firms. Agencies, including DoD with a $858 billion 2024 budget, can mix task orders to extract concessions. Evaluation flexibility further enhances buyer leverage in negotiations.
Budget cycles and appropriations
Federal budget timing (fiscal year begins Oct 1) and continuing resolutions, including CRs that extended into March 2024, create funding uncertainty that compresses award windows and negotiation leverage for contractors. Agencies routinely use option‑year decisions to extract improvements or change scope, while schedule slips shift scope and burn rates onto contractors. Buyers time awards to align with fiscal execution and favorable terms.
- CRs-2024: funding uncertainty
- OptionYears: leverage for agencies
- Slips: increased contractor burn rates
- AwardTiming: buyers optimize fiscal terms
Performance oversight and CPARS
Rigorous SLA and EVMS oversight enables remedies and fee withholds for underperformance, directly reducing contractor revenue and raising exit costs. As of 2024, CPARS remains the primary federal performance-rating tool across DoD and civilian agencies and materially influences source-selection and recompete decisions, disciplining contractors via lower past-performance ratings. Buyers can demand corrective action plans rapidly, accelerating remediation and preserving leverage. This governance framework thus strengthens buyer power over SAIC on awarded contracts.
- CPARS: primary federal tool in 2024
- SLA/EVMS: enables fee withholds and remedies
- Buyers: can demand fast corrective action
- Result: increased buyer leverage in awards
U.S. federal buyers drive >90% of revenue; DoD $858B and CRs heighten cash-flow risk
U.S. federal agencies drive over 90% of SAIC revenue (~$7.0B FY2024), with procurement teams enforcing lower prices and strict SLAs. IDIQ/GWAC vehicles and LPTA compress margins, while Best-Value and DoD's $858B 2024 budget allow task-order mix to extract concessions. CPARS, EVMS and CRs through March 2024 heighten buyer leverage and cash-flow risk.
| Metric | 2024 |
|---|---|
| Federal share | >90% |
| SAIC revenue | $7.0B |
| DoD budget | $858B |
| CRs | Extended into Mar 2024 |
| CPARS | Primary tool |
What You See Is What You Get
Science Applications International Porter's Five Forces Analysis
This preview shows the exact Science Applications International (SAIC) Porter's Five Forces analysis you'll receive immediately after purchase—no placeholders or mockups. The document is fully formatted and ready to download and use for strategic or investment decisions. What you see here is the complete deliverable, available instantly upon payment.
Description
A Must-Have Tool for Decision-Makers
Science Applications International faces shifting defense budgets, concentrated buyers, and high supplier specialization that shape its competitive intensity; niche tech capabilities raise barriers yet evolving commercial threats and talent pressures increase risk—unlock the full Porter's Five Forces Analysis to explore force-by-force ratings, visuals, and strategic implications tailored to SAIC.
Suppliers Bargaining Power
Cleared talent scarcity
SAIC depends on highly cleared engineers and analysts within a U.S. cleared workforce of about 3 million, a chronically tight labor pool; specialized certifications and polygraph rules concentrate bargaining power with individuals and staffing firms, driving wage inflation and retention premiums that raise input costs and can delay delivery and compress margins against SAIC’s ~$7.2B 2023 revenue.
Dependence on OEM platforms
Key SAIC solutions depend heavily on hyperscaler and defense OEM platforms—AWS held ~31% cloud IaaS market share in 2024, Azure ~23%, GCP ~11%—giving vendors control over pricing, licensing, and roadmap changes. Bundled support and proprietary standards from OEMs raise switching costs and lock integrators in. With the US defense budget near $858 billion in FY2024, SAIC must align tightly to partner ecosystems to remain competitive.
Niche subcontractors and SB partners
Program execution often requires niche small businesses for set-asides or unique know-how; the government-wide small business contracting goal remains 23% (SBA), concentrating leverage in those suppliers.
Limited alternatives in specialized domains raise bargaining power, with single-source subcontract awards common on classified and technical programs.
Flow-down compliance and oversight add coordination costs and administrative burden (often several percent of program value), and overreliance increases schedule and quality risk.
Classified tools and data dependencies
Access to secure facilities, datasets and specialized toolchains for SAIC are concentrated with a few cleared providers, giving them outsized leverage; FY2024 US defense budget was about 858 billion, concentrating classified spend among prime contractors. Scarcity, accreditation and multi‑month approval lead times elevate supplier influence and can delay program delivery, enabling suppliers to extract favorable contractual terms due to high substitution barriers.
- Concentration: top primes capture >60% of classified contracting
- Approval lag: multi‑month lead times for accreditations
- Barrier: limited cleared toolchain providers, high switching costs
Hardware lead times and export controls
~3M cleared labor hikes wages vs $7.2B defense firm
SAIC faces strong supplier leverage from a limited cleared workforce (~3M US cleared) driving wage inflation vs SAIC $7.2B 2023 revenue.
Hyperscalers (AWS ~31% 2024) and defense OEMs control platforms, licensing and switching costs.
Specialized small-business set‑asides and single‑source classified suppliers concentrate bargaining power (>60% prime share).
| Metric | Value | Impact |
|---|---|---|
| Cleared workforce | ~3M | Wage pressure |
| SAIC rev | $7.2B (2023) | Margin squeeze |
| Lead times | 6–18 mo | Schedule risk |
What is included in the product
Detailed Word Document
Porter's Five Forces analysis for Science Applications International uncovers competitive dynamics, supplier/buyer power, entry barriers, substitutes, and emerging threats shaping its defense and government services market position.
Customizable Excel Spreadsheet
A clear one-sheet Porter’s Five Forces for Science Applications International (SAIC) that visualizes competitive pressure with a spider chart, lets you customize force levels for evolving defense and tech markets, integrates into decks/Excel, and requires no macros—ready for quick strategic decisions.
Customers Bargaining Power
Dominant government customers
U.S. federal agencies drive concentrated demand for SAIC, accounting for over 90% of its business and roughly $7.0 billion in FY2024 revenue, with sophisticated procurement offices that press for lower prices and tighter SLAs. Wide use of IDIQ and GWAC contract vehicles amplifies price competition and reduces deal-by-deal negotiating leverage. Standardized payment terms, extended invoice reviews and audit rights further shift risk and cash-flow advantages to the buyer.
Switching costs vs mission risk
Integration depth and SAIC incumbency in federal programs create moderate-to-high switching costs, especially on multi-year IT and systems contracts frequently structured with 5-year base terms and option years. However, agencies commonly recompete task orders and IDIQs, enabling downward price pressure. FAR-mandated transition and handover plans reduce mission transition risk. Buyers therefore balance continuity versus price, sustaining bargaining power.
Procurement modalities (LPTA vs Best-Value)
Under LPTA price dominates procurement, compressing contractor margins and favoring low bids over innovation. Best-Value evaluations still weight past performance and technical merit, tempering pure price pressure and supporting higher-value firms. Agencies, including DoD with a $858 billion 2024 budget, can mix task orders to extract concessions. Evaluation flexibility further enhances buyer leverage in negotiations.
Budget cycles and appropriations
Federal budget timing (fiscal year begins Oct 1) and continuing resolutions, including CRs that extended into March 2024, create funding uncertainty that compresses award windows and negotiation leverage for contractors. Agencies routinely use option‑year decisions to extract improvements or change scope, while schedule slips shift scope and burn rates onto contractors. Buyers time awards to align with fiscal execution and favorable terms.
- CRs-2024: funding uncertainty
- OptionYears: leverage for agencies
- Slips: increased contractor burn rates
- AwardTiming: buyers optimize fiscal terms
Performance oversight and CPARS
Rigorous SLA and EVMS oversight enables remedies and fee withholds for underperformance, directly reducing contractor revenue and raising exit costs. As of 2024, CPARS remains the primary federal performance-rating tool across DoD and civilian agencies and materially influences source-selection and recompete decisions, disciplining contractors via lower past-performance ratings. Buyers can demand corrective action plans rapidly, accelerating remediation and preserving leverage. This governance framework thus strengthens buyer power over SAIC on awarded contracts.
- CPARS: primary federal tool in 2024
- SLA/EVMS: enables fee withholds and remedies
- Buyers: can demand fast corrective action
- Result: increased buyer leverage in awards
U.S. federal buyers drive >90% of revenue; DoD $858B and CRs heighten cash-flow risk
U.S. federal agencies drive over 90% of SAIC revenue (~$7.0B FY2024), with procurement teams enforcing lower prices and strict SLAs. IDIQ/GWAC vehicles and LPTA compress margins, while Best-Value and DoD's $858B 2024 budget allow task-order mix to extract concessions. CPARS, EVMS and CRs through March 2024 heighten buyer leverage and cash-flow risk.
| Metric | 2024 |
|---|---|
| Federal share | >90% |
| SAIC revenue | $7.0B |
| DoD budget | $858B |
| CRs | Extended into Mar 2024 |
| CPARS | Primary tool |
What You See Is What You Get
Science Applications International Porter's Five Forces Analysis
This preview shows the exact Science Applications International (SAIC) Porter's Five Forces analysis you'll receive immediately after purchase—no placeholders or mockups. The document is fully formatted and ready to download and use for strategic or investment decisions. What you see here is the complete deliverable, available instantly upon payment.











