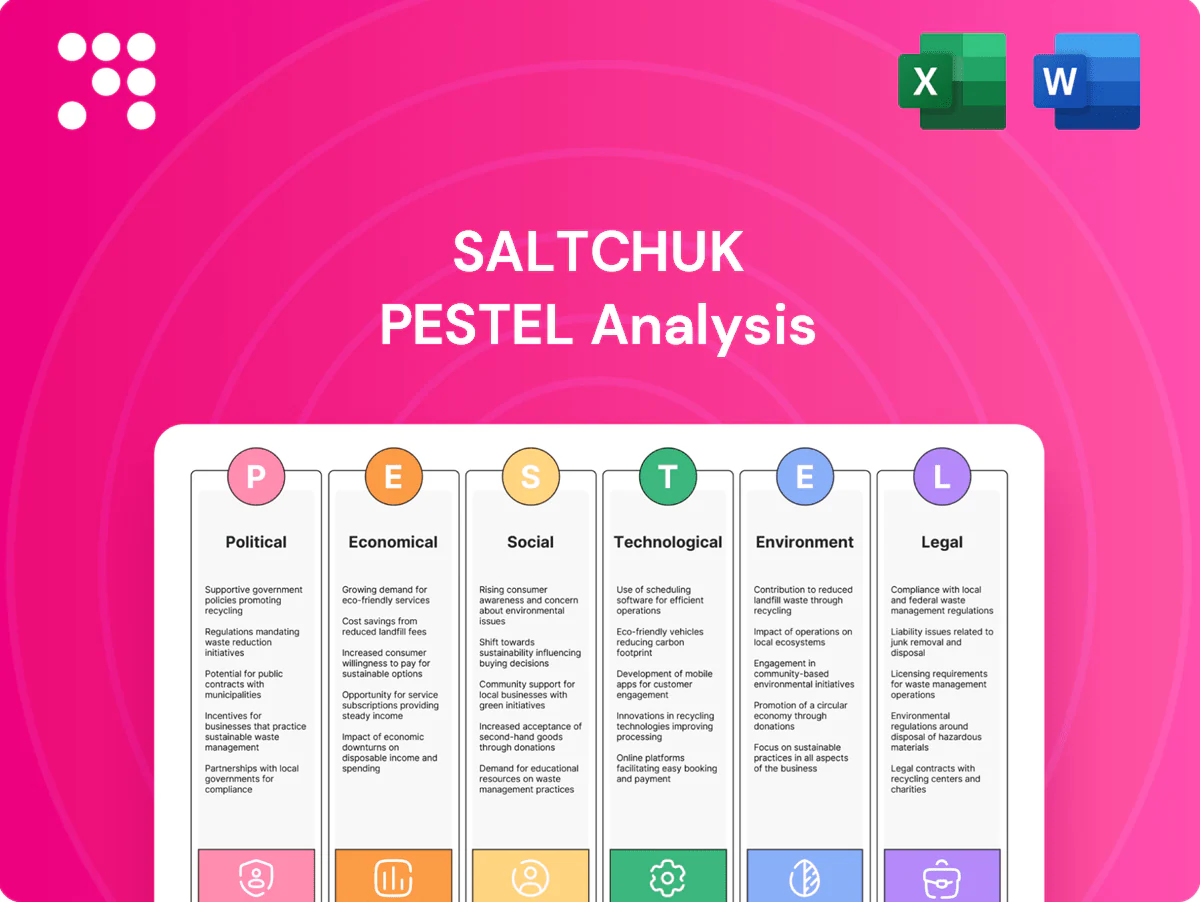
Saltchuk PESTLE Analysis

Your Competitive Advantage Starts with This Report
Unlock strategic insight with our PESTLE Analysis of Saltchuk—three to five clear-sentence highlights reveal how political, economic, social, technological, legal, and environmental forces shape its outlook. Ideal for investors and strategists, the full report delivers deep, actionable intelligence—purchase now to download the complete, editable analysis instantly.
Political factors

Jones Act exposure
The Jones Act of 1920 shapes fleet composition, routes, and competitive dynamics for Saltchuk by requiring US-flag, -built, and -crewed vessels on domestic routes. Compliance underpins stable domestic lanes but increases vessel acquisition and crew cost structures. Federal waivers issued after Hurricane Maria in 2017 and during other crises demonstrate how policy shifts can momentarily alter demand and pricing. Ongoing congressional scrutiny creates a medium regulatory risk.
Infrastructure funding
Federal and state investments—including the Bipartisan Infrastructure Law’s roughly $17 billion for ports, waterways and ferries—influence Saltchuk’s throughput and modal efficiency by funding dredging, intermodal links and highway access. Targeted grants lower terminal and electrification capex, enabling faster ROI on yard electrification and shore power. Delays or budget cuts create chokepoints that constrain growth, while active advocacy and public–private partnerships improve project pipeline visibility and timing.

Trade and tariff policy
North American merchandise trade (US-Canada-Mexico) was about $1.6 trillion in 2023 (US Census), directly driving Saltchuk’s maritime and logistics cargo volumes. Tariff measures such as the 2018 Section 232 steel (25%) and aluminum (10%) duties have shifted commodity flows and routing. Policy volatility raises forecasting complexity and inventory repositioning costs, while stable USMCA-era agreements enable long-term capacity planning.

Energy policy direction
Subsidies, blending mandates and carbon pricing compress marine and road fuel distribution margins—EU ETS averaged ~€85/t CO2 in 2024 while US SAF blender credits reached up to $1.75/gal, shifting returns toward low‑carbon fuels. Incentives for LNG, SAF and renewables are reshaping Saltchuk product mix; LNG terminal capex and supply contracts grow. Permitting timelines (typically 3–5 years for terminals) delay storage expansions and cashflow. Political transitions can flip tariff and subsidy regimes within a 1–2 year electoral cycle, abruptly changing portfolio economics.
- Carbon price: EU ETS ~€85/t (2024)
- SAF blender credit: up to $1.75/gal (2024)
- Permitting: 3–5 years typical
- Risk: policy shifts in 1–2 years
Local permitting and stakeholders
Port authorities, municipalities and indigenous governance collectively determine site access and operating hours for Saltchuk terminals; there are 574 federally recognized tribes in the U.S. (2023), so indigenous consultation is material. Community-benefit agreements raise upfront costs but secure social license. Zoning and NIMBY pressures commonly drive permit timelines of 12–24 months, so early engagement lowers project risk.
- Ports/municipalities: control access & hours
- Indigenous consultation: mandatory; 574 tribes (2023)
- Permitting: typically 12–24 months; CBA increases upfront cost but reduces opposition
Jones Act, port investment and carbon pricing reshape North American trade flows
Jones Act (1920) enforces US‑flagged domestic fleet, raising capex and crew costs; Bipartisan Infrastructure Law ~ $17B for ports improves throughput; North American trade ~$1.6T (2023) drives volume; carbon & fuel policy (EU ETS ~€85/t 2024; SAF credit up to $1.75/gal) plus permitting (3–5y) and 574 tribes raise regulatory and social‑license risk.
| Factor | Metric |
|---|---|
| Jones Act | 1920 |
| Ports funding | $17B |
| Trade | $1.6T (2023) |
| EU ETS | €85/t (2024) |
What is included in the product
 Detailed Word Document
Explores how macro-environmental forces affect Saltchuk across Political, Economic, Social, Technological, Environmental and Legal dimensions, with data-driven examples and forward-looking implications to inform strategy, risk management and investor communications.

 Customizable Excel Spreadsheet
A concise, visually segmented Saltchuk PESTLE summary that eases meeting prep and decision-making, allowing quick annotation for region- or business-specific context and seamless inclusion in presentations or shared planning decks.
Economic factors

Cyclical freight demand
GDP growth drives freight: IMF projected global GDP growth 3.1% in 2024, while industrial production and retail cycles directly move shipping volumes; weaker demand compresses rates and asset utilization—Drewry’s World Container Index was roughly 65% below 2021 peaks by 2024. Saltchuk’s diversification into essential services cushions volatility, and flexible capacity management preserves margins through cycles.
Fuel price volatility
Volatility in diesel, marine fuels and jet fuel—with Brent averaging roughly $85–95/bbl in 2024 and intra-year swings up to ~30%—directly lifts Saltchuk’s operating costs and compresses distribution revenues. Surcharges and hedging reduce exposure but leave residual price risk and basis mismatches. Wider crack spreads (occasionally ~$10–$20/bbl in 2024) alter downstream margins, and supply shocks force rapid repricing and inventory adjustments to protect cash flow.

Interest rates and capex
High rates (Fed funds 5.25–5.50% mid‑2025; US 10‑yr ~4.3%) raise the financed cost of vessels, aircraft and terminals. New A320neo list price ~110 million and ship newbuilds often run into tens of millions, boosting capex exposure. Lease versus buy shifts with credit spreads; private ownership permits longer horizons but enforces disciplined hurdle rates. Refinancing windows determine liquidity and growth timing.

Labor availability and costs
Pilot, mariner, driver, and technician shortages are pushing wage inflation across Saltchuk operations, with U.S. union membership at 10.1% (BLS 2023) and heavy/tractor-trailer driver median pay $48,310 (BLS May 2023) signaling upward cost pressure; robust training pipelines and apprenticeships act as strategic differentiators for retention and supply. Union dynamics affect productivity and continuity, while targeted automation can reduce long-run labor costs but requires material upfront CAPEX.
- Labor shortages: skill-specific (pilots, mariners, technicians)
- Wages rising: driver median $48,310 (BLS May 2023)
- Union context: 10.1% membership (BLS 2023)
- Mitigation: training pipelines, apprenticeships, automation (high CAPEX)
Supply chain normalization
Post-pandemic normalization shifted Saltchuk customers from just-in-time to higher safety stock and flexible routing; global container spot rates fell roughly 70–80% from 2021 peaks by 2024 (Drewry), but short-term disruptions can spike yields sharply. North American nearshoring expanded regional lanes, increasing Mexico-US trade volumes and shortening transit times. Excess capacity pressures rates; resilience and continuity services command 10–25% premiums in volatile windows.
- inventory: higher safety stock
- nearshoring: stronger N.A. lane flows
- rates: deep troughs vs 2021, spikes on disruption
- resilience: 10–25% premium
Jones Act, port investment and carbon pricing reshape North American trade flows
Global GDP ~3.1% (IMF 2024) drives freight demand; Drewry container index ~65% below 2021 peaks (2024). Brent averaged $85–95/bbl (2024), raising fuel costs despite hedges. Fed funds 5.25–5.50% (mid‑2025), US 10y ~4.3% heighten financing costs; labor shortages push wages up (driver median $48,310, BLS May 2023).
| Metric | Value |
|---|---|
| GDP growth (2024) | 3.1% |
| Brent (2024) | $85–95/bbl |
| Fed funds (mid‑2025) | 5.25–5.50% |
Preview Before You Purchase
Saltchuk PESTLE Analysis
The Saltchuk PESTLE Analysis preview shown here is the exact document you’ll receive after purchase—fully formatted and professionally structured. It contains the same content, layout, and strategic insights visible now, ready to download immediately after payment. No placeholders or teasers—this is the finished, ready-to-use file you’ll own upon checkout.

Your Competitive Advantage Starts with This Report
Unlock strategic insight with our PESTLE Analysis of Saltchuk—three to five clear-sentence highlights reveal how political, economic, social, technological, legal, and environmental forces shape its outlook. Ideal for investors and strategists, the full report delivers deep, actionable intelligence—purchase now to download the complete, editable analysis instantly.
Political factors
Jones Act exposure
The Jones Act of 1920 shapes fleet composition, routes, and competitive dynamics for Saltchuk by requiring US-flag, -built, and -crewed vessels on domestic routes. Compliance underpins stable domestic lanes but increases vessel acquisition and crew cost structures. Federal waivers issued after Hurricane Maria in 2017 and during other crises demonstrate how policy shifts can momentarily alter demand and pricing. Ongoing congressional scrutiny creates a medium regulatory risk.
Infrastructure funding
Federal and state investments—including the Bipartisan Infrastructure Law’s roughly $17 billion for ports, waterways and ferries—influence Saltchuk’s throughput and modal efficiency by funding dredging, intermodal links and highway access. Targeted grants lower terminal and electrification capex, enabling faster ROI on yard electrification and shore power. Delays or budget cuts create chokepoints that constrain growth, while active advocacy and public–private partnerships improve project pipeline visibility and timing.
Trade and tariff policy
North American merchandise trade (US-Canada-Mexico) was about $1.6 trillion in 2023 (US Census), directly driving Saltchuk’s maritime and logistics cargo volumes. Tariff measures such as the 2018 Section 232 steel (25%) and aluminum (10%) duties have shifted commodity flows and routing. Policy volatility raises forecasting complexity and inventory repositioning costs, while stable USMCA-era agreements enable long-term capacity planning.
Energy policy direction
Subsidies, blending mandates and carbon pricing compress marine and road fuel distribution margins—EU ETS averaged ~€85/t CO2 in 2024 while US SAF blender credits reached up to $1.75/gal, shifting returns toward low‑carbon fuels. Incentives for LNG, SAF and renewables are reshaping Saltchuk product mix; LNG terminal capex and supply contracts grow. Permitting timelines (typically 3–5 years for terminals) delay storage expansions and cashflow. Political transitions can flip tariff and subsidy regimes within a 1–2 year electoral cycle, abruptly changing portfolio economics.
- Carbon price: EU ETS ~€85/t (2024)
- SAF blender credit: up to $1.75/gal (2024)
- Permitting: 3–5 years typical
- Risk: policy shifts in 1–2 years
Local permitting and stakeholders
Port authorities, municipalities and indigenous governance collectively determine site access and operating hours for Saltchuk terminals; there are 574 federally recognized tribes in the U.S. (2023), so indigenous consultation is material. Community-benefit agreements raise upfront costs but secure social license. Zoning and NIMBY pressures commonly drive permit timelines of 12–24 months, so early engagement lowers project risk.
- Ports/municipalities: control access & hours
- Indigenous consultation: mandatory; 574 tribes (2023)
- Permitting: typically 12–24 months; CBA increases upfront cost but reduces opposition
Jones Act, port investment and carbon pricing reshape North American trade flows
Jones Act (1920) enforces US‑flagged domestic fleet, raising capex and crew costs; Bipartisan Infrastructure Law ~ $17B for ports improves throughput; North American trade ~$1.6T (2023) drives volume; carbon & fuel policy (EU ETS ~€85/t 2024; SAF credit up to $1.75/gal) plus permitting (3–5y) and 574 tribes raise regulatory and social‑license risk.
| Factor | Metric |
|---|---|
| Jones Act | 1920 |
| Ports funding | $17B |
| Trade | $1.6T (2023) |
| EU ETS | €85/t (2024) |
What is included in the product
Detailed Word Document
Explores how macro-environmental forces affect Saltchuk across Political, Economic, Social, Technological, Environmental and Legal dimensions, with data-driven examples and forward-looking implications to inform strategy, risk management and investor communications.
Customizable Excel Spreadsheet
A concise, visually segmented Saltchuk PESTLE summary that eases meeting prep and decision-making, allowing quick annotation for region- or business-specific context and seamless inclusion in presentations or shared planning decks.
Economic factors
Cyclical freight demand
GDP growth drives freight: IMF projected global GDP growth 3.1% in 2024, while industrial production and retail cycles directly move shipping volumes; weaker demand compresses rates and asset utilization—Drewry’s World Container Index was roughly 65% below 2021 peaks by 2024. Saltchuk’s diversification into essential services cushions volatility, and flexible capacity management preserves margins through cycles.
Fuel price volatility
Volatility in diesel, marine fuels and jet fuel—with Brent averaging roughly $85–95/bbl in 2024 and intra-year swings up to ~30%—directly lifts Saltchuk’s operating costs and compresses distribution revenues. Surcharges and hedging reduce exposure but leave residual price risk and basis mismatches. Wider crack spreads (occasionally ~$10–$20/bbl in 2024) alter downstream margins, and supply shocks force rapid repricing and inventory adjustments to protect cash flow.
Interest rates and capex
High rates (Fed funds 5.25–5.50% mid‑2025; US 10‑yr ~4.3%) raise the financed cost of vessels, aircraft and terminals. New A320neo list price ~110 million and ship newbuilds often run into tens of millions, boosting capex exposure. Lease versus buy shifts with credit spreads; private ownership permits longer horizons but enforces disciplined hurdle rates. Refinancing windows determine liquidity and growth timing.
Labor availability and costs
Pilot, mariner, driver, and technician shortages are pushing wage inflation across Saltchuk operations, with U.S. union membership at 10.1% (BLS 2023) and heavy/tractor-trailer driver median pay $48,310 (BLS May 2023) signaling upward cost pressure; robust training pipelines and apprenticeships act as strategic differentiators for retention and supply. Union dynamics affect productivity and continuity, while targeted automation can reduce long-run labor costs but requires material upfront CAPEX.
- Labor shortages: skill-specific (pilots, mariners, technicians)
- Wages rising: driver median $48,310 (BLS May 2023)
- Union context: 10.1% membership (BLS 2023)
- Mitigation: training pipelines, apprenticeships, automation (high CAPEX)
Supply chain normalization
Post-pandemic normalization shifted Saltchuk customers from just-in-time to higher safety stock and flexible routing; global container spot rates fell roughly 70–80% from 2021 peaks by 2024 (Drewry), but short-term disruptions can spike yields sharply. North American nearshoring expanded regional lanes, increasing Mexico-US trade volumes and shortening transit times. Excess capacity pressures rates; resilience and continuity services command 10–25% premiums in volatile windows.
- inventory: higher safety stock
- nearshoring: stronger N.A. lane flows
- rates: deep troughs vs 2021, spikes on disruption
- resilience: 10–25% premium
Jones Act, port investment and carbon pricing reshape North American trade flows
Global GDP ~3.1% (IMF 2024) drives freight demand; Drewry container index ~65% below 2021 peaks (2024). Brent averaged $85–95/bbl (2024), raising fuel costs despite hedges. Fed funds 5.25–5.50% (mid‑2025), US 10y ~4.3% heighten financing costs; labor shortages push wages up (driver median $48,310, BLS May 2023).
| Metric | Value |
|---|---|
| GDP growth (2024) | 3.1% |
| Brent (2024) | $85–95/bbl |
| Fed funds (mid‑2025) | 5.25–5.50% |
Preview Before You Purchase
Saltchuk PESTLE Analysis
The Saltchuk PESTLE Analysis preview shown here is the exact document you’ll receive after purchase—fully formatted and professionally structured. It contains the same content, layout, and strategic insights visible now, ready to download immediately after payment. No placeholders or teasers—this is the finished, ready-to-use file you’ll own upon checkout.
Original: $10.00
-65%$10.00
$3.50Description
Your Competitive Advantage Starts with This Report
Unlock strategic insight with our PESTLE Analysis of Saltchuk—three to five clear-sentence highlights reveal how political, economic, social, technological, legal, and environmental forces shape its outlook. Ideal for investors and strategists, the full report delivers deep, actionable intelligence—purchase now to download the complete, editable analysis instantly.
Political factors
Jones Act exposure
The Jones Act of 1920 shapes fleet composition, routes, and competitive dynamics for Saltchuk by requiring US-flag, -built, and -crewed vessels on domestic routes. Compliance underpins stable domestic lanes but increases vessel acquisition and crew cost structures. Federal waivers issued after Hurricane Maria in 2017 and during other crises demonstrate how policy shifts can momentarily alter demand and pricing. Ongoing congressional scrutiny creates a medium regulatory risk.
Infrastructure funding
Federal and state investments—including the Bipartisan Infrastructure Law’s roughly $17 billion for ports, waterways and ferries—influence Saltchuk’s throughput and modal efficiency by funding dredging, intermodal links and highway access. Targeted grants lower terminal and electrification capex, enabling faster ROI on yard electrification and shore power. Delays or budget cuts create chokepoints that constrain growth, while active advocacy and public–private partnerships improve project pipeline visibility and timing.
Trade and tariff policy
North American merchandise trade (US-Canada-Mexico) was about $1.6 trillion in 2023 (US Census), directly driving Saltchuk’s maritime and logistics cargo volumes. Tariff measures such as the 2018 Section 232 steel (25%) and aluminum (10%) duties have shifted commodity flows and routing. Policy volatility raises forecasting complexity and inventory repositioning costs, while stable USMCA-era agreements enable long-term capacity planning.
Energy policy direction
Subsidies, blending mandates and carbon pricing compress marine and road fuel distribution margins—EU ETS averaged ~€85/t CO2 in 2024 while US SAF blender credits reached up to $1.75/gal, shifting returns toward low‑carbon fuels. Incentives for LNG, SAF and renewables are reshaping Saltchuk product mix; LNG terminal capex and supply contracts grow. Permitting timelines (typically 3–5 years for terminals) delay storage expansions and cashflow. Political transitions can flip tariff and subsidy regimes within a 1–2 year electoral cycle, abruptly changing portfolio economics.
- Carbon price: EU ETS ~€85/t (2024)
- SAF blender credit: up to $1.75/gal (2024)
- Permitting: 3–5 years typical
- Risk: policy shifts in 1–2 years
Local permitting and stakeholders
Port authorities, municipalities and indigenous governance collectively determine site access and operating hours for Saltchuk terminals; there are 574 federally recognized tribes in the U.S. (2023), so indigenous consultation is material. Community-benefit agreements raise upfront costs but secure social license. Zoning and NIMBY pressures commonly drive permit timelines of 12–24 months, so early engagement lowers project risk.
- Ports/municipalities: control access & hours
- Indigenous consultation: mandatory; 574 tribes (2023)
- Permitting: typically 12–24 months; CBA increases upfront cost but reduces opposition
Jones Act, port investment and carbon pricing reshape North American trade flows
Jones Act (1920) enforces US‑flagged domestic fleet, raising capex and crew costs; Bipartisan Infrastructure Law ~ $17B for ports improves throughput; North American trade ~$1.6T (2023) drives volume; carbon & fuel policy (EU ETS ~€85/t 2024; SAF credit up to $1.75/gal) plus permitting (3–5y) and 574 tribes raise regulatory and social‑license risk.
| Factor | Metric |
|---|---|
| Jones Act | 1920 |
| Ports funding | $17B |
| Trade | $1.6T (2023) |
| EU ETS | €85/t (2024) |
What is included in the product
Detailed Word Document
Explores how macro-environmental forces affect Saltchuk across Political, Economic, Social, Technological, Environmental and Legal dimensions, with data-driven examples and forward-looking implications to inform strategy, risk management and investor communications.
Customizable Excel Spreadsheet
A concise, visually segmented Saltchuk PESTLE summary that eases meeting prep and decision-making, allowing quick annotation for region- or business-specific context and seamless inclusion in presentations or shared planning decks.
Economic factors
Cyclical freight demand
GDP growth drives freight: IMF projected global GDP growth 3.1% in 2024, while industrial production and retail cycles directly move shipping volumes; weaker demand compresses rates and asset utilization—Drewry’s World Container Index was roughly 65% below 2021 peaks by 2024. Saltchuk’s diversification into essential services cushions volatility, and flexible capacity management preserves margins through cycles.
Fuel price volatility
Volatility in diesel, marine fuels and jet fuel—with Brent averaging roughly $85–95/bbl in 2024 and intra-year swings up to ~30%—directly lifts Saltchuk’s operating costs and compresses distribution revenues. Surcharges and hedging reduce exposure but leave residual price risk and basis mismatches. Wider crack spreads (occasionally ~$10–$20/bbl in 2024) alter downstream margins, and supply shocks force rapid repricing and inventory adjustments to protect cash flow.
Interest rates and capex
High rates (Fed funds 5.25–5.50% mid‑2025; US 10‑yr ~4.3%) raise the financed cost of vessels, aircraft and terminals. New A320neo list price ~110 million and ship newbuilds often run into tens of millions, boosting capex exposure. Lease versus buy shifts with credit spreads; private ownership permits longer horizons but enforces disciplined hurdle rates. Refinancing windows determine liquidity and growth timing.
Labor availability and costs
Pilot, mariner, driver, and technician shortages are pushing wage inflation across Saltchuk operations, with U.S. union membership at 10.1% (BLS 2023) and heavy/tractor-trailer driver median pay $48,310 (BLS May 2023) signaling upward cost pressure; robust training pipelines and apprenticeships act as strategic differentiators for retention and supply. Union dynamics affect productivity and continuity, while targeted automation can reduce long-run labor costs but requires material upfront CAPEX.
- Labor shortages: skill-specific (pilots, mariners, technicians)
- Wages rising: driver median $48,310 (BLS May 2023)
- Union context: 10.1% membership (BLS 2023)
- Mitigation: training pipelines, apprenticeships, automation (high CAPEX)
Supply chain normalization
Post-pandemic normalization shifted Saltchuk customers from just-in-time to higher safety stock and flexible routing; global container spot rates fell roughly 70–80% from 2021 peaks by 2024 (Drewry), but short-term disruptions can spike yields sharply. North American nearshoring expanded regional lanes, increasing Mexico-US trade volumes and shortening transit times. Excess capacity pressures rates; resilience and continuity services command 10–25% premiums in volatile windows.
- inventory: higher safety stock
- nearshoring: stronger N.A. lane flows
- rates: deep troughs vs 2021, spikes on disruption
- resilience: 10–25% premium
Jones Act, port investment and carbon pricing reshape North American trade flows
Global GDP ~3.1% (IMF 2024) drives freight demand; Drewry container index ~65% below 2021 peaks (2024). Brent averaged $85–95/bbl (2024), raising fuel costs despite hedges. Fed funds 5.25–5.50% (mid‑2025), US 10y ~4.3% heighten financing costs; labor shortages push wages up (driver median $48,310, BLS May 2023).
| Metric | Value |
|---|---|
| GDP growth (2024) | 3.1% |
| Brent (2024) | $85–95/bbl |
| Fed funds (mid‑2025) | 5.25–5.50% |
Preview Before You Purchase
Saltchuk PESTLE Analysis
The Saltchuk PESTLE Analysis preview shown here is the exact document you’ll receive after purchase—fully formatted and professionally structured. It contains the same content, layout, and strategic insights visible now, ready to download immediately after payment. No placeholders or teasers—this is the finished, ready-to-use file you’ll own upon checkout.











