Sammons Enterprises PESTLE Analysis

Make Smarter Strategic Decisions with a Complete PESTEL View
Discover how political shifts, economic cycles, social trends, technological advances, legal changes, and environmental pressures are shaping Sammons Enterprises’ strategy and risk profile in our concise PESTLE snapshot. This analysis highlights high-impact external forces and practical implications for investors and managers. Purchase the full PESTLE for the complete, editable report and actionable recommendations to inform your next move.
Political factors

Regulatory complexity across sectors
Operating across financial services, industrials, real estate and infrastructure exposes Sammons to overlapping federal, 50 state and numerous local policies that can change capital requirements, product approvals and operating permits. Policy shifts — including implementation of the $1.2 trillion Bipartisan Infrastructure Law — can materially affect project permitting and financing. Coordinated governance and targeted lobbying improve foresight and adaptation to rule changes. A diversified portfolio helps buffer single-sector political shocks.
Infrastructure spending priorities
Government budgets and PPP frameworks determine project pipelines and returns; US Bipartisan Infrastructure Law commits about 1.2 trillion USD with roughly 550 billion USD in new spending, including ~110 billion USD for roads and bridges. Shifts in US and foreign agendas — against a global infrastructure gap the Global Infrastructure Hub estimates at ~15 trillion USD to 2040 — change demand for equipment, construction and concessions. Elections and fiscal cycles (notably 2024–25) add timing and scope volatility. Aligning with priority sectors such as transportation and energy can secure long-duration cash flows via concessions commonly lasting 20–30 years.

Trade policy and supply chains
Tariffs such as the US 25% steel and 10% aluminum duties and the 2018 Section 301 tariffs covering about $370bn of Chinese goods lift industrial equipment costs and alter sourcing. Reshoring incentives—CHIPS Act $52bn and the Inflation Reduction Act’s ~$369bn clean-energy investments—shift supplier economics and capacity. Trade-agreement changes lengthen lead times for subsidiaries, while sanctions (eg, post-2022 Russia measures) constrain counterparties. Proactive supplier diversification reduces disruption risk.

Tax policy and incentives
Corporate tax at 21% and changes to bonus depreciation (60% in 2024, 40% in 2025 under current law) plus clean energy investment tax credits (up to 30 under the Inflation Reduction Act) materially shift Sammons Enterprises capital allocation and acquisition valuations; real estate and energy incentives can boost after-tax returns. Policy reversals or sunset provisions create planning risk, so scenario planning preserves hurdle rates.
- Corporate tax: 21%
- Bonus depreciation: 60% (2024), 40% (2025)
- Energy ITC: up to 30%
Foreign investment and antitrust scrutiny
Large acquisitions by Sammons Enterprises can trigger antitrust reviews and, for sensitive assets, CFIUS oversight; extended approvals have delayed synergies and raised transaction costs, with global FDI falling about 12% in 2023 to roughly $1.1 trillion per UNCTAD, tightening deal windows and capital discipline.
- Prioritize remedies and carve-outs to reduce approval risk
- Maintain competitive conduct across subsidiaries
- Plan for extended approval timelines and higher integration costs
Multi-jurisdictional rules and infrastructure policies reshape capital, timelines and supply risk
Sammons faces multi-jurisdictional rule changes that shift capital, permitting and product approvals; infrastructure and energy policy (eg Bipartisan Infrastructure Law) drive project pipelines and long-duration concession returns. Tariffs, reshoring incentives and tax provisions alter costs and valuations; antitrust/CFIUS extend transaction timelines, requiring scenario planning and supplier diversification.
| Metric | Value |
|---|---|
| Bipartisan Infrastructure | 1.2 trillion USD (≈550B new) |
| Global infra gap | ~15 trillion USD to 2040 |
| FDI 2023 | ~1.1 trillion USD (‑12%) |
| Corp tax | 21% |
| Bonus depr | 60% (2024), 40% (2025) |
| Energy ITC | Up to 30% |
What is included in the product
 Detailed Word Document
Explores how Political, Economic, Social, Technological, Environmental and Legal forces uniquely affect Sammons Enterprises, with data‑backed trends and industry‑specific examples to identify risks and opportunities; tailored for executives, advisors and investors to support strategic planning, funding pitches and scenario design.

 Customizable Excel Spreadsheet
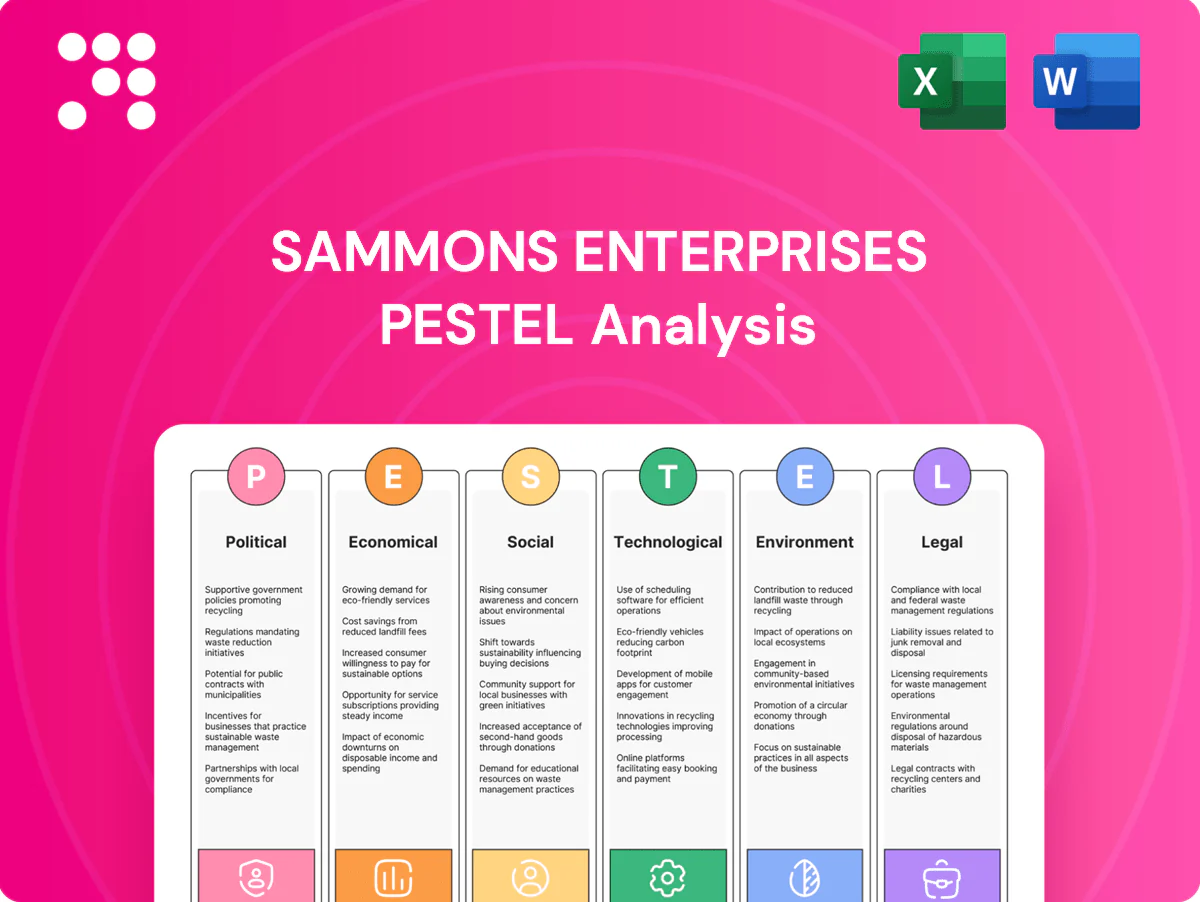
A concise, visually segmented PESTLE summary of Sammons Enterprises for quick reference in meetings or presentations, easily dropped into PowerPoints or shared across teams. Editable notes let users tailor regional or business-line risks, supporting focused discussions on external threats and market positioning.
Economic factors

Interest rates and credit cycles
Rising funding costs (Fed funds 5.25–5.50% as of mid‑2025) constrain Sammons Enterprises acquisition capacity and increase portfolio-company leverage costs, with corporate borrowing roughly 150–200 bps higher than 2021. Higher rates compress valuations but boost yields on cash and fixed-income holdings. Credit tightening and wider IG/HY spreads slow M&A yet favor well‑capitalized buyers. Active liability management preserves liquidity and strategic flexibility.
Inflation and input costs
Sustained inflation (US CPI 3.4% in 2024) raises equipment, labor (average hourly earnings +4.2% in 2024) and construction material costs (ENR index ~+2% YoY), pressuring margins. Robust pricing power and indexed contracts can protect margins; real estate leases with escalators allow cost pass-through. Strong procurement discipline and commodity hedging stabilize cash flows and cap input volatility.

Real estate and housing cycles
Occupancy, rent growth and cap rates remain the primary drivers of property returns: cap rates ranged in 2024–H1 2025 roughly 4–6% for industrial, 4–5% for multifamily and 7–9% for office, directly influencing valuation. Regional migration to Sunbelt metros and concentrated new supply create wide performance dispersion across markets. Careful development timing and pre-leasing lower downturn exposure, while diversified asset types smooth portfolio cyclicality.

Industrial demand and capital spending
OEM orders for Sammons Enterprises track manufacturing and infrastructure capex trends; federal IIJA funding of 1.2 trillion USD (about 550 billion USD in new spending) continues to support countercyclical projects that can offset private capex weakness in 2024–25, while downturns compress volumes but backlogs and service revenues provide cushions.
- OEM orders ≈ tied to manufacturing & infrastructure capex
- IIJA 1.2 trillion USD (550 billion new) supports countercyclical projects
- Backlogs & service revenue cushion downturns
- Balanced aftermarket vs equipment sales reduces volatility
Labor markets and productivity
Tight US labor markets (3.7% unemployment in 2024) have pushed wage costs across Sammons Enterprises subsidiaries, with average hourly earnings up roughly 4.1% year‑over‑year in 2024, stressing margins. Automation and process improvements can offset wage pressure by raising productivity and reducing labor intensity. A persistent scarcity of skilled trades is extending infrastructure timelines, while workforce development partnerships and apprenticeships are expanding the talent pipeline.
- unemployment: 3.7% (2024)
- wage growth: ~4.1% Y/Y (2024)
- skilled trades shortage: delays infrastructure projects
- workforce partnerships: expand apprenticeship/talent pipelines
Multi-jurisdictional rules and infrastructure policies reshape capital, timelines and supply risk
Higher funding costs (Fed funds 5.25–5.50% mid‑2025) and wider credit spreads compress valuations but favor well‑capitalized buyers; CPI 3.4% (2024) and wage growth ~4.1% pressure margins while automation and indexed contracts mitigate impacts. Cap rates 2024–H1 2025: industrial 4–6%, multifamily 4–5%, office 7–9%; IIJA 1.2 trillion (≈550B new) supports infrastructure demand.
| Metric | Value |
|---|---|
| Fed funds (mid‑2025) | 5.25–5.50% |
| CPI (2024) | 3.4% |
| Unemployment (2024) | 3.7% |
| Wage growth (2024) | ~4.1% Y/Y |
| Cap rates | Ind 4–6% / MF 4–5% / Off 7–9% |
| IIJA | 1.2T (≈550B new) |
What You See Is What You Get
Sammons Enterprises PESTLE Analysis
The Sammons Enterprises PESTLE Analysis preview shown here is the exact document you’ll receive after purchase—fully formatted and ready to use. It presents comprehensive political, economic, social, technological, legal, and environmental insights tailored to Sammons Enterprises, with no placeholders or teasers. The layout, content, and structure visible are exactly what you’ll download immediately after buying.

Make Smarter Strategic Decisions with a Complete PESTEL View
Discover how political shifts, economic cycles, social trends, technological advances, legal changes, and environmental pressures are shaping Sammons Enterprises’ strategy and risk profile in our concise PESTLE snapshot. This analysis highlights high-impact external forces and practical implications for investors and managers. Purchase the full PESTLE for the complete, editable report and actionable recommendations to inform your next move.
Political factors
Regulatory complexity across sectors
Operating across financial services, industrials, real estate and infrastructure exposes Sammons to overlapping federal, 50 state and numerous local policies that can change capital requirements, product approvals and operating permits. Policy shifts — including implementation of the $1.2 trillion Bipartisan Infrastructure Law — can materially affect project permitting and financing. Coordinated governance and targeted lobbying improve foresight and adaptation to rule changes. A diversified portfolio helps buffer single-sector political shocks.
Infrastructure spending priorities
Government budgets and PPP frameworks determine project pipelines and returns; US Bipartisan Infrastructure Law commits about 1.2 trillion USD with roughly 550 billion USD in new spending, including ~110 billion USD for roads and bridges. Shifts in US and foreign agendas — against a global infrastructure gap the Global Infrastructure Hub estimates at ~15 trillion USD to 2040 — change demand for equipment, construction and concessions. Elections and fiscal cycles (notably 2024–25) add timing and scope volatility. Aligning with priority sectors such as transportation and energy can secure long-duration cash flows via concessions commonly lasting 20–30 years.
Trade policy and supply chains
Tariffs such as the US 25% steel and 10% aluminum duties and the 2018 Section 301 tariffs covering about $370bn of Chinese goods lift industrial equipment costs and alter sourcing. Reshoring incentives—CHIPS Act $52bn and the Inflation Reduction Act’s ~$369bn clean-energy investments—shift supplier economics and capacity. Trade-agreement changes lengthen lead times for subsidiaries, while sanctions (eg, post-2022 Russia measures) constrain counterparties. Proactive supplier diversification reduces disruption risk.
Tax policy and incentives
Corporate tax at 21% and changes to bonus depreciation (60% in 2024, 40% in 2025 under current law) plus clean energy investment tax credits (up to 30 under the Inflation Reduction Act) materially shift Sammons Enterprises capital allocation and acquisition valuations; real estate and energy incentives can boost after-tax returns. Policy reversals or sunset provisions create planning risk, so scenario planning preserves hurdle rates.
- Corporate tax: 21%
- Bonus depreciation: 60% (2024), 40% (2025)
- Energy ITC: up to 30%
Foreign investment and antitrust scrutiny
Large acquisitions by Sammons Enterprises can trigger antitrust reviews and, for sensitive assets, CFIUS oversight; extended approvals have delayed synergies and raised transaction costs, with global FDI falling about 12% in 2023 to roughly $1.1 trillion per UNCTAD, tightening deal windows and capital discipline.
- Prioritize remedies and carve-outs to reduce approval risk
- Maintain competitive conduct across subsidiaries
- Plan for extended approval timelines and higher integration costs
Multi-jurisdictional rules and infrastructure policies reshape capital, timelines and supply risk
Sammons faces multi-jurisdictional rule changes that shift capital, permitting and product approvals; infrastructure and energy policy (eg Bipartisan Infrastructure Law) drive project pipelines and long-duration concession returns. Tariffs, reshoring incentives and tax provisions alter costs and valuations; antitrust/CFIUS extend transaction timelines, requiring scenario planning and supplier diversification.
| Metric | Value |
|---|---|
| Bipartisan Infrastructure | 1.2 trillion USD (≈550B new) |
| Global infra gap | ~15 trillion USD to 2040 |
| FDI 2023 | ~1.1 trillion USD (‑12%) |
| Corp tax | 21% |
| Bonus depr | 60% (2024), 40% (2025) |
| Energy ITC | Up to 30% |
What is included in the product
Detailed Word Document
Explores how Political, Economic, Social, Technological, Environmental and Legal forces uniquely affect Sammons Enterprises, with data‑backed trends and industry‑specific examples to identify risks and opportunities; tailored for executives, advisors and investors to support strategic planning, funding pitches and scenario design.
Customizable Excel Spreadsheet
A concise, visually segmented PESTLE summary of Sammons Enterprises for quick reference in meetings or presentations, easily dropped into PowerPoints or shared across teams. Editable notes let users tailor regional or business-line risks, supporting focused discussions on external threats and market positioning.
Economic factors
Interest rates and credit cycles
Rising funding costs (Fed funds 5.25–5.50% as of mid‑2025) constrain Sammons Enterprises acquisition capacity and increase portfolio-company leverage costs, with corporate borrowing roughly 150–200 bps higher than 2021. Higher rates compress valuations but boost yields on cash and fixed-income holdings. Credit tightening and wider IG/HY spreads slow M&A yet favor well‑capitalized buyers. Active liability management preserves liquidity and strategic flexibility.
Inflation and input costs
Sustained inflation (US CPI 3.4% in 2024) raises equipment, labor (average hourly earnings +4.2% in 2024) and construction material costs (ENR index ~+2% YoY), pressuring margins. Robust pricing power and indexed contracts can protect margins; real estate leases with escalators allow cost pass-through. Strong procurement discipline and commodity hedging stabilize cash flows and cap input volatility.
Real estate and housing cycles
Occupancy, rent growth and cap rates remain the primary drivers of property returns: cap rates ranged in 2024–H1 2025 roughly 4–6% for industrial, 4–5% for multifamily and 7–9% for office, directly influencing valuation. Regional migration to Sunbelt metros and concentrated new supply create wide performance dispersion across markets. Careful development timing and pre-leasing lower downturn exposure, while diversified asset types smooth portfolio cyclicality.
Industrial demand and capital spending
OEM orders for Sammons Enterprises track manufacturing and infrastructure capex trends; federal IIJA funding of 1.2 trillion USD (about 550 billion USD in new spending) continues to support countercyclical projects that can offset private capex weakness in 2024–25, while downturns compress volumes but backlogs and service revenues provide cushions.
- OEM orders ≈ tied to manufacturing & infrastructure capex
- IIJA 1.2 trillion USD (550 billion new) supports countercyclical projects
- Backlogs & service revenue cushion downturns
- Balanced aftermarket vs equipment sales reduces volatility
Labor markets and productivity
Tight US labor markets (3.7% unemployment in 2024) have pushed wage costs across Sammons Enterprises subsidiaries, with average hourly earnings up roughly 4.1% year‑over‑year in 2024, stressing margins. Automation and process improvements can offset wage pressure by raising productivity and reducing labor intensity. A persistent scarcity of skilled trades is extending infrastructure timelines, while workforce development partnerships and apprenticeships are expanding the talent pipeline.
- unemployment: 3.7% (2024)
- wage growth: ~4.1% Y/Y (2024)
- skilled trades shortage: delays infrastructure projects
- workforce partnerships: expand apprenticeship/talent pipelines
Multi-jurisdictional rules and infrastructure policies reshape capital, timelines and supply risk
Higher funding costs (Fed funds 5.25–5.50% mid‑2025) and wider credit spreads compress valuations but favor well‑capitalized buyers; CPI 3.4% (2024) and wage growth ~4.1% pressure margins while automation and indexed contracts mitigate impacts. Cap rates 2024–H1 2025: industrial 4–6%, multifamily 4–5%, office 7–9%; IIJA 1.2 trillion (≈550B new) supports infrastructure demand.
| Metric | Value |
|---|---|
| Fed funds (mid‑2025) | 5.25–5.50% |
| CPI (2024) | 3.4% |
| Unemployment (2024) | 3.7% |
| Wage growth (2024) | ~4.1% Y/Y |
| Cap rates | Ind 4–6% / MF 4–5% / Off 7–9% |
| IIJA | 1.2T (≈550B new) |
What You See Is What You Get
Sammons Enterprises PESTLE Analysis
The Sammons Enterprises PESTLE Analysis preview shown here is the exact document you’ll receive after purchase—fully formatted and ready to use. It presents comprehensive political, economic, social, technological, legal, and environmental insights tailored to Sammons Enterprises, with no placeholders or teasers. The layout, content, and structure visible are exactly what you’ll download immediately after buying.
Original: $10.00
-65%$10.00
$3.50Description
Make Smarter Strategic Decisions with a Complete PESTEL View
Discover how political shifts, economic cycles, social trends, technological advances, legal changes, and environmental pressures are shaping Sammons Enterprises’ strategy and risk profile in our concise PESTLE snapshot. This analysis highlights high-impact external forces and practical implications for investors and managers. Purchase the full PESTLE for the complete, editable report and actionable recommendations to inform your next move.
Political factors
Regulatory complexity across sectors
Operating across financial services, industrials, real estate and infrastructure exposes Sammons to overlapping federal, 50 state and numerous local policies that can change capital requirements, product approvals and operating permits. Policy shifts — including implementation of the $1.2 trillion Bipartisan Infrastructure Law — can materially affect project permitting and financing. Coordinated governance and targeted lobbying improve foresight and adaptation to rule changes. A diversified portfolio helps buffer single-sector political shocks.
Infrastructure spending priorities
Government budgets and PPP frameworks determine project pipelines and returns; US Bipartisan Infrastructure Law commits about 1.2 trillion USD with roughly 550 billion USD in new spending, including ~110 billion USD for roads and bridges. Shifts in US and foreign agendas — against a global infrastructure gap the Global Infrastructure Hub estimates at ~15 trillion USD to 2040 — change demand for equipment, construction and concessions. Elections and fiscal cycles (notably 2024–25) add timing and scope volatility. Aligning with priority sectors such as transportation and energy can secure long-duration cash flows via concessions commonly lasting 20–30 years.
Trade policy and supply chains
Tariffs such as the US 25% steel and 10% aluminum duties and the 2018 Section 301 tariffs covering about $370bn of Chinese goods lift industrial equipment costs and alter sourcing. Reshoring incentives—CHIPS Act $52bn and the Inflation Reduction Act’s ~$369bn clean-energy investments—shift supplier economics and capacity. Trade-agreement changes lengthen lead times for subsidiaries, while sanctions (eg, post-2022 Russia measures) constrain counterparties. Proactive supplier diversification reduces disruption risk.
Tax policy and incentives
Corporate tax at 21% and changes to bonus depreciation (60% in 2024, 40% in 2025 under current law) plus clean energy investment tax credits (up to 30 under the Inflation Reduction Act) materially shift Sammons Enterprises capital allocation and acquisition valuations; real estate and energy incentives can boost after-tax returns. Policy reversals or sunset provisions create planning risk, so scenario planning preserves hurdle rates.
- Corporate tax: 21%
- Bonus depreciation: 60% (2024), 40% (2025)
- Energy ITC: up to 30%
Foreign investment and antitrust scrutiny
Large acquisitions by Sammons Enterprises can trigger antitrust reviews and, for sensitive assets, CFIUS oversight; extended approvals have delayed synergies and raised transaction costs, with global FDI falling about 12% in 2023 to roughly $1.1 trillion per UNCTAD, tightening deal windows and capital discipline.
- Prioritize remedies and carve-outs to reduce approval risk
- Maintain competitive conduct across subsidiaries
- Plan for extended approval timelines and higher integration costs
Multi-jurisdictional rules and infrastructure policies reshape capital, timelines and supply risk
Sammons faces multi-jurisdictional rule changes that shift capital, permitting and product approvals; infrastructure and energy policy (eg Bipartisan Infrastructure Law) drive project pipelines and long-duration concession returns. Tariffs, reshoring incentives and tax provisions alter costs and valuations; antitrust/CFIUS extend transaction timelines, requiring scenario planning and supplier diversification.
| Metric | Value |
|---|---|
| Bipartisan Infrastructure | 1.2 trillion USD (≈550B new) |
| Global infra gap | ~15 trillion USD to 2040 |
| FDI 2023 | ~1.1 trillion USD (‑12%) |
| Corp tax | 21% |
| Bonus depr | 60% (2024), 40% (2025) |
| Energy ITC | Up to 30% |
What is included in the product
Detailed Word Document
Explores how Political, Economic, Social, Technological, Environmental and Legal forces uniquely affect Sammons Enterprises, with data‑backed trends and industry‑specific examples to identify risks and opportunities; tailored for executives, advisors and investors to support strategic planning, funding pitches and scenario design.
Customizable Excel Spreadsheet
A concise, visually segmented PESTLE summary of Sammons Enterprises for quick reference in meetings or presentations, easily dropped into PowerPoints or shared across teams. Editable notes let users tailor regional or business-line risks, supporting focused discussions on external threats and market positioning.
Economic factors
Interest rates and credit cycles
Rising funding costs (Fed funds 5.25–5.50% as of mid‑2025) constrain Sammons Enterprises acquisition capacity and increase portfolio-company leverage costs, with corporate borrowing roughly 150–200 bps higher than 2021. Higher rates compress valuations but boost yields on cash and fixed-income holdings. Credit tightening and wider IG/HY spreads slow M&A yet favor well‑capitalized buyers. Active liability management preserves liquidity and strategic flexibility.
Inflation and input costs
Sustained inflation (US CPI 3.4% in 2024) raises equipment, labor (average hourly earnings +4.2% in 2024) and construction material costs (ENR index ~+2% YoY), pressuring margins. Robust pricing power and indexed contracts can protect margins; real estate leases with escalators allow cost pass-through. Strong procurement discipline and commodity hedging stabilize cash flows and cap input volatility.
Real estate and housing cycles
Occupancy, rent growth and cap rates remain the primary drivers of property returns: cap rates ranged in 2024–H1 2025 roughly 4–6% for industrial, 4–5% for multifamily and 7–9% for office, directly influencing valuation. Regional migration to Sunbelt metros and concentrated new supply create wide performance dispersion across markets. Careful development timing and pre-leasing lower downturn exposure, while diversified asset types smooth portfolio cyclicality.
Industrial demand and capital spending
OEM orders for Sammons Enterprises track manufacturing and infrastructure capex trends; federal IIJA funding of 1.2 trillion USD (about 550 billion USD in new spending) continues to support countercyclical projects that can offset private capex weakness in 2024–25, while downturns compress volumes but backlogs and service revenues provide cushions.
- OEM orders ≈ tied to manufacturing & infrastructure capex
- IIJA 1.2 trillion USD (550 billion new) supports countercyclical projects
- Backlogs & service revenue cushion downturns
- Balanced aftermarket vs equipment sales reduces volatility
Labor markets and productivity
Tight US labor markets (3.7% unemployment in 2024) have pushed wage costs across Sammons Enterprises subsidiaries, with average hourly earnings up roughly 4.1% year‑over‑year in 2024, stressing margins. Automation and process improvements can offset wage pressure by raising productivity and reducing labor intensity. A persistent scarcity of skilled trades is extending infrastructure timelines, while workforce development partnerships and apprenticeships are expanding the talent pipeline.
- unemployment: 3.7% (2024)
- wage growth: ~4.1% Y/Y (2024)
- skilled trades shortage: delays infrastructure projects
- workforce partnerships: expand apprenticeship/talent pipelines
Multi-jurisdictional rules and infrastructure policies reshape capital, timelines and supply risk
Higher funding costs (Fed funds 5.25–5.50% mid‑2025) and wider credit spreads compress valuations but favor well‑capitalized buyers; CPI 3.4% (2024) and wage growth ~4.1% pressure margins while automation and indexed contracts mitigate impacts. Cap rates 2024–H1 2025: industrial 4–6%, multifamily 4–5%, office 7–9%; IIJA 1.2 trillion (≈550B new) supports infrastructure demand.
| Metric | Value |
|---|---|
| Fed funds (mid‑2025) | 5.25–5.50% |
| CPI (2024) | 3.4% |
| Unemployment (2024) | 3.7% |
| Wage growth (2024) | ~4.1% Y/Y |
| Cap rates | Ind 4–6% / MF 4–5% / Off 7–9% |
| IIJA | 1.2T (≈550B new) |
What You See Is What You Get
Sammons Enterprises PESTLE Analysis
The Sammons Enterprises PESTLE Analysis preview shown here is the exact document you’ll receive after purchase—fully formatted and ready to use. It presents comprehensive political, economic, social, technological, legal, and environmental insights tailored to Sammons Enterprises, with no placeholders or teasers. The layout, content, and structure visible are exactly what you’ll download immediately after buying.











