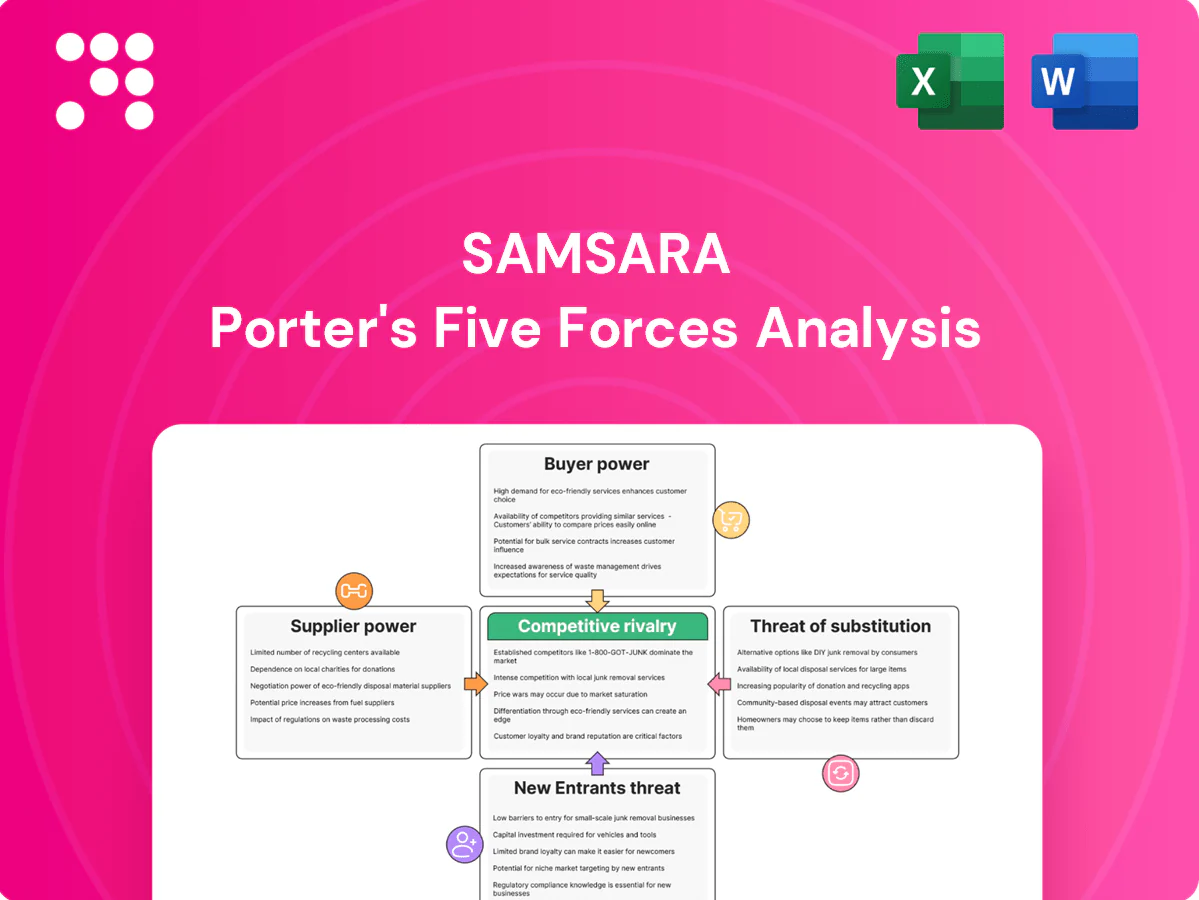
Samsara Porter's Five Forces Analysis

Don't Miss the Bigger Picture
Samsara’s Porter's Five Forces snapshot highlights intense rivalry, growing buyer power, and rising substitute risks as IoT platforms scale, while supplier leverage and entry threats hinge on hardware integration and regulatory barriers. This brief flags strategic pressures and competitive levers to watch. Unlock the full Porter's Five Forces Analysis to explore force-by-force ratings, visuals, and actionable recommendations.
Suppliers Bargaining Power

Concentrated hardware components
Camera sensors, AI chipsets and telematics modules are concentrated among Tier-1 suppliers (Sony holds roughly 40%+ of CMOS image sensors in 2024; NVIDIA/Qualcomm/Ambarella dominate edge AI SoCs), raising switching costs and lead-time risk. Specialized HDR sensors and edge AI SoCs create bottlenecks; semiconductor lead times spiked to 20+ weeks in 2021–22 and stayed elevated into 2024. Post-pandemic consolidation tightened allocations. Samsara mitigates with multi-sourcing and modular design, but dependence remains material.
Cloud and connectivity dependency
SaaS delivery for Samsara depends on hyperscale clouds that held >65% of the global IaaS/PaaS market in 2024 (Synergy Research Group) and on global cellular carriers with pricing leverage; data egress fees and IoT SIM tariffs materially compress gross margins. Long-term carrier/cloud contracts reduce volatility but constrain renegotiation agility. Hyperscaler/carrier outages in 2024 directly threatened SLAs and customer trust.

Contract manufacturing and logistics
EMS partners materially shape device cost, yield and ramp speed—top 5 EMS firms held roughly 60% of global EMS revenue in 2024, concentrating pricing power and capacity. Regional capacity constraints and events in 2024 produced multi-week device backlogs that propagated into customer fulfillment delays. Quality variance drove higher returns and service costs, while geographic diversification and VMI programs mitigated risk, yet bargaining power still tilts to large EMS firms.

Software third-party data and maps
Samsara relies on specialized vendors for maps, geocoding, video codecs and compliance databases (vendors include Google Maps, Mapbox, HERE, AWS Rekognition), and Samsara reported $1.05B revenue in FY2024; API pricing shifts can compress unit economics and proprietary datasets reduce switching flexibility, while long‑term licenses and usage optimization partially offset supplier leverage.
- Maps/geocoding: third‑party dependency
- Video codecs: bandwidth/storage cost exposure
- API pricing risk: compresses margins
- Licenses/optimization: partial mitigation
Standards, certifications, and compliance
Regulatory certifications and the FMCSA ELD mandate (in force since December 2017) obligate ELDs and safety devices for carriers and affect over 3 million commercial drivers, requiring approved components and accredited labs. A limited pool of accredited vendors can charge premia and use certification timelines as schedule leverage. Pre-certified modules reduce deployment friction but may lock Samsara into specific hardware/software designs.
- Regulatory certifications: mandatory for market access
- ELD mandate: affects >3 million drivers
- Limited accredited vendors: pricing power
- Certification timelines: supplier schedule leverage
- Pre-certified modules: lower friction, design lock-in
Supplier concentration (CMOS ~40%), 20+ week delays; hyperscalers >65% IaaS
Supplier concentration (Sony ~40% CMOS; NVIDIA/Qualcomm/Ambarella lead AI SoCs) raises switching costs and lead‑time risk (20+ week semiconductor delays in 2021–24). Hyperscalers held >65% IaaS (2024), and top‑5 EMS ~60% revenue share, giving carriers/clouds/EMS pricing leverage versus Samsara (FY2024 rev $1.05B).
| Metric | 2024 |
|---|---|
| Sony CMOS share | ~40%+ |
| Hyperscaler IaaS | >65% |
| Top‑5 EMS | ~60% |
| Samsara FY2024 rev | $1.05B |
What is included in the product
 Detailed Word Document
Concise Porter's Five Forces assessment of Samsara that evaluates competitive rivalry, buyer and supplier power, threat of new entrants and substitutes, and highlights disruptive risks and strategic defenses tailored to Samsara’s IoT/telemetry ecosystem.

 Customizable Excel Spreadsheet
A clear one-sheet Porter's Five Forces for Samsara that instantly visualizes strategic pressure with a radar chart, lets you customize force intensity for evolving market events, and swaps in your own data—ready to paste into decks or embed in dashboards without macros.
Customers Bargaining Power

Enterprise fleets with RFP muscle
Enterprise fleets in logistics, construction and utilities run competitive RFPs that extract volume discounts by bundling telematics, cameras and workflow software, increasing buyer leverage in 2024. Multi-year, multi-asset contracts further amplify negotiating power and reduce vendor switching incentives. Strong referenceability and demonstrable ROI are decisive to win these deals.
Switching costs from installed hardware
Installed Samsara gateways and cameras create material replacement costs that lower buyer power after deployment; Samsara reported roughly $1.01B revenue and about 64,000 customers in fiscal 2024, underscoring scale and installed base effects. Customers leverage this stickiness to negotiate favorable renewals, while data migration and driver re-training add friction and time costs. Contract terms and hardware-financing options materially shift customer leverage during renewals.

Price sensitivity and TCO focus
Buyers benchmark ARPU vs rivals and legacy GPS, demanding clear ROI—telemetry can cut fuel 5–15%, boost uptime 10–20% and yield insurance/safety savings ~8–12%. During downturns discount pressure and seat rationalization rise (often 15–25%), forcing vendors to defend ARPU. Tiered packaging and per-seat metrics help align perceived value to constrained budgets and prove payback timelines.

Integration and data ownership demands
Customers require open APIs into ERP, ELD, maintenance, and payroll, pressing for data portability and custom dashboards; vendor responsiveness to integrations drives buyer stickiness, and Samsara reported $821.6 million revenue in 2024 highlighting platform traction. Strong ecosystem support reduces perceived vendor lock-in.
- APIs: ERP/ELD/maintenance/payroll
- Data portability: custom dashboards
- Responsiveness → stickiness
- Ecosystem lowers lock-in
Service quality and uptime expectations
24/7 fleets demand high SLAs, rapid device replacement and proactive support; any outage or camera failure can trigger credits or churn risk, and proof of AI accuracy materially affects perceived value. Samsara’s scale (FY2024 revenue about 1.06 billion) raises expectations for enterprise-grade reliability, while robust QA and field service reduce buyer leverage from incidents.
- High SLA pressure
- Rapid RMA/replacement
- Outages → credits/churn
- AI accuracy = value
- QA/field service lowers leverage
Enterprise RFPs and scale raise buyer leverage; ROI: fuel 5–15%, uptime 10–20%
Enterprise RFPs and multi-year, multi-asset contracts increase buyer leverage; volume discounts are common. Samsara scale (FY2024 revenue $1.06B; ~64,000 customers) creates post-deployment stickiness that lowers buyer power. Buyers demand clear ROI (fuel 5–15%, uptime 10–20%, insurance 8–12%); downturns drive 15–25% seat rationalization. APIs, SLAs, rapid RMA and AI accuracy materially shape renewal leverage.
| Metric | Value |
|---|---|
| FY2024 revenue | $1.06B |
| Customers | ~64,000 |
| Fuel savings | 5–15% |
| Uptime | 10–20% |
| Discount pressure | 15–25% |
What You See Is What You Get
Samsara Porter's Five Forces Analysis
This preview shows the exact Samsara Porter's Five Forces Analysis you'll receive immediately after purchase—no surprises, no placeholders. The document is fully formatted and ready to download, covering competitive rivalry, buyer and supplier power, and the threats of new entrants and substitutes, with clear strategic implications. You’ll get instant access to this complete, ready-to-use analysis.

Don't Miss the Bigger Picture
Samsara’s Porter's Five Forces snapshot highlights intense rivalry, growing buyer power, and rising substitute risks as IoT platforms scale, while supplier leverage and entry threats hinge on hardware integration and regulatory barriers. This brief flags strategic pressures and competitive levers to watch. Unlock the full Porter's Five Forces Analysis to explore force-by-force ratings, visuals, and actionable recommendations.
Suppliers Bargaining Power
Concentrated hardware components
Camera sensors, AI chipsets and telematics modules are concentrated among Tier-1 suppliers (Sony holds roughly 40%+ of CMOS image sensors in 2024; NVIDIA/Qualcomm/Ambarella dominate edge AI SoCs), raising switching costs and lead-time risk. Specialized HDR sensors and edge AI SoCs create bottlenecks; semiconductor lead times spiked to 20+ weeks in 2021–22 and stayed elevated into 2024. Post-pandemic consolidation tightened allocations. Samsara mitigates with multi-sourcing and modular design, but dependence remains material.
Cloud and connectivity dependency
SaaS delivery for Samsara depends on hyperscale clouds that held >65% of the global IaaS/PaaS market in 2024 (Synergy Research Group) and on global cellular carriers with pricing leverage; data egress fees and IoT SIM tariffs materially compress gross margins. Long-term carrier/cloud contracts reduce volatility but constrain renegotiation agility. Hyperscaler/carrier outages in 2024 directly threatened SLAs and customer trust.
Contract manufacturing and logistics
EMS partners materially shape device cost, yield and ramp speed—top 5 EMS firms held roughly 60% of global EMS revenue in 2024, concentrating pricing power and capacity. Regional capacity constraints and events in 2024 produced multi-week device backlogs that propagated into customer fulfillment delays. Quality variance drove higher returns and service costs, while geographic diversification and VMI programs mitigated risk, yet bargaining power still tilts to large EMS firms.
Software third-party data and maps
Samsara relies on specialized vendors for maps, geocoding, video codecs and compliance databases (vendors include Google Maps, Mapbox, HERE, AWS Rekognition), and Samsara reported $1.05B revenue in FY2024; API pricing shifts can compress unit economics and proprietary datasets reduce switching flexibility, while long‑term licenses and usage optimization partially offset supplier leverage.
- Maps/geocoding: third‑party dependency
- Video codecs: bandwidth/storage cost exposure
- API pricing risk: compresses margins
- Licenses/optimization: partial mitigation
Standards, certifications, and compliance
Regulatory certifications and the FMCSA ELD mandate (in force since December 2017) obligate ELDs and safety devices for carriers and affect over 3 million commercial drivers, requiring approved components and accredited labs. A limited pool of accredited vendors can charge premia and use certification timelines as schedule leverage. Pre-certified modules reduce deployment friction but may lock Samsara into specific hardware/software designs.
- Regulatory certifications: mandatory for market access
- ELD mandate: affects >3 million drivers
- Limited accredited vendors: pricing power
- Certification timelines: supplier schedule leverage
- Pre-certified modules: lower friction, design lock-in
Supplier concentration (CMOS ~40%), 20+ week delays; hyperscalers >65% IaaS
Supplier concentration (Sony ~40% CMOS; NVIDIA/Qualcomm/Ambarella lead AI SoCs) raises switching costs and lead‑time risk (20+ week semiconductor delays in 2021–24). Hyperscalers held >65% IaaS (2024), and top‑5 EMS ~60% revenue share, giving carriers/clouds/EMS pricing leverage versus Samsara (FY2024 rev $1.05B).
| Metric | 2024 |
|---|---|
| Sony CMOS share | ~40%+ |
| Hyperscaler IaaS | >65% |
| Top‑5 EMS | ~60% |
| Samsara FY2024 rev | $1.05B |
What is included in the product
Detailed Word Document
Concise Porter's Five Forces assessment of Samsara that evaluates competitive rivalry, buyer and supplier power, threat of new entrants and substitutes, and highlights disruptive risks and strategic defenses tailored to Samsara’s IoT/telemetry ecosystem.
Customizable Excel Spreadsheet
A clear one-sheet Porter's Five Forces for Samsara that instantly visualizes strategic pressure with a radar chart, lets you customize force intensity for evolving market events, and swaps in your own data—ready to paste into decks or embed in dashboards without macros.
Customers Bargaining Power
Enterprise fleets with RFP muscle
Enterprise fleets in logistics, construction and utilities run competitive RFPs that extract volume discounts by bundling telematics, cameras and workflow software, increasing buyer leverage in 2024. Multi-year, multi-asset contracts further amplify negotiating power and reduce vendor switching incentives. Strong referenceability and demonstrable ROI are decisive to win these deals.
Switching costs from installed hardware
Installed Samsara gateways and cameras create material replacement costs that lower buyer power after deployment; Samsara reported roughly $1.01B revenue and about 64,000 customers in fiscal 2024, underscoring scale and installed base effects. Customers leverage this stickiness to negotiate favorable renewals, while data migration and driver re-training add friction and time costs. Contract terms and hardware-financing options materially shift customer leverage during renewals.
Price sensitivity and TCO focus
Buyers benchmark ARPU vs rivals and legacy GPS, demanding clear ROI—telemetry can cut fuel 5–15%, boost uptime 10–20% and yield insurance/safety savings ~8–12%. During downturns discount pressure and seat rationalization rise (often 15–25%), forcing vendors to defend ARPU. Tiered packaging and per-seat metrics help align perceived value to constrained budgets and prove payback timelines.
Integration and data ownership demands
Customers require open APIs into ERP, ELD, maintenance, and payroll, pressing for data portability and custom dashboards; vendor responsiveness to integrations drives buyer stickiness, and Samsara reported $821.6 million revenue in 2024 highlighting platform traction. Strong ecosystem support reduces perceived vendor lock-in.
- APIs: ERP/ELD/maintenance/payroll
- Data portability: custom dashboards
- Responsiveness → stickiness
- Ecosystem lowers lock-in
Service quality and uptime expectations
24/7 fleets demand high SLAs, rapid device replacement and proactive support; any outage or camera failure can trigger credits or churn risk, and proof of AI accuracy materially affects perceived value. Samsara’s scale (FY2024 revenue about 1.06 billion) raises expectations for enterprise-grade reliability, while robust QA and field service reduce buyer leverage from incidents.
- High SLA pressure
- Rapid RMA/replacement
- Outages → credits/churn
- AI accuracy = value
- QA/field service lowers leverage
Enterprise RFPs and scale raise buyer leverage; ROI: fuel 5–15%, uptime 10–20%
Enterprise RFPs and multi-year, multi-asset contracts increase buyer leverage; volume discounts are common. Samsara scale (FY2024 revenue $1.06B; ~64,000 customers) creates post-deployment stickiness that lowers buyer power. Buyers demand clear ROI (fuel 5–15%, uptime 10–20%, insurance 8–12%); downturns drive 15–25% seat rationalization. APIs, SLAs, rapid RMA and AI accuracy materially shape renewal leverage.
| Metric | Value |
|---|---|
| FY2024 revenue | $1.06B |
| Customers | ~64,000 |
| Fuel savings | 5–15% |
| Uptime | 10–20% |
| Discount pressure | 15–25% |
What You See Is What You Get
Samsara Porter's Five Forces Analysis
This preview shows the exact Samsara Porter's Five Forces Analysis you'll receive immediately after purchase—no surprises, no placeholders. The document is fully formatted and ready to download, covering competitive rivalry, buyer and supplier power, and the threats of new entrants and substitutes, with clear strategic implications. You’ll get instant access to this complete, ready-to-use analysis.
Original: $10.00
-65%$10.00
$3.50Description
Don't Miss the Bigger Picture
Samsara’s Porter's Five Forces snapshot highlights intense rivalry, growing buyer power, and rising substitute risks as IoT platforms scale, while supplier leverage and entry threats hinge on hardware integration and regulatory barriers. This brief flags strategic pressures and competitive levers to watch. Unlock the full Porter's Five Forces Analysis to explore force-by-force ratings, visuals, and actionable recommendations.
Suppliers Bargaining Power
Concentrated hardware components
Camera sensors, AI chipsets and telematics modules are concentrated among Tier-1 suppliers (Sony holds roughly 40%+ of CMOS image sensors in 2024; NVIDIA/Qualcomm/Ambarella dominate edge AI SoCs), raising switching costs and lead-time risk. Specialized HDR sensors and edge AI SoCs create bottlenecks; semiconductor lead times spiked to 20+ weeks in 2021–22 and stayed elevated into 2024. Post-pandemic consolidation tightened allocations. Samsara mitigates with multi-sourcing and modular design, but dependence remains material.
Cloud and connectivity dependency
SaaS delivery for Samsara depends on hyperscale clouds that held >65% of the global IaaS/PaaS market in 2024 (Synergy Research Group) and on global cellular carriers with pricing leverage; data egress fees and IoT SIM tariffs materially compress gross margins. Long-term carrier/cloud contracts reduce volatility but constrain renegotiation agility. Hyperscaler/carrier outages in 2024 directly threatened SLAs and customer trust.
Contract manufacturing and logistics
EMS partners materially shape device cost, yield and ramp speed—top 5 EMS firms held roughly 60% of global EMS revenue in 2024, concentrating pricing power and capacity. Regional capacity constraints and events in 2024 produced multi-week device backlogs that propagated into customer fulfillment delays. Quality variance drove higher returns and service costs, while geographic diversification and VMI programs mitigated risk, yet bargaining power still tilts to large EMS firms.
Software third-party data and maps
Samsara relies on specialized vendors for maps, geocoding, video codecs and compliance databases (vendors include Google Maps, Mapbox, HERE, AWS Rekognition), and Samsara reported $1.05B revenue in FY2024; API pricing shifts can compress unit economics and proprietary datasets reduce switching flexibility, while long‑term licenses and usage optimization partially offset supplier leverage.
- Maps/geocoding: third‑party dependency
- Video codecs: bandwidth/storage cost exposure
- API pricing risk: compresses margins
- Licenses/optimization: partial mitigation
Standards, certifications, and compliance
Regulatory certifications and the FMCSA ELD mandate (in force since December 2017) obligate ELDs and safety devices for carriers and affect over 3 million commercial drivers, requiring approved components and accredited labs. A limited pool of accredited vendors can charge premia and use certification timelines as schedule leverage. Pre-certified modules reduce deployment friction but may lock Samsara into specific hardware/software designs.
- Regulatory certifications: mandatory for market access
- ELD mandate: affects >3 million drivers
- Limited accredited vendors: pricing power
- Certification timelines: supplier schedule leverage
- Pre-certified modules: lower friction, design lock-in
Supplier concentration (CMOS ~40%), 20+ week delays; hyperscalers >65% IaaS
Supplier concentration (Sony ~40% CMOS; NVIDIA/Qualcomm/Ambarella lead AI SoCs) raises switching costs and lead‑time risk (20+ week semiconductor delays in 2021–24). Hyperscalers held >65% IaaS (2024), and top‑5 EMS ~60% revenue share, giving carriers/clouds/EMS pricing leverage versus Samsara (FY2024 rev $1.05B).
| Metric | 2024 |
|---|---|
| Sony CMOS share | ~40%+ |
| Hyperscaler IaaS | >65% |
| Top‑5 EMS | ~60% |
| Samsara FY2024 rev | $1.05B |
What is included in the product
Detailed Word Document
Concise Porter's Five Forces assessment of Samsara that evaluates competitive rivalry, buyer and supplier power, threat of new entrants and substitutes, and highlights disruptive risks and strategic defenses tailored to Samsara’s IoT/telemetry ecosystem.
Customizable Excel Spreadsheet
A clear one-sheet Porter's Five Forces for Samsara that instantly visualizes strategic pressure with a radar chart, lets you customize force intensity for evolving market events, and swaps in your own data—ready to paste into decks or embed in dashboards without macros.
Customers Bargaining Power
Enterprise fleets with RFP muscle
Enterprise fleets in logistics, construction and utilities run competitive RFPs that extract volume discounts by bundling telematics, cameras and workflow software, increasing buyer leverage in 2024. Multi-year, multi-asset contracts further amplify negotiating power and reduce vendor switching incentives. Strong referenceability and demonstrable ROI are decisive to win these deals.
Switching costs from installed hardware
Installed Samsara gateways and cameras create material replacement costs that lower buyer power after deployment; Samsara reported roughly $1.01B revenue and about 64,000 customers in fiscal 2024, underscoring scale and installed base effects. Customers leverage this stickiness to negotiate favorable renewals, while data migration and driver re-training add friction and time costs. Contract terms and hardware-financing options materially shift customer leverage during renewals.
Price sensitivity and TCO focus
Buyers benchmark ARPU vs rivals and legacy GPS, demanding clear ROI—telemetry can cut fuel 5–15%, boost uptime 10–20% and yield insurance/safety savings ~8–12%. During downturns discount pressure and seat rationalization rise (often 15–25%), forcing vendors to defend ARPU. Tiered packaging and per-seat metrics help align perceived value to constrained budgets and prove payback timelines.
Integration and data ownership demands
Customers require open APIs into ERP, ELD, maintenance, and payroll, pressing for data portability and custom dashboards; vendor responsiveness to integrations drives buyer stickiness, and Samsara reported $821.6 million revenue in 2024 highlighting platform traction. Strong ecosystem support reduces perceived vendor lock-in.
- APIs: ERP/ELD/maintenance/payroll
- Data portability: custom dashboards
- Responsiveness → stickiness
- Ecosystem lowers lock-in
Service quality and uptime expectations
24/7 fleets demand high SLAs, rapid device replacement and proactive support; any outage or camera failure can trigger credits or churn risk, and proof of AI accuracy materially affects perceived value. Samsara’s scale (FY2024 revenue about 1.06 billion) raises expectations for enterprise-grade reliability, while robust QA and field service reduce buyer leverage from incidents.
- High SLA pressure
- Rapid RMA/replacement
- Outages → credits/churn
- AI accuracy = value
- QA/field service lowers leverage
Enterprise RFPs and scale raise buyer leverage; ROI: fuel 5–15%, uptime 10–20%
Enterprise RFPs and multi-year, multi-asset contracts increase buyer leverage; volume discounts are common. Samsara scale (FY2024 revenue $1.06B; ~64,000 customers) creates post-deployment stickiness that lowers buyer power. Buyers demand clear ROI (fuel 5–15%, uptime 10–20%, insurance 8–12%); downturns drive 15–25% seat rationalization. APIs, SLAs, rapid RMA and AI accuracy materially shape renewal leverage.
| Metric | Value |
|---|---|
| FY2024 revenue | $1.06B |
| Customers | ~64,000 |
| Fuel savings | 5–15% |
| Uptime | 10–20% |
| Discount pressure | 15–25% |
What You See Is What You Get
Samsara Porter's Five Forces Analysis
This preview shows the exact Samsara Porter's Five Forces Analysis you'll receive immediately after purchase—no surprises, no placeholders. The document is fully formatted and ready to download, covering competitive rivalry, buyer and supplier power, and the threats of new entrants and substitutes, with clear strategic implications. You’ll get instant access to this complete, ready-to-use analysis.











