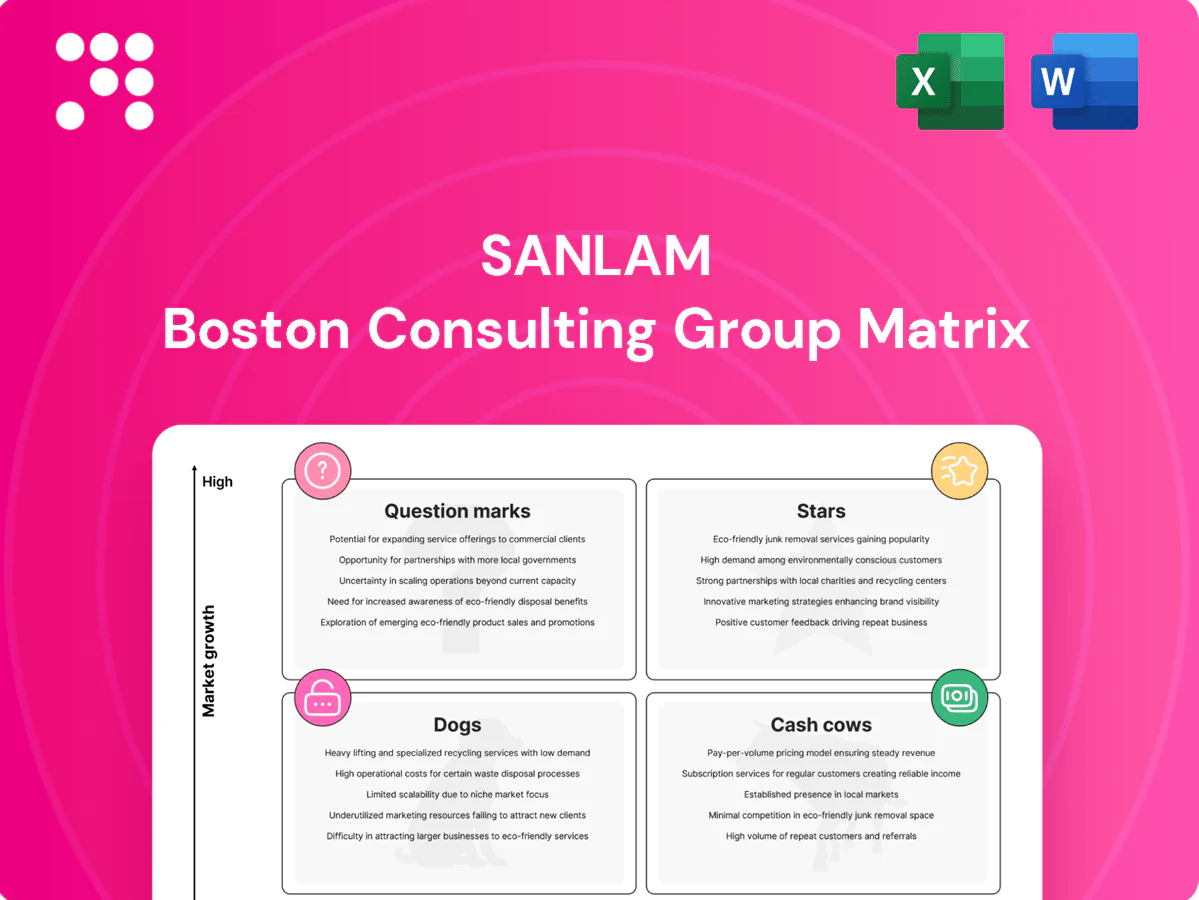
Sanlam Boston Consulting Group Matrix

Download Your Competitive Advantage
Curious where Sanlam’s products sit—Stars, Cash Cows, Dogs, or Question Marks? This snapshot hints at their market muscle, but the full Sanlam BCG Matrix gives you quadrant-by-quadrant clarity, data-backed recommendations, and a ready-to-present Word report plus an Excel summary. Skip the guesswork: purchase the complete analysis to see which offerings to scale, defend, divest, or rethink, and get strategic moves you can act on today.
Stars

Pan‑African P&C (SanlamAllianz)
Pan‑African P&C (SanlamAllianz) targets high-growth markets where insurance penetration remains below 3% of GDP as of 2024, and Sanlam leverages the Allianz JV to secure strong positions. It leads in several African countries but requires heavy investment in distribution, brand building and regulatory execution. The business is cash hungry today, yet scale economics should improve as the footprint matures. Keep feeding it — this is the engine to become tomorrow’s cash cow.
Retail Life outside South Africa
Fast-growing middle-income segments across Africa are increasingly buying protection and funeral cover, and Sanlam maintains a solid share in priority markets. Growth consumes cash in sales forces, underwriting technology, and claims operations. Returns are set to improve as lapse rates normalize and persistency holds. Stay invested to defend share while the market expands.

Bancassurance and telco channels
Partnership distribution is scaling quickly for Sanlam: embedded bancassurance and telco funnels show high conversion and much lower CAC once live, supported by over 1 billion global mobile money accounts by 2024. Sanlam has meaningful bank and wallet access in growth markets but needs product fit, data and smoother onboarding. Funding integrations can tip adoption into a dominant funnel.

Corporate & SME insurance across Africa
Infrastructure, trade, and SME formalization are spiking demand for commercial lines across Africa; African Development Bank estimates an annual infrastructure financing gap of $130–170 billion. Sanlam’s underwriting capacity and alliances give it a credible edge in capacity and distribution. Scaling requires capital, reinsurance, and risk engineering — not cheap. Leadership today converts into annuity premiums tomorrow.
- Capital intensive
- Reinsurance dependent
- Risk engineering required
- Annuity premium growth
Wealth & retirement platforms in growth markets
Wealth and retirement platforms are accelerating as pension systems formalize across growth markets; Sanlam, listed on the JSE (SLM) and operating in about 34 countries, leverages its brand and advice footprint for an early lead in asset gathering.
Ongoing investment in platform technology, compliance, and advisor productivity is required to scale now and lock in lifetime client value; focus on platform spend and adviser enablement will protect margins as competition intensifies.
- Asset gathering: early lead in formalizing pension markets
- Scale: Sanlam present ~34 countries, JSE: SLM
- Requires: platform, compliance, advisor productivity spend
- Goal: lock lifetime client value via scale
Pan‑African P&C & wealth: scale needs heavy invest; partnerships lower CAC
Sanlam Stars (Pan‑African P&C, wealth platforms) target low‑penetration markets (<3% insurance penetration in 2024), operating in ~34 countries and requiring heavy upfront distribution and tech investment; cash‑hungry now, scale should drive annuity premiums and improved returns. Partnerships (bancassurance/telco) and 1bn mobile money accounts (2024) lower CAC and accelerate conversion.
| Metric | Value (2024) |
|---|---|
| Countries | ~34 |
| Insurance penetration | <3% GDP |
| Mobile money accounts | ~1bn |
| Infra financing gap | $130–170bn p.a. |
What is included in the product
 Detailed Word Document
Concise assessment of Sanlam’s products across Stars, Cash Cows, Question Marks and Dogs, with investment and divestment recommendations.

 Customizable Excel Spreadsheet
One-page Sanlam BCG Matrix highlighting unit positions to simplify portfolio decisions and speed C-suite reviews.
Cash Cows

South Africa Individual Life & Savings
South Africa Individual Life & Savings is a large, loyal book with strong market share in a mature personal-risk and savings market, generating high margins and predictable lapse patterns that deliver steady cash flow. Low incremental promo spend is required because distribution is already built, enabling disciplined pricing and service focus. Maintain service and profitability and milk excess cash to fund Sanlam’s growth bets; Sanlam’s group AUM exceeds R1.2 trillion (2024).
Group Risk & Employee Benefits (SA)
Group Risk & Employee Benefits (SA) holds a defensible share through sticky employer relationships and scale underwriting, supported by robust admin and actuarial engines. Operating leverage is high, yielding strong cash conversion despite modest top-line growth. Priority actions: optimise claims management, sharpen fee structures and harvest cash flows. The business remains a classic cash cow within Sanlam’s portfolio.

Santam South Africa (Short‑Term)
Santam South Africa is the market leader in a mature P&C market, generating steady cash with gross written premiums of about ZAR 33.0bn in 2024 and a disciplined combined ratio of c.96.9% in 2024; cyclical exposure exists but the franchise delivers consistent cash over the cycle. Investment is targeted at efficiency and claims tech rather than market share land‑grabs, preserving the combined ratio edge and free cash flow.

South Africa Investment Management
South Africa Investment Management anchors Sanlams BCG matrix as a cash cow with established mandates, brand trust and scale in core funds, supporting roughly R1.0 trillion in group AUM (2024) and delivering resilient fee income despite modest net new money flows.
- Established mandates: long‑dated institutional contracts
- Brand trust: leading domestic retail and institutional footprint
- Fees: stable recurring revenue, margin expansion via ops tune‑ups
- Capex light: savings fund higher‑growth adjacencies
Advice & Distribution Network (SA)
Deep advisor relationships and multichannel coverage in SA sustain a 6,500‑advisor network; 2024 cross‑sell rates reached 28% supporting steady lead flow and proven wallet share expansion.
Incremental spend remained low at under 3% of Advice & Distribution revenue in 2024; maintain high productivity and strict compliance to harvest referral economics.
- Network: 6,500 advisors (2024)
- Cross‑sell: 28% (2024)
- Incremental spend: <3% of revenue (2024)
- Focus: productivity, compliance, referral harvesting
2024 cash engines: Life, Investment, short-term insurance & advisers deliver steady high-margin cash
Sanlam cash cows (2024) deliver steady high-margin cash: SA Life & Savings (group AUM R1.2tn) and SA Investment Mgmt (R1.0tn) provide recurring fees; Santam SA (GWP ZAR33.0bn; combined ratio c.96.9%) and Group Risk/EB yield strong cash conversion; Advice network (6,500 advisors, 28% cross‑sell) keeps incremental spend <3%.
| Business | Key 2024 metrics |
|---|---|
| SA Life & Savings | Group AUM R1.2tn |
| SA Investment Mgmt | R1.0tn AUM |
| Santam SA | GWP ZAR33.0bn; CR 96.9% |
| Advice & Distribution | 6,500 advisors; 28% cross‑sell; spend <3% |
Preview = Final Product
Sanlam BCG Matrix
The file you're previewing on this page is the exact Sanlam BCG Matrix report you'll receive after purchase. No watermarks, no demo content—just a fully formatted, analysis-ready document crafted for strategic clarity and decision-making. After purchase the same file is delivered instantly to your inbox, ready to edit, print, or present to stakeholders. Buy once and use immediately—no surprises, no revisions needed.

Download Your Competitive Advantage
Curious where Sanlam’s products sit—Stars, Cash Cows, Dogs, or Question Marks? This snapshot hints at their market muscle, but the full Sanlam BCG Matrix gives you quadrant-by-quadrant clarity, data-backed recommendations, and a ready-to-present Word report plus an Excel summary. Skip the guesswork: purchase the complete analysis to see which offerings to scale, defend, divest, or rethink, and get strategic moves you can act on today.
Stars
Pan‑African P&C (SanlamAllianz)
Pan‑African P&C (SanlamAllianz) targets high-growth markets where insurance penetration remains below 3% of GDP as of 2024, and Sanlam leverages the Allianz JV to secure strong positions. It leads in several African countries but requires heavy investment in distribution, brand building and regulatory execution. The business is cash hungry today, yet scale economics should improve as the footprint matures. Keep feeding it — this is the engine to become tomorrow’s cash cow.
Retail Life outside South Africa
Fast-growing middle-income segments across Africa are increasingly buying protection and funeral cover, and Sanlam maintains a solid share in priority markets. Growth consumes cash in sales forces, underwriting technology, and claims operations. Returns are set to improve as lapse rates normalize and persistency holds. Stay invested to defend share while the market expands.
Bancassurance and telco channels
Partnership distribution is scaling quickly for Sanlam: embedded bancassurance and telco funnels show high conversion and much lower CAC once live, supported by over 1 billion global mobile money accounts by 2024. Sanlam has meaningful bank and wallet access in growth markets but needs product fit, data and smoother onboarding. Funding integrations can tip adoption into a dominant funnel.
Corporate & SME insurance across Africa
Infrastructure, trade, and SME formalization are spiking demand for commercial lines across Africa; African Development Bank estimates an annual infrastructure financing gap of $130–170 billion. Sanlam’s underwriting capacity and alliances give it a credible edge in capacity and distribution. Scaling requires capital, reinsurance, and risk engineering — not cheap. Leadership today converts into annuity premiums tomorrow.
- Capital intensive
- Reinsurance dependent
- Risk engineering required
- Annuity premium growth
Wealth & retirement platforms in growth markets
Wealth and retirement platforms are accelerating as pension systems formalize across growth markets; Sanlam, listed on the JSE (SLM) and operating in about 34 countries, leverages its brand and advice footprint for an early lead in asset gathering.
Ongoing investment in platform technology, compliance, and advisor productivity is required to scale now and lock in lifetime client value; focus on platform spend and adviser enablement will protect margins as competition intensifies.
- Asset gathering: early lead in formalizing pension markets
- Scale: Sanlam present ~34 countries, JSE: SLM
- Requires: platform, compliance, advisor productivity spend
- Goal: lock lifetime client value via scale
Pan‑African P&C & wealth: scale needs heavy invest; partnerships lower CAC
Sanlam Stars (Pan‑African P&C, wealth platforms) target low‑penetration markets (<3% insurance penetration in 2024), operating in ~34 countries and requiring heavy upfront distribution and tech investment; cash‑hungry now, scale should drive annuity premiums and improved returns. Partnerships (bancassurance/telco) and 1bn mobile money accounts (2024) lower CAC and accelerate conversion.
| Metric | Value (2024) |
|---|---|
| Countries | ~34 |
| Insurance penetration | <3% GDP |
| Mobile money accounts | ~1bn |
| Infra financing gap | $130–170bn p.a. |
What is included in the product
Detailed Word Document
Concise assessment of Sanlam’s products across Stars, Cash Cows, Question Marks and Dogs, with investment and divestment recommendations.
Customizable Excel Spreadsheet
One-page Sanlam BCG Matrix highlighting unit positions to simplify portfolio decisions and speed C-suite reviews.
Cash Cows
South Africa Individual Life & Savings
South Africa Individual Life & Savings is a large, loyal book with strong market share in a mature personal-risk and savings market, generating high margins and predictable lapse patterns that deliver steady cash flow. Low incremental promo spend is required because distribution is already built, enabling disciplined pricing and service focus. Maintain service and profitability and milk excess cash to fund Sanlam’s growth bets; Sanlam’s group AUM exceeds R1.2 trillion (2024).
Group Risk & Employee Benefits (SA)
Group Risk & Employee Benefits (SA) holds a defensible share through sticky employer relationships and scale underwriting, supported by robust admin and actuarial engines. Operating leverage is high, yielding strong cash conversion despite modest top-line growth. Priority actions: optimise claims management, sharpen fee structures and harvest cash flows. The business remains a classic cash cow within Sanlam’s portfolio.
Santam South Africa (Short‑Term)
Santam South Africa is the market leader in a mature P&C market, generating steady cash with gross written premiums of about ZAR 33.0bn in 2024 and a disciplined combined ratio of c.96.9% in 2024; cyclical exposure exists but the franchise delivers consistent cash over the cycle. Investment is targeted at efficiency and claims tech rather than market share land‑grabs, preserving the combined ratio edge and free cash flow.
South Africa Investment Management
South Africa Investment Management anchors Sanlams BCG matrix as a cash cow with established mandates, brand trust and scale in core funds, supporting roughly R1.0 trillion in group AUM (2024) and delivering resilient fee income despite modest net new money flows.
- Established mandates: long‑dated institutional contracts
- Brand trust: leading domestic retail and institutional footprint
- Fees: stable recurring revenue, margin expansion via ops tune‑ups
- Capex light: savings fund higher‑growth adjacencies
Advice & Distribution Network (SA)
Deep advisor relationships and multichannel coverage in SA sustain a 6,500‑advisor network; 2024 cross‑sell rates reached 28% supporting steady lead flow and proven wallet share expansion.
Incremental spend remained low at under 3% of Advice & Distribution revenue in 2024; maintain high productivity and strict compliance to harvest referral economics.
- Network: 6,500 advisors (2024)
- Cross‑sell: 28% (2024)
- Incremental spend: <3% of revenue (2024)
- Focus: productivity, compliance, referral harvesting
2024 cash engines: Life, Investment, short-term insurance & advisers deliver steady high-margin cash
Sanlam cash cows (2024) deliver steady high-margin cash: SA Life & Savings (group AUM R1.2tn) and SA Investment Mgmt (R1.0tn) provide recurring fees; Santam SA (GWP ZAR33.0bn; combined ratio c.96.9%) and Group Risk/EB yield strong cash conversion; Advice network (6,500 advisors, 28% cross‑sell) keeps incremental spend <3%.
| Business | Key 2024 metrics |
|---|---|
| SA Life & Savings | Group AUM R1.2tn |
| SA Investment Mgmt | R1.0tn AUM |
| Santam SA | GWP ZAR33.0bn; CR 96.9% |
| Advice & Distribution | 6,500 advisors; 28% cross‑sell; spend <3% |
Preview = Final Product
Sanlam BCG Matrix
The file you're previewing on this page is the exact Sanlam BCG Matrix report you'll receive after purchase. No watermarks, no demo content—just a fully formatted, analysis-ready document crafted for strategic clarity and decision-making. After purchase the same file is delivered instantly to your inbox, ready to edit, print, or present to stakeholders. Buy once and use immediately—no surprises, no revisions needed.
Description
Download Your Competitive Advantage
Curious where Sanlam’s products sit—Stars, Cash Cows, Dogs, or Question Marks? This snapshot hints at their market muscle, but the full Sanlam BCG Matrix gives you quadrant-by-quadrant clarity, data-backed recommendations, and a ready-to-present Word report plus an Excel summary. Skip the guesswork: purchase the complete analysis to see which offerings to scale, defend, divest, or rethink, and get strategic moves you can act on today.
Stars
Pan‑African P&C (SanlamAllianz)
Pan‑African P&C (SanlamAllianz) targets high-growth markets where insurance penetration remains below 3% of GDP as of 2024, and Sanlam leverages the Allianz JV to secure strong positions. It leads in several African countries but requires heavy investment in distribution, brand building and regulatory execution. The business is cash hungry today, yet scale economics should improve as the footprint matures. Keep feeding it — this is the engine to become tomorrow’s cash cow.
Retail Life outside South Africa
Fast-growing middle-income segments across Africa are increasingly buying protection and funeral cover, and Sanlam maintains a solid share in priority markets. Growth consumes cash in sales forces, underwriting technology, and claims operations. Returns are set to improve as lapse rates normalize and persistency holds. Stay invested to defend share while the market expands.
Bancassurance and telco channels
Partnership distribution is scaling quickly for Sanlam: embedded bancassurance and telco funnels show high conversion and much lower CAC once live, supported by over 1 billion global mobile money accounts by 2024. Sanlam has meaningful bank and wallet access in growth markets but needs product fit, data and smoother onboarding. Funding integrations can tip adoption into a dominant funnel.
Corporate & SME insurance across Africa
Infrastructure, trade, and SME formalization are spiking demand for commercial lines across Africa; African Development Bank estimates an annual infrastructure financing gap of $130–170 billion. Sanlam’s underwriting capacity and alliances give it a credible edge in capacity and distribution. Scaling requires capital, reinsurance, and risk engineering — not cheap. Leadership today converts into annuity premiums tomorrow.
- Capital intensive
- Reinsurance dependent
- Risk engineering required
- Annuity premium growth
Wealth & retirement platforms in growth markets
Wealth and retirement platforms are accelerating as pension systems formalize across growth markets; Sanlam, listed on the JSE (SLM) and operating in about 34 countries, leverages its brand and advice footprint for an early lead in asset gathering.
Ongoing investment in platform technology, compliance, and advisor productivity is required to scale now and lock in lifetime client value; focus on platform spend and adviser enablement will protect margins as competition intensifies.
- Asset gathering: early lead in formalizing pension markets
- Scale: Sanlam present ~34 countries, JSE: SLM
- Requires: platform, compliance, advisor productivity spend
- Goal: lock lifetime client value via scale
Pan‑African P&C & wealth: scale needs heavy invest; partnerships lower CAC
Sanlam Stars (Pan‑African P&C, wealth platforms) target low‑penetration markets (<3% insurance penetration in 2024), operating in ~34 countries and requiring heavy upfront distribution and tech investment; cash‑hungry now, scale should drive annuity premiums and improved returns. Partnerships (bancassurance/telco) and 1bn mobile money accounts (2024) lower CAC and accelerate conversion.
| Metric | Value (2024) |
|---|---|
| Countries | ~34 |
| Insurance penetration | <3% GDP |
| Mobile money accounts | ~1bn |
| Infra financing gap | $130–170bn p.a. |
What is included in the product
Detailed Word Document
Concise assessment of Sanlam’s products across Stars, Cash Cows, Question Marks and Dogs, with investment and divestment recommendations.
Customizable Excel Spreadsheet
One-page Sanlam BCG Matrix highlighting unit positions to simplify portfolio decisions and speed C-suite reviews.
Cash Cows
South Africa Individual Life & Savings
South Africa Individual Life & Savings is a large, loyal book with strong market share in a mature personal-risk and savings market, generating high margins and predictable lapse patterns that deliver steady cash flow. Low incremental promo spend is required because distribution is already built, enabling disciplined pricing and service focus. Maintain service and profitability and milk excess cash to fund Sanlam’s growth bets; Sanlam’s group AUM exceeds R1.2 trillion (2024).
Group Risk & Employee Benefits (SA)
Group Risk & Employee Benefits (SA) holds a defensible share through sticky employer relationships and scale underwriting, supported by robust admin and actuarial engines. Operating leverage is high, yielding strong cash conversion despite modest top-line growth. Priority actions: optimise claims management, sharpen fee structures and harvest cash flows. The business remains a classic cash cow within Sanlam’s portfolio.
Santam South Africa (Short‑Term)
Santam South Africa is the market leader in a mature P&C market, generating steady cash with gross written premiums of about ZAR 33.0bn in 2024 and a disciplined combined ratio of c.96.9% in 2024; cyclical exposure exists but the franchise delivers consistent cash over the cycle. Investment is targeted at efficiency and claims tech rather than market share land‑grabs, preserving the combined ratio edge and free cash flow.
South Africa Investment Management
South Africa Investment Management anchors Sanlams BCG matrix as a cash cow with established mandates, brand trust and scale in core funds, supporting roughly R1.0 trillion in group AUM (2024) and delivering resilient fee income despite modest net new money flows.
- Established mandates: long‑dated institutional contracts
- Brand trust: leading domestic retail and institutional footprint
- Fees: stable recurring revenue, margin expansion via ops tune‑ups
- Capex light: savings fund higher‑growth adjacencies
Advice & Distribution Network (SA)
Deep advisor relationships and multichannel coverage in SA sustain a 6,500‑advisor network; 2024 cross‑sell rates reached 28% supporting steady lead flow and proven wallet share expansion.
Incremental spend remained low at under 3% of Advice & Distribution revenue in 2024; maintain high productivity and strict compliance to harvest referral economics.
- Network: 6,500 advisors (2024)
- Cross‑sell: 28% (2024)
- Incremental spend: <3% of revenue (2024)
- Focus: productivity, compliance, referral harvesting
2024 cash engines: Life, Investment, short-term insurance & advisers deliver steady high-margin cash
Sanlam cash cows (2024) deliver steady high-margin cash: SA Life & Savings (group AUM R1.2tn) and SA Investment Mgmt (R1.0tn) provide recurring fees; Santam SA (GWP ZAR33.0bn; combined ratio c.96.9%) and Group Risk/EB yield strong cash conversion; Advice network (6,500 advisors, 28% cross‑sell) keeps incremental spend <3%.
| Business | Key 2024 metrics |
|---|---|
| SA Life & Savings | Group AUM R1.2tn |
| SA Investment Mgmt | R1.0tn AUM |
| Santam SA | GWP ZAR33.0bn; CR 96.9% |
| Advice & Distribution | 6,500 advisors; 28% cross‑sell; spend <3% |
Preview = Final Product
Sanlam BCG Matrix
The file you're previewing on this page is the exact Sanlam BCG Matrix report you'll receive after purchase. No watermarks, no demo content—just a fully formatted, analysis-ready document crafted for strategic clarity and decision-making. After purchase the same file is delivered instantly to your inbox, ready to edit, print, or present to stakeholders. Buy once and use immediately—no surprises, no revisions needed.











